American Journal of Operations Research
Vol.05 No.03(2015), Article ID:56652,2 pages
10.4236/ajor.2015.53017
Combining Lean Concepts & Tools with the DMAIC Framework to Improve Processes and Reduce Waste
Mazen Arafeh
The Department of Industrial Engineering, Faculty of Engineering & Technology, The University of Jordan, Amman, Jordan
Email: hfmazen@gmail.com
Copyright © 2015 by author and Scientific Research Publishing Inc.
This work is licensed under the Creative Commons Attribution International License (CC BY).
http://creativecommons.org/licenses/by/4.0/


Received 15 April 2015; accepted 23 May 2015; published 26 May 2015
ABSTRACT
Six Sigma DMAIC methodology has been applied to systematically apply lean manufacturing concepts and tools in order to improve productivity in a local company specialized in the manufacturing of safety and fire resistance metal doors, windows, and frames. In-depth analysis of the plant processes unfolded different critical processes, specifically foam injection process and sheet metal cutting process. Throughout the different project phases, various improvements had been implemented to reduce production cycle time from 216 min to 161 min; non-value added activities in the different processes were identified and eliminated. Plant layout and machine reconfiguration reduced backtracking and unutilized space. Percentage of defective doors (needing rework) dropped from 100% to only 15%. The successful implementation of this project is largely due to top management active involvement and participation of workers and operators in all stages of the project. Finally, new policies and mentoring programs are introduced to maintain improvements.
Keywords:
Six Sigma, DMAIC, Lean Manufacturing, Value-Added Activities, Production Cycle Time, Safety and Fire Resistant Doors

1. Introduction
Heightened challenges from competitors have prompted many manufacturing firms to adopt new manufacturing approaches. Particularly salient among these is the concept of lean production [1] [2] .
The concept of Lean Thinking (LT) developed from Toyota Production System (TPS) involves determining the value of any process by distinguishing valued-added activities or steps from non-value added activities or steps and eliminating waste, so that every step adds value to the process [3] . Lean is about controlling the resources in accordance with the customers’ needs and about reducing unnecessary waste, including the waste of time and material [4] .
Six Sigma (SS) was developed at Motorola by an engineer Bill Smith in the mid-1980s. SS is a business improvement approach that seeks to find and eliminate causes of defects or mistakes in business processes by focusing on process outputs which are critical in the eyes of customers [3] . SS started on the shop floor and then moved into the front offices [5] . Nowadays, SS is being used in many organizations and environments, for example, manufacturing, services, and healthcare [6] .
The Define, Measure, Analyze, Improve and Control phases (DMAIC) present a clear strategy for the deployment of SS projects [7] . SS projects are usually initiated by the SS champion and the SS Black Belt (SSBB). Champions are generally upper managers. They serve as mentors and leaders; they support project teams, allocate resources, and remove barriers. SSBB belts lead improvement projects full time, supported by project team members [8] .
This work presents an application of the Six Sigma DMAIC methodology to improve processes in a local company specialized in the manufacturing of safety and fire resistance metal doors, windows, and frames. The company suffered from inefficient processes and operations resulting in large amounts of dollar losses.
Fire resistant doors are comprised of the frames, leafs, covers, U-shape, insulation material (polyurethane- foam), and door accessories (hinges, hands, and panic device), as shown in Figure 1.
Specifically, this work aimed at firstly reducing manufacturing cycle time and improving production flow by smoothing the flow of operations and reducing the amount of rework, and secondly reducing material waste.
2. Methodology
The Six Sigma DMAIC methodology is adopted to execute the improvement project since it provides a proven framework for problem solving. The DMAIC methodology builds on three fundamental principles: firstly, results-focused; driven by data, facts, and metrics. Secondly, it is project-based and project-structured. Thirdly, it links a combination of tools, tasks, and deliverables that varies by step in the method [9] .
In the define phase, we start by identifying improvement opportunities, clarifying scope and defining goals. Identifying improvement opportunities is accomplished by capturing the voice of the customer (VOC), the voice

Figure 1. Door parts.
of the process (VOP), and the voice of business (VOB). Customers may be classified as internal or external. In this project we focus our attention at the internal customers, more often known as the voice of the employee (VOE) represented by those who work in the company coming from different departments. The VOB is derived from financial information and data. The VOP evaluates how well or poorly the process is performing as it relates to the VOB and VOC. By paying attention to the VOP, analysts can identify poorly performing processes and use the information to identify and prioritize potential projects.
In the measure phase, data collection is carried out and the initial performance is measured against customer requirements. The analyze phase consists of analysis of the root cause(s), accounting for the errors or defects that are quantified by the data collected. In the improve phase, alternative solutions to eliminate the root cause(s) or errors or defects are examined and the optimal one(s) are selected, the system performance is then evaluated after implementing the process improvements. The control phase entails development and implementation of a monitoring system to reduce future errors, and documentation of results and recommendations for additional action.
3. Application of the DMAIC Methodology and Discussion
3.1. Define Stage
The improvement team was led by a Six Sigma Black Belt (SSBB). The SSBB and the champion described and scoped the project. They also met with the selected team members, explained to them the project objectives and importance, discussed with them their roles and listened to their feedback.
To collect the VOC, VOP and VOB, several brainstorming sessions were carried out. Procurement department brought the attention to the waste of material from a financial point of view. Manager and workers (Punchers, welders, etc…) discussed the several problems they face while they perform their daily work. The brainstorming sessions mainly focused on three major opportunities for improvements: unsmooth flow of production processes, material waste, and time waste.
The team prepared a preliminary process map as shown in Figure 2. The figure presents the different manu-

Figure 2. Process flow chart.
facturing processes. One of the main reasons for of drawing a process map is to clarify processes, roles and set a clear scope for the project. The process map enlightened the plant staff members because they have never seen their processes modeled end-to-end. They only knew fragments of the process and were unaware of how what they did fits into the overall outcome.
The foam injection step is where the insulation material (Polyurethane) is prepared and sprayed (injected) into the assembled door. The Polyurethane used in this process is a two-component reactive system mixed at a spray gun. Hence, it is known as spray polyurethane foam (SPF) materials.
When small items are being cut out from large objects, two problems arise. The first one is the assortment problem addressing the issue of choosing proper dimensions for the large objects. The second one is the trim loss problem addressing the issue of how to cut out the small items from the given large objects in such a way that wastage material will be minimized. In practice, the small items are known as order list and the large objects are known as stock material. In the cutting process the stock material can seldom be used as a whole but some residual pieces or trim loss will be produced. Since the primary objective of the cutting process is to minimize the wastage the problem is known as trim loss problem. The combination of the assortment problem and the trim loss problem is known as the cutting stock problem (CSP) [10] .
3.2. Measure Phase
In order to assess the initial state of the plant, the measure phase starts with data collection, followed by analyzing the initial state. Data collection points were selected and identified after studying the plant layout and the observing the plant in operation such that minimum interference with work flow could occur. The data collected includes plant layout dimensions, machine dimensions, transportation distances traveled, backtracking, in addition to the raw material waste. Preliminary analysis of the information gathered from the brainstorming session and examining the data gathered, we identified three major problematic areas. Firstly, a poor plant layout, secondly, the foam injection process, and thirdly, the cutting process.
Optimizing any process means maximizing the proportion of value adding activities, while eliminating non- value-adding activities as far as possible or at least reducing them to a minimum [11] . The term value added refers to any activity that transforms the product or deliverable, in the view of the customer, to a more complete state. The product has been physically changed, and its value to the customer has increased. Conversely, the term non-value-added refers to activity that consumes time (people expense), material, and/or space (facilities expense), yet does not physically advance the product or increase its value [12] . Value-added flow charts are created to identify and separate value adding activating from non-value adding ones. Figure 3 resents a value- added flow chart for cutting a frame. We note here that the only value adding activity is cutting, all other activities are non-value-adding activities.
Similar flow charts were created for the remaining parts in the making a door as shown in Figure 4.
Analyzing the process of making a door, we found that approximately only 45% of the processing time is value-added. The plant operated at a cycle time of 216 minutes.
Figure 5 shows a Pareto chart of the non-value added times for the different steps. Foam injection process predominantly contributes to non-value activities followed by cutting processes.
3.2.1. Foam Injection Process
We created a process flowchart to better understand the foam injection process as shown in Figure 6.
Orders totaling twenty doors were sampled and examined to identify their defects. The processing times, the defects with their occurrence frequency, and quantities of foam waste were recorded. There are mainly 5 defects. Figure 7 presents a Pareto chart for these defects ordered according to their frequency of occurrence. Fifty percent of the doors were unleveled surface doors. Unleveled doors needed rework adding an average of 40 minutes to the cycle time.
Inhomogeneous foam distribution means that the foam did not spread evenly inside the door. Unmixed foam means that the mixing of two liquids material was not complete. In this case, the door is irreparable and hence, it is scraped. We can see the 15% of the production is scraped.
The amount of foam waste was also recorded and another Pareto chart was created as shown in Figure 8. Unleveled doors, foam leakage, and inhomogeneous foam produce about 95% of foam waste.

Figure 3. A value-added flow chart for preparing a frame.
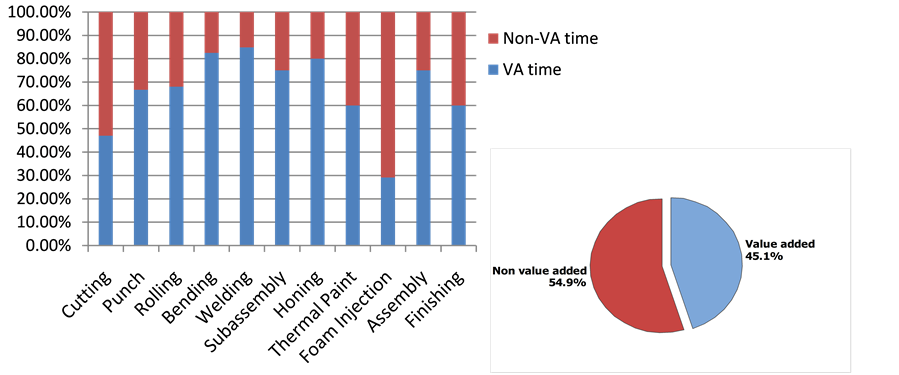
Figure 4. Value-added vs. non-value-added for steps in preparing a door.

Figure 5. Pareto chart of non-value-added time.
![]()
Figure 6. Foam injection process flow chart.
![]()
Figure 7. Pareto chart of foam injection process (frequency of defects).
![]()
Figure 8. Pareto chart of foam injection process (weight of foam).
3.2.2. Cutting Process
The operator receives an order and selects one of four different standard panels to use to prepare the order. The operator also performs manual calculations relying on his experience to determine how to cut the panel into the required parts. Manual calculations and experience does not yield the minimum quantity of off cuts. Twenty five percent of the cutting time is spent on this step and the total quantity of off cuts was estimated to be 24% of the original panels.
3.2.3. Unsmooth Flow of Production Processes
The total transportation distance travelled for a sample of the parts manufactured at the plant is estimated to be 323 m. of which, 62% is backtracking. Figure 9 shows the distances travelled (drawn in black) in production of a frame and backtracking drawn in red.
Total unutilized area is estimated to be approximately 17% of the total plant area where piles of scrap, debris, and unnecessary items were accumulated.
3.3. Analyze
After observing the processes at the plant and collecting data, efforts in the analyze phase are focused on investigating the root causes of the problems in the processes. Brainstorming sessions were held to examine process flow charts, and cause and effect diagrams are created to identify the root causes of each problem.
3.3.1. Foam Injection Process
Based on the observations and the data collected in the measure phase, the defects shown in Figure 7 are analyzed and traced back to their root causes. A cause and effect diagram was created to identify these causes as shown in Figure 10.
A Pareto chart was created for the causes as they relate to the quantity of foam waste resulted as shown in Figure 11.
The divider rack shown in Figure 12 was installed by the operator in an effort aimed at increasing the productivity of the foam injection process; however, it turned out to cause fifty percent of the foam waste, followed by the wooden stoppers used to close the holes used for injection, and the low foam flow rate resulting from the low pressure in the spraying gun. The foam spayed into the doors would leak because the wooden stoppers were not airtight.
![]()
Figure 9. Frame production path.
![]()
Figure 10. Foam waste cause and effect diagram.
![]()
Figure 11. Pareto chart for the root cause.
![]()
Figure 12. The divider rack.
3.3.2. Cutting Process
From the analysis of the data gathered in the measure phase a cause and effect diagram for high offcuts percentage and long cutting time were created as shown in Figure 13 and Figure 14, respectively.
Manual calculations appeared to be causing both long cutting time and high trim loss. The lack of standard operating procedures (SOPs) allowing each operator to rely on his own experience in performing the manual calculations. In addition, the absence of a preventive maintenance program caused many of the saw blades to wear prematurely.
3.3.3. Unsmooth Flow of Production Processes
Figure 15 presents a cause and effect diagram for unsmooth flow of operations; we can clearly see that many of the root causes presented in this C & E diagram are were also presented in the previous C & E diagrams emphasizing the connection between the causes and their effects. Specifically mentioned here, is backtracking and excess distance. Backtracking and excess transportation distance is caused by improper location of machines. Unorganized and unclean workplace is another root cause.
While analyzing root causes for the problems identified, the figures also presented clues for possible solutions. For instance, it was clear that the lack of order and tidiness regarding tools, machines, material, scrap and storage, in addition to the lack of cleanliness throughout the plant is a major cause of delay and unsmooth operations. Machine locations and arrangement and plant layout should also be considered in the improve stage.
3.4. Improve & Control Phases
The goal of the improve phase is to implement the changes to the system that are needed to improve it [13] .
Several brainstorming sessions were held to identify high potential improvement opportunities. The value of the improvement methods applied is that they encompass the best techniques for driving out defects and improving process efficiency and capacity [14] .
3.4.1. Foam Injection Process
The improvement efforts started by removing the divider rack. A new spraying gun was purchased and used. The new gun provided the required foam spray flow rate. Using a tape instead of the wooden stoppers to seal the injection holes stopped the leakage of foam. After carefully studying the spraying operation, markings on the valves helped stabilizing the gun mixing of the two foam materials. After these solutions were implemented, only 15% of doors needed rework and the amount of foam waste dropped by 81%.
![]()
Figure 13. Cutoffs cause and effect diagram.
![]()
Figure 14. Long cutting time cause and effect diagram.
![]()
Figure 15. Unsmooth operations cause and effect diagram.
3.4.2. Cutting Process
It only seemed logical that the attempted solution should solve both problems; a simple and inexpensive, yet very efficient solution was implemented by using Smart-2D-Cutting® software. The software is used to determine the optimal standard sheet and the optimal way to cut the sheet to produce the needed sheets with minimum amount of leftovers. The software was used in the factory and data was collected for two weeks. The trim loss was reduced by 39% and the cutting time by 26%.
Periodical checks as a simple preventive maintenance program were performed, and recommendations to the upper management to have a complete preventive maintenance program as a future improvement project.
3.4.3. Unsmooth Flow of Production Processes
A Predecessor-successor processes table for the different parts manufactured similar to the one shown in Table 1 were prepared and analyzed resulting in a new configuration of the equipment producing an efficient layout of
the plant to facilitate smooth flow of processes.
The improved plant layout with the new equipment locations is shown in Figure 16.
A process is impacted by its environment, improvements in the general state of the work area, including access to hand tools, and so on, are essential to smooth flow of production processes, especially critical here are the cleanliness and general housekeeping status of any area. Once a process has been physically reconfigured, 5S methods are applied to its work operations. 5S is a workplace organization method that can help improve the efficiency and management of operations [15] .
The term “5Ss” derives from the Japanese words for five practices leading to a clean and manageable work area: seiri (organization), seiton (tidiness), seiso (purity), seiketsu (cleanliness), and shitsuke (discipline) [2] . These are defined in Table 2.
The results of applying the 5S practices and the new equipment configuration are presented in Table 3.
Combined effect of all the improvement steps resulted in an improved cycle time of 161 minutes.

Figure 16. Improved frame path.

Table 1. Frame processing.
Table 2. Five S definition.
Table 3. Smooth flow of production processes improvements.
3.5. Control Stage
In the Control stage we maintain the changes we made in order to sustain the improvements [8] .
The control phase requires that policies and procedures be established to maintain the improvements created. Management commitment is essential to the implementation of this phase. Training and mentoring plans were put into place. The engineer responsible for the cutting process went through a training session on using the Smart-2D-Cutting ® software. Managers had several meetings with the operators explaining to them the new methods and procedures. Occasionally, operators resist changes, especially when it is imposed by upper management; however, since operators were brought in the early stage of this project, they welcomed these changes and implemented them. This indirectly affected the reckless and lack of motivation that existed among few workers. Elementary preventive maintenance program was implemented. In addition, examples of reports, data collection forms, and similar informational and control documents were prepared.
4. Conclusion
The DMAIC methodology was successfully used to implement lean manufacturing concepts in a plant specialized in the manufacturing of safety and fire resistance metal doors. The implementation included the use of the different quality and lean manufacturing tools resulting in improved operations such as value-added flow charts, C & E diagrams, and Pareto diagrams. The huge buy-in from the workers and operators in the shop floor to this improvement project was due to the fact that they were brought on board right from the beginning of the project and that their input and feedback were taken seriously by management. The upper management active involvement and open minded attitude encourage their workers to come up with ideas and solutions.
References
- Womack, J.P., Jones, D.T. and Roos, D. (2008) The Machine That Changed the World. Simon and Schuster, New York.
- Womack, J.P. and Jones, D.T. (2010) Lean Thinking: Banish Waste and Create Wealth in Your Corporation. Simon and Schuster, New York.
- Antony, J. (2009) Six Sigma vs. TQM: Some Perspectives from Leading Practitioners and Academics. International Journal of Productivity and Performance Management, 58, 274-279. http://dx.doi.org/10.1108/17410400910938869
- Andersson, R., Eriksson, H. and Torstensson, H. (2006) Similarities and Differences between TQM, Six Sigma and Lean. The TQM Magazine, 18, 282-296. http://dx.doi.org/10.1108/09544780610660004
- Munro, R.A. (2009) Lean Six Sigma for the Healthcare Practice: A Pocket Guide. ASQ Quality Press, Milwaukee.
- Arafeh, M., et al. (2014) Six Sigma Applied to Reduce Patients’ Waiting Time in a Cancer Pharmacy. International Journal of Six Sigma and Competitive Advantage, 8, 105-124. http://dx.doi.org/10.1504/IJSSCA.2014.064256
- Voehl, F., et al. (2013) The Lean Six Sigma Black Belt Handbook: Tools and Methods for Process Acceleration. CRC Press, Boca Raton. http://dx.doi.org/10.1201/b15163
- Brue, G. and Formisano, R.A. (2002) Six Sigma for Managers. McGraw-Hill, New York.
- Hambleton, L. (2007) Treasure Chest of Six Sigma Growth Methods, Tools, and Best Practices. Pearson Education, New York.
- Karelahti, J. (2002) Solving the Cutting Stock Problem in the Steel Industry. Helsinki University of Technology, Helsinki.
- Lunau, S. and John, A. (2008) Six Sigma+ Lean Toolset: Executing Improvement Projects Successfully. Springer, Berlin.
- Carreira, B. (2005) Lean Manufacturing That Works: Powerful Tools for Dramatically Reducing Waste and Maximizing Profits. AMACOM Div American Management Association, New York.
- Pyzdek, T. and Keller, P.A. (2003) The Six Sigma Handbook: A Complete Guide for Green Belts, Black Belts, and Managers at All Levels. McGraw-Hill, New York.
- Pande, P.S. and Neuman, R.P. (2000) The Six Sigma Way: How GE, Motorola, and Other Top Companies Are Honing Their Performance. McGraw-Hill, New York.
- Munro, R.A., et al. (2008) The Certified Six Sigma Green Belt Handbook. ASQ Quality Press, Milwaukee.