Journal of Analytical Sciences, Methods and Instrumentation
Vol.2 No.3(2012), Article ID:23291,4 pages DOI:10.4236/jasmi.2012.23028
Contribution to the Design of a Pottery Kiln Using as Fuel a Mixture of Cellulosic and Plastic Materials: Influence of the Proportion of Plastic on the Emissions of NO, CO2, O2
![]()
1Laboratory of Physics and Chemistry of the Environment, University of Ouagadougou, Ouagadougou, Burkina Faso; 2Prime Institute, Department Fluid, Thermal, Combustion, ENSMA CNRS University of Poitiers, Chasseneuil, France.
Email: *salifou_ouiminga@univ-ouaga.bf, salif0477@yahoo.com
Received April 18th, 2012; revised May 14th, 2012; accepted May 25th, 2012
Keywords: Polyethylene; Millet Stalks; Numerical Simulation; Gaseous Emissions
ABSTRACT
This paper concerns the study of the influence of the proportion of plastic from polyethylene, on the yields of gas emissions during the combustion of the mixture of “millet stalks and polyethylene plastic bags”, in a prototype of kiln of potters. During these investigations, we looked at the rate of residual oxygen (O2) and emissions of carbon dioxide (CO2) and nitrogen monoxide (NO), as a function of primary air flow (Q1) and secondary airflow (Q2). The potter’s kilns are considered those fueled by natural air flow. The primary air flows ranging from 45 to 85 Nm3∙h–1 and secondary air flows from 20 to 60 Nm3∙h–1. To conduct this numerical study, the model used is “reactor” based on the code CHEMKIN II. The modeled area is composed into a multitude of perfectly stirred reactors (PSR) and the kinetic model has 893 species and 113 reversible chemical reactions. The results show that in our test conditions, the increasing of the rate of plastic in the mixture produces a decrease of the residual oxygen content, due to higher oxygen consumption regardless of the airflow. The CO2 emissions are an increasing function of the rate of plastic (polyethylene) in the fuel mixture. Finally, NO emissions are increasing functions of the mass of plastic for a proportions less than or equal to 20%, and are essentially controlled by the temperature of the reactional medium.
1. Introduction
The pottery is, for some countries development paths, an alternative to fight against poverty. In fact it gives people, composed mostly of farmers, an occupation for profit throughout the dry season. However, this type of activity causes problems with fuel supplies. Indeed, millet stalks are one of the fuels used in the field of pottery [1] because they are accessible and have a low cost. However, they are also used in breeding for nutrition of some animals (cattle, donkeys, ) and as an ingredient for making compost (organic fertilizer used in agriculture, gardening,
 ). Given the environmental problems caused by waste plastics including plastic bags (made of polyethylene) in most African countries and given the problems of recycling (very few plastic bags recycled to date), we have proposed to couple the millet stalks and the plastic polyethylene bags to make a fuel. Plastic bags are used here as an additional fuel. The combination of these two fuels, in the potter’s kilns, fuels allows to eliminate, in part, the plastic waste and reduce the use of millet stalks as fuel. To optimize this coupling, we have, in this paper, tried to see what would be the effect of the proportion of plastic in the mixture, on the gaseous emissions during the homogeneous combustion phase in a prototype of potters kiln. For the prototype of kiln studied, we chose a model with natural draft ascending, simple to implement, with the geometry of the combustion zone which matches that models the program “reactor” that we used. Our attention was focused on the following gases: the residual oxygen (O2), carbon dioxide (CO2) and nitrogen monoxide (NO). For the last two, there is a gas that has a strong impact on the greenhouse effect and the health of humans. Furthermore it is the gaseous species that the program “reactor” can follow. The study was conducted following for the three combustion regimes: lack of air, stoichiometry and excess air. To gain a broad range of data for a rigorous investigation for the impact of the proportion of plastic on the formation of gaseous species for different primary air flow (Q1) and secondary airflow (Q2), different initial conditions has been studied. The mixtures “% of millet stalks - % of plastic” are: “100% - 0%”, “95% - 5%”, “90% - 10%”, “85% - 15%”, “80% - 20 %”, “75% - 25%” and “70% - 30%”. The airflows vary from 45 to 85 Nm3∙h–1 for Q1 and from 20 to 60 Nm3∙h–1 for Q2.
2. Definition of Fuels
Millet stalks come from crops that farmers carry out each season. They are found in significant quantity, since millet (sorghum) is one of the food most grown in Burkina (the staple food consumed by most people). They are mainly composed of cellulose, hemicelluloses and lignin, which account for majority of organic matter (60% - 80%) of the plant [2]. The Polyethylene (PE) belongs to the family of polyolefin. There are two types of PE: the high density polyethylene (HDPE) and the low density polyethylene (LDPE: it is that we considered in this paper). Their density varies between 915 and 950 kg∙m–3. PE is often used in the manufacture of films and plastic bags. It is composed of 85% of carbon and 15% of hydrogen [3]. It is composed of 99% of volatile matter and 1% of fixed carbon [4]. The Polyethylene has the distinction of having a very low moisture content of about 2% to 3% [5]. Elementary analysis of millet stalks and plastic bags from polyethylene was performed to accurately characterize the fuels and conduct a balances of matter. For this, samples of each component were analyzed for determination of major elements that is to say: C, H, O, N, S, Cl, H2O and ashes. These tests were conducted by the Department of Analysis of the National Center for Scientific Research (CNRS) on five different samples of each fuel. The values presented in Table 1 correspond to the average levels from the five samples analyzed.
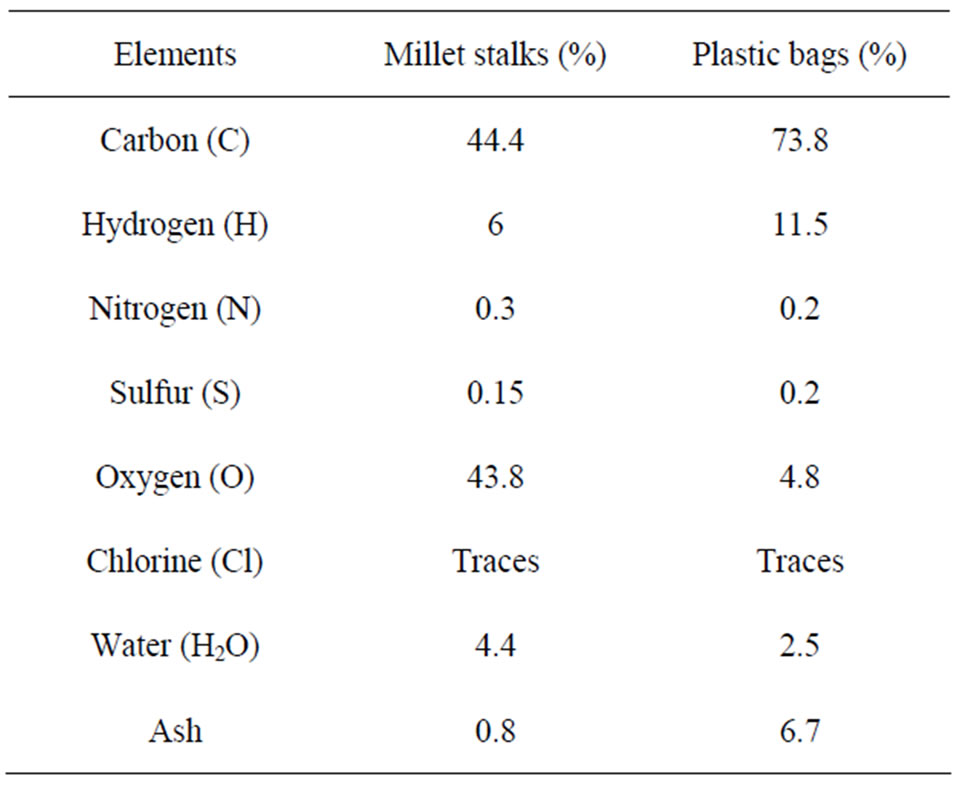
Table 1. Elemental composition of each constituent of combustible mixture.
3. Presentation of the Model
The numerical solution of the chemical combustion can be achieved by using a specific computer code. The most commonly used is the CHEMKIN II code, developed at Sandia Laboratory by [6].
The choice of model “Reactor” + CHEMKIN II is justified by the fact that we model the phase homogeneous combustion that is controlled by chemical kinetics. This justifies the dominance of the phenomenon of chemical kinetics to that of flows. In addition, this model has been used by [7-9] to model the chemical process of combustion in a kiln with the same geometry as the one we model. As in our case [7-9] have considered in their work, a mixture of cellulosic and plastic materials. It is therefore necessary to use software which consists of a detailed chemical model coupled to a simple physical model, which is the case with CHEMKIN II.
Principle of the Program Reactor
This program (“Reactor”), specific to this application, was developed by [10] and optimized by [8]. He had to be repeated and modified to apply to our study. It uses the CHEMKIN II package developed by [6] and the model of perfectly stirred reactors (PSR) developed by [11]. The chemical model used is one developed by [12] on the reburning of nitrogen oxides. The program allows to modelling all the chemical reactions that occur in gaseous combustion zone, ie the area between the top of the solid bed and the out of the kiln. The modeled area is divided into an infinite number of PSR self-incrementing over the entire height of the kiln. It should therefore allow the determination of the composition of exhaust smoke from the kiln by the mere knowledge of the mole fractions of products formed during thermal degradation of mixing fuel and oxidizer flows. Modeling is achieved when the combustion in the kiln is assumed established. It is then placed in the case where the solid bed is half its original height. The program allows to monitor the evolution of a horizontal slice (modeled by a PSR) of gas throughout his career in the kiln. Combustion being established, all combustion parameters such as temperature, pressure, flow, oxygen concentration and exhaust emissions are stable over time. This portion of gas may be regarded as representative of established combustion in the reactor.
The oxidation zone of degradation gases is thus divided into different superimposed perfectly stirred reactors, incrementing itself over the entire height of the kiln. The system’s main advantages:
- The division into an infinite number of small perfect reactors can be closer to the maximum of combustion conditions encountered in this type of kiln;
- The small size of each PSR allows to suggest that the mixture is homogeneous in its midst;
- Taking into account the important experimental parameters such as air flow and combustion temperatures;
- Taking into account the secondary air inlets and their locations for the respect of the residence time of gas in an oxidizing environment and high temperature;
- Monitoring the formation of pollutants throughout the height of the kiln: identification of significant areas of pollutant formation;
- The system is scalable and easily adaptable to other geometries of kiln.
This model was designed based on assumptions made in the case of combustion with excess of primary air upper or equal to 1, that is to say with very fast diffusion rates so that the combustion is controlled by chemical kinetics. However, comparison of experimental and theoretical results achieved by [7] allowed to observe a good agreement during combustion with excess air less than 1. Similarly, [9] perform tests on the model behavior as a function of excess air and show that the use of the model can be generalized to all experimental conditions regardless of the values of excess air.
Figure 1 shows the principle of slicing, in our application to the modeling of pottery kilns.
The cutting of the combustion zone in primary, secondary and tertiary zone has an important role.
- Primary zone: In this area, there is the oxidation reactions of hydrocarbons and nitrogenous intermediates such as HCN, NH3, HNCO to form mainly CO, CO2, NO and N2. It is here that the phases of ignition and homogeneous combustion occur.
- Secondary zone: It is characterized by a tiered of three inlets of secondary air and is the zone of a homogeneous combustion. The inlets can:
· combustion of unburned (soot, tar, ) coming from the primary zone;
· oxidation of reactional intermediates that could not be oxidized in the primary area;
· reduction of oxides (oxides of carbon, of nitrogen ) trained in primary combustion zone.
- Tertiary Zone: In this part of the kiln, combustion ends with the extinction of the flames, characterized by lower of combustion temperature.
The program requires as the initial data of combustion air flows, temperatures in the different combustion zones (primary, secondary and tertiary), the rate of mass loss, the burning time and composition of devolatilization gases from thermal degradation of the fuel mixture solid. Figure 2 shows in detail how the program “reactor” that operate.
Using different data in the input file REACTEUR.inp and depending on the residence time of the gas in each perfectly stirred reactor, the program calculates the volume of each PSR: this volume is different within the different zones of the kiln according to the flow rates of gas (fuel and oxidizer flow rates, temperatures). After calculating the volumes of each perfectly stirred reactors, the program calculates the number “n” of PSR necessary

Figure 1. Principle of kiln modelling.
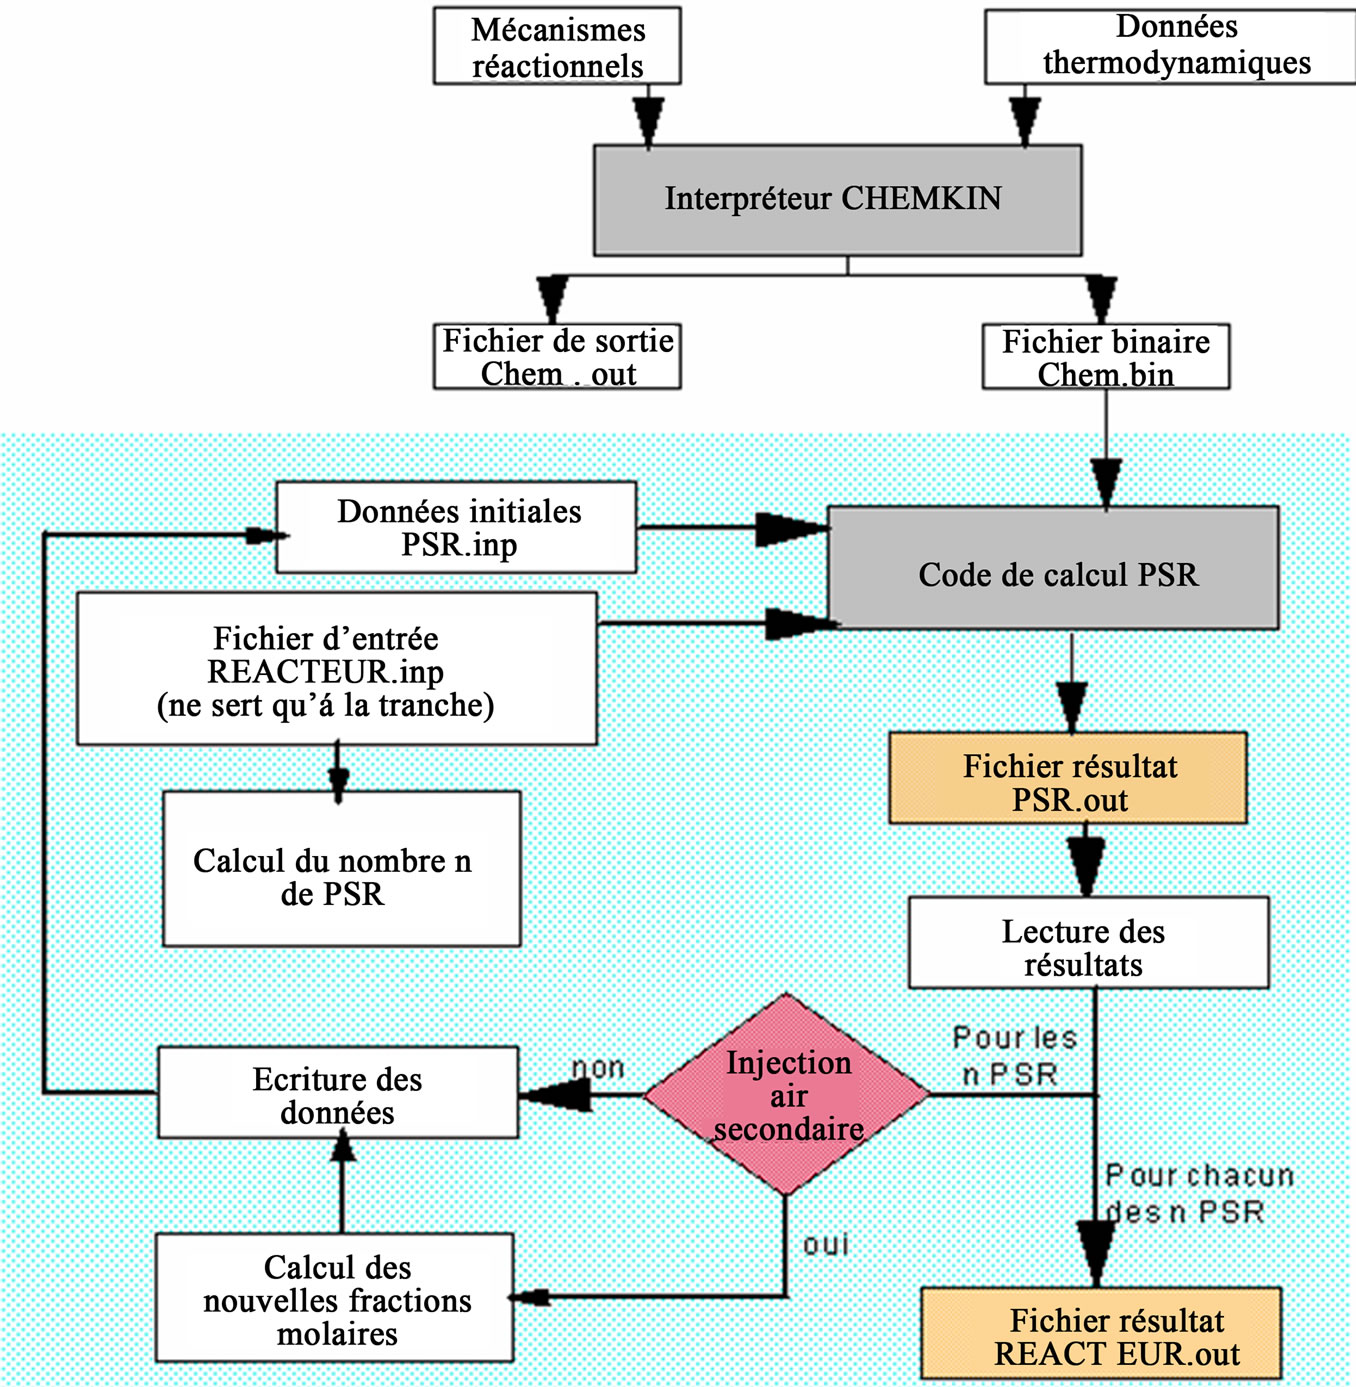
Figure 2. Detailed architecture of the program “Reactor”.
to simulate the desired area. Then, the program performs n times the loop of calculation for each PSR. At the end of the calculation, an output file is created: REACTEUR. out. This file allows the recording of the concentration of different chemical species at each calculation step, that is to say after each PSR and the location (height) of the corresponding edge. It is then possible to monitor the formation of each pollutant at each point of the kiln. In addition, following the command selected, the program can calculate the velocities of each reaction involved and the net rates of formation and reduction of each gas species within the range desired.
4. Determination of Initial Conditions
4.1. Durations and Temperatures of Combustion
The model of prototype of our study is an updraft kiln listed in West Africa [13]. Thus the model of kiln type III was chosen because it has the same geometry that the kiln modeled by the model “Reactor” + CHEMKIN II. It’s also a kiln with which the average of temperatures of cooking is 950˚C and its use, the technology and the construction costs remain affordable for most potters. Preliminary tests of combustion have been achieved in this prototype to obtain: the temperature and duration of combustion in homogeneous phase. These tests have involved mixtures “% of millet stalks - % of plastic bags”: 100% - 0%, 95% - 5%, 90% - 10%, 85% - 15%; 80% - 20%, 75% - 25%, 70% - 30%. In Table 2 we present a summary of these measures.
4.2. The Theoretic Stoichiometric Airflow of Combustion
The mass distribution of millet stalks and plastic, and the duration and temperature of the combustion in established phase in the prototype of kiln, for a fuel mass of 400 g, are given in Table 3.
From the elemental analysis performed for each of the two fuels, it is possible to determine the chemical elemental composition of each, then mass and the molar composition of each fuel mixture studied. The composition of the mixture prepared in the kiln is:
Case 1: Mixture 100% - 0% Carbon: (400 × 44.4%) = 177.6 g or 14.80 moles Hydrogen: (400 × 6%) = 24.00 g or 24.00 moles Nitrogen: (400 × 0.3%) = 1.2 g or 0.0857 mole
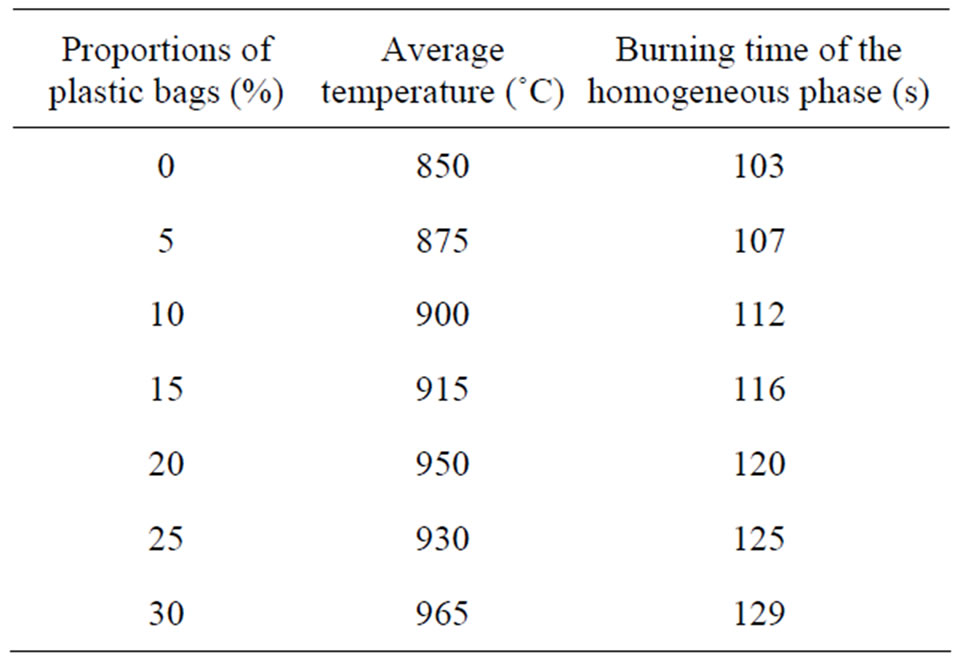
Table 2. Temperatures and average times of combustion in established phase, for 400 g of fuel.

Table 3. Durations and temperatures of combustion; Mass distribution for plastic and millet stalks in each mixture studied.
Sulfur: (400 × 0.15%) = 0.60 g or 0.0187 mole Oxygen: (400 × 43.8%) = 175.20 g or 10.95 moles Case 2: Mixture 95% - 5% Carbon: (380 × 44.4%) + (20 × 73.8%) = 183.48 g or 15.29 moles Hydrogen: (380 × 6%) + (20 × 11.5%) = 25.10 g or 25.10 moles Nitrogen: (380 × 0.3%) + (20 × 0.2%) = 1.18 g or 0.0842 mole Sulfur: (380 × 0.15%) + (20 × 0.2%) = 0.61 g or 0.0191 mole Oxygen: (380 × 43.8%) + (20 × 4.8%) = 167.40 g or 10.4625 mole Case 3: Mixture 90% - 10% Carbon: (360 × 44.4%) + (40 × 73.8%) = 189.36 g or 15.78 moles Hydrogen: (360 × 6%) + (40 × 11.5%) = 26.20 g or 26.20 moles Nitrogen: (360 × 0.3%) + (40 × 0.2%) = 1.16 g or 0.0829 mole Sulfur: (360 × 0.15%) + (40 × 0.2%) = 0.62 g or 0.0194 mole Oxygen: (360 × 43.8%) + (40 × 4.8%) = 159.6 g or 9.975 moles Case 4: Mixture 85% - 15% Carbon: (340 × 44.4%) + (60 × 73.8%) = 195.24 g or 16.27 moles Hydrogen: (340 × 6%) + (60 × 11.5%) = 27.3 g or 27.3 moles Nitrogen: (340 × 0.3%) + (60 × 0.2%) = 1.14 g or 0.0814 mole Sulfur: (340 × 0.15%) + (60 × 0.2%) = 0.63 g or 0.0197 mole Oxygen: (340 × 43.8%) + (60 × 4.8%) = 151.8 g or 9.4875 moles Case 5: Mixture 80% - 20% Carbon: (320 × 44.4%) + (80 × 73.8%) = 201.12 g or 16.76 moles Hydrogen: (320 × 6%) + (80 × 11.5%) = 28.40 g or 28.40 moles Nitrogen: (320 × 0.3%) + (80 × 0.2%) = 1.12 g or 0.08 mole Sulfur: (320 × 0.15%) + (80 × 0.2%) = 0.64 g or 0.02 mole;
Oxygen: (320 × 43.8%) + (80 × 4.8%) = 144.0 g or 9.00 moles Case 6: Mixture 75% - 25% Carbon: (300 × 44.4%) + (100 × 73.8%) = 207.00 g or 17.25 moles Hydrogen: (300 × 6%) + (100 × 11.5%) = 29.50 g or 29.50 moles Nitrogen: (300 × 0.3%) + (100 × 0.2%) = 1.10 g or 0.0785 mole;
Sulfur: (300 × 0.15%) + (100 × 0.2%) = 0.65 g or 0.0203 mole Oxygen: (300 × 43.8%) + (100 × 4.8%) = 136.2 g or 8.5125 moles Case 7: Mixture 70% - 30% Carbon: (280 × 44.4%) + (120 × 73.8%) = 212.88 g or 17.74 moles Hydrogen: (280 × 6%) + (120 × 11.5%) = 30.6 g or 30.6 moles Nitrogen: (280 × 0.3%) + (120 × 0.2%) = 1.08 g or 0.0771 mole Sulfur: (280 × 0.15%) + (120 × 0.2%) = 0.66 g or 0.0206 mole Oxygen: (280 × 43.8%) + (120 × 4.8%) = 128.40 g or 8.02 moles Considering that, all the carbon becomes CO2, all the nitrogen becomes NO2, all the sulfur becomes SO2, all the hydrogen becomes H2O, according to the reactions:


The need oxygen to burn 400 grams of fuel is:
Case 1: Mixture 100% - 0%
[14.80 + (24.00/4) + 0.0857 + 0.0187] – (10.95/2) = 15.4294 moles of oxygen, either under normal conditions of temperature and pressure, a volume of:
15.4294 × 22.4 = 345.6185 NL of O2.
Case 2: Mixture 95% - 5%
[15.29 + (25.10/4) + 0.0842 + 0.0191] – (10.46/2) = 16.4383 moles of oxygen, either under normal conditions of temperature and pressure, a volume of:
16.4383 × 22.4 = 368.2179 NL of O2.
Case 3: Mixture 90% - 10%
[15.78 + (26.20/4) + 0.0829 + 0.0194] – (9.975/2) = 17.4448 moles of oxygen, either under normal conditions of temperature and pressure, a volume of:
17.4448 × 22.4 = 390.7635 NL of O2.
Case 4: Mixture 85% - 15%
[16.27 + (27.3/4) + 0.0814 + 0.0197] – (9.4785/2) = 18.4523 moles of oxygen, either under normal conditions of temperature and pressure, a volume of:
18.4523 × 22.4 = 413.3315 NL of O2.
Case 5: Mixture 80% - 20%
[16.76 + (28.40/4) + 0.08 + 0.02] – (9.00/2) = 19.4600 moles of oxygen, either under normal conditions of temperature and pressure, a volume of:
19.4600 × 22.4 = 435.904 NL of O2.
Case 6: Mixture 75% - 25%
[17.25 + (29.50/4) + 0.0785 + 0.0203] – (8.5125/2) = 20.4675 moles of oxygen, either under normal conditions of temperature and pressure, a volume of:
20.4675 × 22.4 = 458.472 NL of O2.
Case 7: Mixture 70% - 30%
[17.74 + (30.6/4) + 0.0771 + 0.0206] – (8.02/2) = 21.4777 moles of oxygen, either under normal conditions of temperature and pressure, a volume of:
21.4777 × 22.4 = 481.1005 NL of O2.
The combustion times of differents mixtures are known and the combustion air contains 20.9% oxygen. If one considers that in each case, the mass loss rate is constant throughout the experiment, then the airflows average for stoichiometric combustion for each mixture are:
Case 1: Mixture 100% - 0%
(345.6185·10−3/0.209) × (3600/103) = 57.8 Nm3∙h–1
Case 2: Mixture 95% - 5%
(368.2179·10−3/0.209) × (3600/107) = 59.3 Nm3∙h-1
Case 3: Mixture 90% - 10%
(390.7635·10−3/0.209) × (3600/112) = 60.1 Nm3∙h–1
Case 4: Mixture 85% - 15%
(413.3315·10−3/0.209) × (3600/116) = 61.4 Nm3∙h–1
Case 5: Mixture 80% - 20%
(435.904·10−3/0.209) × (3600/120) = 62.6 Nm3∙h–1
Case 6: Mixture 75% - 25%
(458.472·10−3/0.209) × (3600/125) = 63.2 Nm3∙h–1
Case 7: Mixture 70% - 30%
(481.1005·10−3/0.209) × (3600/129) = 64.2 Nm3∙h–1
5. Operating Conditions
To achieve our objectives of simulations, we chose to work in three combustion regimes (defined by the value of excess air), that is to say for the excess of primary air, below, equal and above 1. We define the excess air as the ratio of actually injected airflow and theoretical stoichiometric airflow. These conditions are summarized in the Table 4 below.
Q1 = Primary airflow Nm3∙h–1, Q2 = Secondary airflow Nm3∙h–1;
e1 = Excess of primary air: e1 = Q1/Stoichiometric airflow;
e2 = Excess secondary air: e2 = Q2/Stoichiometric airflow.
6. Results
6.1. Residual Oxygen (O2)
The evolution of residual oxygen according to the proportion of plastic, for each primary and secondary airflows, is presented in Figures 3 to 7. The curves are plotted for different values of primary air flow.
When the rate of plastic in the mixture increases, the rates of residual oxygen decreases, which means that the increasing of the plastic rate leads to an increasing of oxygen consumption. Several reasons may explain this phenomenon:
- Experimental work of [14] on the combustion of polyethylene (PE) in tubular furnace, showed that when the plastic mass increases, oxygen consumption is important. That also justifies the changing of levels of NO and CO2 that we present later.
- The higher the plastic is stronger and there is presence of carbon and hydrogen in the fuel mixture (see elemental analysis). This provides, during combustion, a larger amount of hydrocarbons that are oxidized by consuming more oxygen.
- More content of plastic in the mixture increases and more the oxygen supplied directly by the mixture decreases (see analysis).
6.2. Carbon Dioxide (CO2)
The Evolution of emissions of carbon dioxide (CO2) according to the proportion of plastic in the mixture is presented in Figures 8 to 12 for different values of the primary air flow. Each Figure corresponds to a different secondary air flow.
Table 4. Operating conditions for the numerical simulation during combustion in the prototype of kiln.
Figure 3. O2 according to the proportion of plastic with Q2 = 20 Nm3∙h–1.

Figure 4. O2 according to the proportion of plastic with Q2 = 30 Nm3∙h–1.
Figure 5. O2 according to the proportion of plastic with Q2 = 40 Nm3∙h–1.

Figure 6. O2 according to the proportion of plastic with Q2 = 50 Nm3∙h–1.
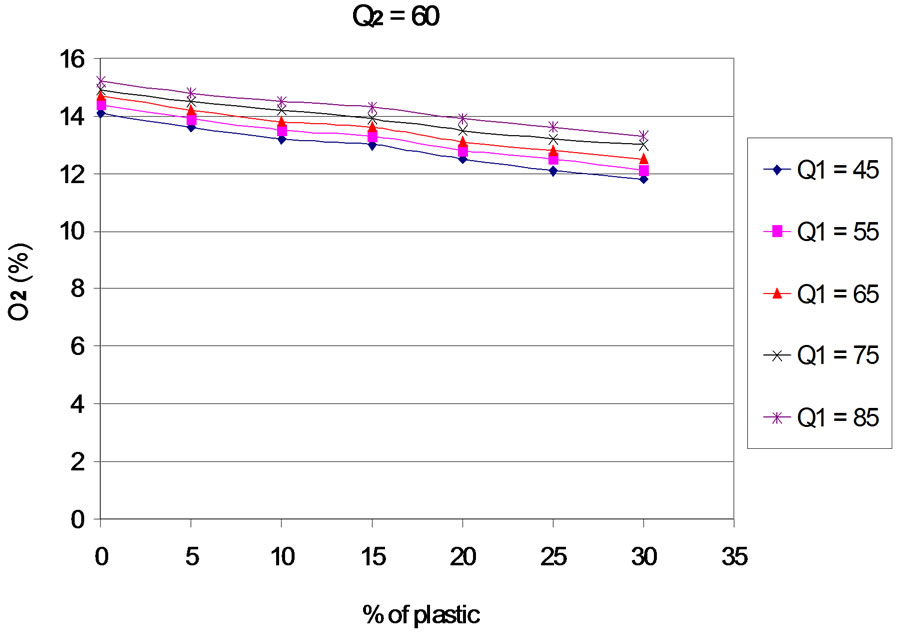
Figure 7. O2 according to the proportion of plastic with Q2 = 60 Nm3∙h–1.
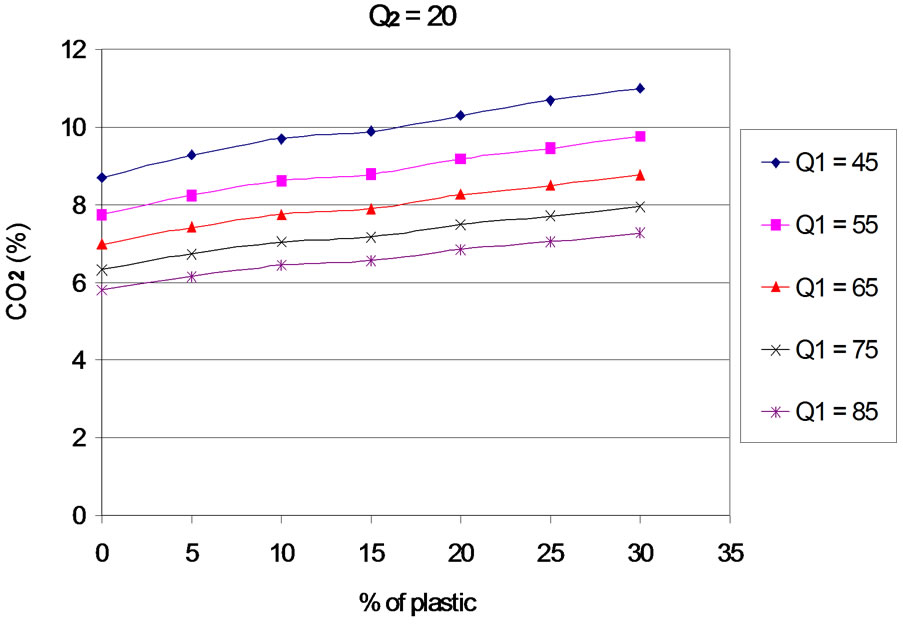
Figure 8. CO2 according to the proportion of plastic with Q2 = 20 Nm3∙h–1.

Figure 9. CO2 according to the proportion of plastic with Q2 = 30 Nm3∙h–1.
The evolution of the curves shows that, when plastic rate increases, CO2 emissions are increasing, and the efficiency of carbon conversion into CO2. This result is logical, since an increase in the content of plastic generates an increase in the concentration of carbon in the fuel mixture. For the rates of plastic between 0% - 20%, this result can also be explained by the increase of combustion temperature with the percentage of plastic in the fuel mixture. Indeed, [15] and [16], show that CO2 emissions are an increasing function of temperature. In addition, the work of [17] indicates that the rate of formation of CO2 increases considerably with temperature from 830˚C. Finally, the increasing of rate of plastic generates an increase of the concentration of hydrogen that is favors an increase in the rate of oxidation of CO into CO2 [18]. For the contents of plastics in the mixture between 20% to 30%, the combustion temperature is constant. The increasing of CO2 levels is partly due to the increase of hydrogen concentration when the mass of plastic in the mixture increases and partly to the residual oxygen content. Indeed, oxygen consumption increases linearly with the proportion of plastic in the mixture.
6.3. Nitrogen Monoxide (NO)
The Figures 13 to 17 present the trends of emissions of nitrogen monoxide based on the proportion of plastic in the fuel mixture. The curves are plotted for different values of primary air flow.
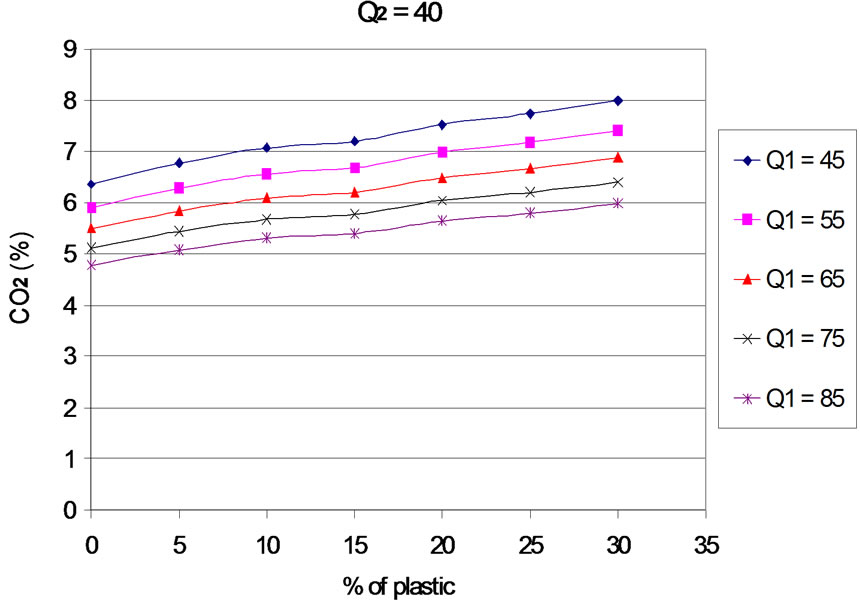
Figure 10. CO2 according to the proportion of plastic with Q2 = 40 Nm3∙h–1.
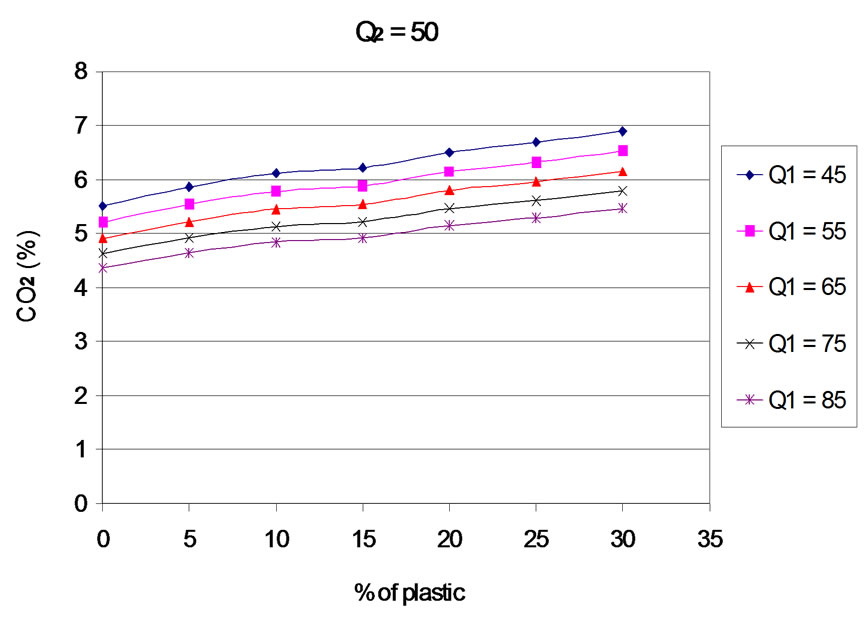
Figure 11. CO2 according to the proportion of plastic with Q2 = 50 Nm3∙h–1.

Figure 12. CO2 according to the proportion of plastic with Q2 = 60 Nm3∙h–1.
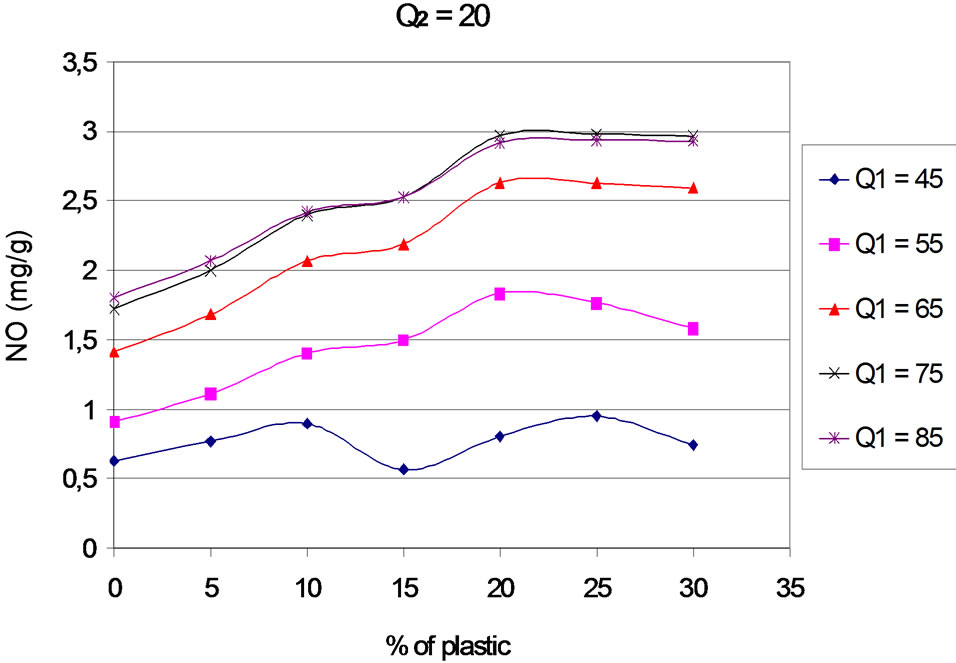
Figure 13. NO according to the proportion of plastic with Q2 = 20 Nm3∙h–1.

Figure 14. NO according to the proportion of plastic with Q2 = 30 Nm3∙h–1.
We note that for proportions of plastic from 0% to 20%, the rate of nitrogen monoxide increases regardless of primary air flow. However, for 15% of plastic in the

Figure 15. NO according to the proportion of plastic with Q2 = 40 Nm3∙h–1.

Figure 16. NO according to the proportion of plastic with Q2 = 50 Nm3∙h–1.

Figure 17. NO according to the proportion of plastic with Q2 = 60 Nm3∙h–1.
fuel mixture, there is a change in slope whatever the primary and secondary flows. Indeed, an increase in the proportion of plastic generates an increase of combustion temperature. [19], during his work on the performance of NO formation shows that the efficiency of formation of NO is an increasing function of the local temperature of combustion. These results also confirm those of [7] and [9]: the combustion temperature has an influence on NO production that one is in default of air, stoichiometry or excess of air. From 20% of plastic in the fuel mixture and for each secondary air flow, the trends differ between combustion regimes:
- For primary rate Q1 = 45 Nm3∙h–1, NO increases with the percentage of plastic. We are in default of air, oxygen is not sufficient to promote the reduction of NO into N2.
- When Q1 = 55 Nm3∙h–1, the NO concentration decreases with increasing the percentage of plastic. The combustion temperature in the simulation is fixe for 20% of plastic, the formula of efficiency of NO formation, [19] does not justify this decreasing of curves for a flow of 55 Nm3∙h–1. It appears that for this combustion regime, close to stoichiometry, a higher content of plastic favors the establishment of the reactions of NO reduction.
- For primary air flow 65, 75 and 85 Nm3∙h–1, NO production tends to remain stable regardless of the proportion of plastic in the mixture. NO emissions are then controlled by temperature. The combustion temperature is fixe, and NO emissions remain stable. This stability can also be explained by the balance that develops between temperature, oxygen and the fraction of nitrogenous species in the mixture.
7. Conclusions
The model “REACTOR”, modified to take into account the characteristics of our study was used to assist in the numerical study of combustion in homogeneous phase, of a mixture of “millet stalks and plastic bags”, in a prototype of potter kiln. For this, we have, during the study determined the effect of the proportion of plastic in the fuel mixture on the emissions of gaseous species that are residual oxygen (O2), carbon dioxide (CO2) and nitrogen monoxide (NO). We can conclude that:
- The increasing the rate of plastic in the mixture produces a decrease of the residual oxygen content, due to a higher oxygen consumption, whatever the flow of air;
- CO2 emissions are an increasing function of rate of plastic (polyethylene) in the fuel mixture.
NO emissions are increasing functions of the mass of plastic for proportions less than or equal to 20%, and are essentially controlled by the temperature of the reactional medium.
REFERENCES
- A. Ouedraogo, F. P. Kieno, T. Daho, J. D. Bathiebo and R. Ouedraogo, “Bilan Thermique Quasi Statique D’un Four Artisanal En Argile,” Article Publié au Journal de la Société Ouest-Africaine de Chimie (SOACHIM), Vol. 24, 2007, pp. 65-72.
- C. Feller and F. Ganry, “Décomposition et Humification des Résidus Végétaux Dans un Agro-Système Tropical,” Agronomie Tropicale, Vol. 3, 1982, pp. 25-36.
- A. Y. Levendis and T. Ponagiotou, “Experimental Techniques to Study the Combustion Characteristics of Two Commonly Found in Municipal Wastes,” Municipal Waste Combustion, 15-19 April 1991, pp. 73-86.
- F. E. Mark and R. Martin, “Energy Recovery—Recovery of Plastics in Municipal Solid Wastes,” Association of Plastics Manufactures in Europe, 1995.
- J. F. Lebourg, V. Maupin and D. Rousseau, “La Combustion des Matières Plastiques,” Ecole Supérieure d’Ingénieurs de Poitiers, T.E.N. 3, 1993-1994.
- R. J. Kee, F. M. Rupley and J. A. Miller, “Chemkin-II: A Fortran Chemical Kinetics Package for the Analysis of Gas-Phase Chemical Kinetics,” Sandia Report, No. 89- 8009B, 1989.
- T. Rogaume, M. Auzanneau, F. Jabouille, J. C. Goudeau and J. L. TORERO, “Computational Model to Investigate the Effect of Different Airflows on the Formation of Pollutants during Waste Incineration,” Combustion Science and Technology, Vol. 175, 2003, pp. 1501-1533. doi:10.1080/00102200302355
- T. Rogaume, F. Richard, F. Jabouille and J. L. Torero, “Computational Model to Investigate the Mechanisms of NOx Formation during Waste Incineration,” Combustion Science and Technology, Vol. 176, No. 5-6, 2004, pp. 925-943. doi:10.1080/00102200490428549
- F. Richard, T. Rogaume, A. T. Barhe, S. K. Ouiminga, J. L. Torero and P. Rousseaux, “Influence of the Regime of Combustion on Chemical Pathways of NOx Formation during Incineration of Cellulosic and Plastic Materials,” Mediteranean Symposium on Combustion, Monastir, 9-13 September 2007.
- T. Rogaume, “Caractérisation Expérimentale et Modélisation de L’émission de Polluants Lors de L’incinération des Déchets Ménagers,” Thèse de Doctorat de l’université de Poitiers, Poitiers, 2001.
- P. Glarborg, J. A. Miller and R. J. Kee, “Kinetic Modelling and Sensitive Analysis of Nitrogen Oxide Formation in Well Stirred Reactors,” Combustion and Flame, Vol. 65, 1986, pp. 177-202. doi:10.1016/0010-2180(86)90018-0
- P. Dagaut, J. Luche and M. Cathonnet, “The Kinetics of C1 to C4 Hydrocarbons-NO Interactions in Relation with Reburning,” 28th International Symposium on Combustion, The Combustion Institute, Pittsburgh, 2000, pp. 2459-2466.
- T. Daho, “Bilan Thermique Quasi-Statique et Optimisation du Rendement d’un Four Artisanal,” Diplôme d’Etudes Approfondies de l’Université de Ouagadougou, Ouagadougou, 2004.
- S. K. Ouiminga, T. Rogaume, G. B. Segda, M. Sougoti and J. Koulidiati, “Combustion de Granulés de Poly- éthylène Pur et de Sachets Plastiques à Base de Poly- éthylène: Effet de la Masse et de la Température sur les Emissions de NO, CO2 et O2,” Journal de la Société Ouest-Africaine de Chimie (SOACHIM), Vol. 28, 2009, pp. 67-77.
- R. A. Yetter, F. L. Dryer and H. Rabitz, “Complications of One Step Kinetics for Moist CO Oxidation,” 21st International Symposium on Combustion, The Combustion Institute, Pittsburgh, 1986, pp. 749-760.
- I. Glassman, “Combustion,” 3rd Edition, Academic Press, Waltham, 1996.
- F. L. Dryer, D. W. Naegeli and I. Glassman, “Temperature Dependence of the Reaction CO + OH®CO2 + H,” Combustion and Flame, Vol. 17, 1971, pp. 270-272. doi:10.1016/S0010-2180(71)80173-6
- R. S. Brokaw, “Ignition Kinetics of the Carbon Monoxide-Oxygen Reaction,” 11th International Symposium on Combustion, The Combustion Institute, Pittsburgh, 1967, p. 1063.
- G. De Soete, “Mécanismes de Formation et de Destruction des Oxydes D’Azote Dans la Combustion,” Revue Générale de Thermique, Vol. 330-331, 1989, pp. 353-373.
NOTES
*Corresponding author.