 American Journal of Anal yt ical Chemistry, 2011, 2, 971-978 doi:10.4236/ajac.2011.28113 Published Online December 2011 (http://www.SciRP.org/journal/ajac) Copyright © 2011 SciRes. AJAC Method Validation for SPE Applied to Determination of PAH in Petroliferous Industry Effluent Water José Ricardo Lima Bispo, Sandro Navickiene, Haroldo Silveira Dórea* Laboratório de Análise de Compos tos Orgânicos Poluentes, Departamento de Química, Universidade Federal de Sergipe, São Cristóvão, Brazil E-mail: hdorea@ufs.br Received May 9, 2011; revised June 26, 2011; accepted July 9, 2011 Abstract The presence of polycyclic aromatic hydrocarbons (PAH) in produced water is of environmental concern due to their toxic properties. PAH analysis in complex samples requires pre-treatment to enrich the fraction con- taining analytes, and eliminate matrix interferences. The objective of this work was to develop and validate an analytical methodology for determination of PAH in produced water, using solid phase extraction (SPE) and analysis by gas chromatography with flame ionization detection (GC-FID). Average recoveries of PAH from produced water enriched at two concentration levels varied from 30.9% for naphthalene to 119.1% for chrysene (RSD between 3.8% and 22.2%). The linear range was between 0.5 and 50.0 µg·mL–1, with regres- sion coefficients better than 0.998. Detection limits were between 0.01 and 0.04 µg·L–1, and quantitation lim- its were between 0.05 and 0.16 µg·L–1. The validated method was applied to samples of produced water treated for disposal, in which concentrations varied from 3.5 µg·L–1 for phenanthrene to 44.3 µg·L–1 for naphthalene ( = 177.7 μg·L–1). The method was also applied to seawater samples, in which 13 PAH compounds were detected ( PAH PAH = 60.27 μg·L–1), probably derived from pyrogenic sources. Keywords: Produced Water, Effluent, PAH, SPE 1. Introduction One of the most significant by-products of petroleum extraction is produced water, due to the large volumes that are discharged or reused, as well as its chemical composition, which can vary greatly depending on the characteristics of the underlying geology. It is a highly complex aqueous matrix, containing organic and inor- ganic, soluble and insoluble, compounds derived from petroleum fractions, with high levels of salinity (up to 250 g·L–1). Hydrocarbons predominate, with the major groupings including alkanes, alkenes, alkynes, complex hydrocarbons containing oxygen, nitrogen and sulphur, volatile monoaromatic compounds, and polycyclic aro- matic hydrocarbons (PAH) [1-4]. Although around a hundred PAH are found in the en- vironment, only 16, possessing 2 to 6 aromatic rings, are considered as priority compounds due to their toxicity, mutagenicity or carcinogenicity [5]. The solubility of these compounds in water varies greatly, and reduces as molecular mass increases [6-8]. Liquid-liquid extraction (LLE) is the technique most frequently used for analysis of PAH in complex matrices including petroliferous wastewaters [3,5]. Other studies of wastewaters have used Solid Phase Microextraction (SPME)9 or Solid Phase Extraction (SPE) [10-12]. Direct mode SPME is not feasible, due to attack on comer- cially used fibres by compounds present in produced water. Headspace mode SPME cannot efficiently extract the 5 to 6 ring PAH. In contrast to liquid-liquid extrac- tion, SPE does not require large volumes of organic sol- vents, hence generating little laboratory waste, and analysis time can be greatly reduced, particularly when several cartridges are used simultaneously. The wide variety of available adsorbents means that extraction conditions can be adapted to achieve desired separation and preconcentration goals. While SPE is a technique that seems to offer advan- tages compared to liquid-liquid extraction, in routine analysis laboratories new techniques using this procedure need to be validated so that PAH determinations in com- plex water samples can be undertaken with confidence.  J. R. L. BISPO ET AL. 972 The objective of this work was to validate an analytic- cal method for determination of 16 PAH, including 15 of the 16 compounds designated as priority pollutants by the United States Environmental Protection Agency, in produced water, using solid phase extraction and analysis by gas chromatography with flame ionization detection. 2.Experimental 2.1. Standards, Reagents and Solvents Methanol, ethyl acetate, toluene, dichloromethane, ace- tone and n-hexane were nanograde (Merck, Darmstadt, Germany), and dichlorodimethylsilane was 99% (ACROS Organics, New Jersey, USA). Analytical grade anhy- drous sodium sulfate was supplied by Merck. “Prepsep” C-18 (500 mg, 6 mL) cartridges were from Fisher Scien- tific (Pittsburgh, PA, USA). Certified 2000 g·mL–1 standards of the individual PAH in dichloromethane/benzene (1:1) were purchased from Ultra Scientific. The 16 compounds investigated were naphthalene (Nap), acenaphthylene (Acpt), ace- naphthene (Ace), fluorene (Flu), phenanthrene (Phe), anthracene (Ant), fluoranthene (Flt), pyrene (Py), benz[a] anthracene (BaA), chrysene (Chry), benzo[b]fluoran- thene (BbF), benzo[k]fluoranthene (BkF), benzo[a] pyrene (BaP), dibenzo[b,c]fluoranthene (DBF), dibenz [a,h]anthracene (DBA), and benzo[g,h,i]perylene (BPe). PAH stock solutions were prepared in dichloromethane at 200 g·mL–1 and stored at –10˚C. Working standard solutions were prepared by diluting the stock solutions in dichloromethane as required. 2.2. Sampling Produced water samples were collected from the lower part of the treatment station tank of a petroleum produc- tion company located in the city of Carmópolis, Sergipe, Brazil. The water had previously been processed for re- moval of the bulk of the oil content. For subsequent re- cycing and reuse for injection into wells during petro- leum extraction [13], or discharge into the sea, the pro- duced water passes through further processes involving filtration and chemical treatment. The samples were col- lected in amber glass flasks, fitted with closures lined with aluminium foil, and preserved by storing at 4˚C prior to extraction. 2.3. Sample Preparation 5 mL aliquots of methanol were added to 100 mL sub- samples of unfiltered produced water. The cartridges containing the C-18 solid phase were each conditioned using 20 mL dichloromethane, 10 mL acetone, 20 mL methanol, and finally 20 mL ultrapure water, and then dried for 3 minutes. The water sample was adjusted to pH 7 with sulfuric acid (1:1), and then passed through the C-18 cartridge. The PAH were eluted with 5 mL acetone and 30 mL hexane. The organic extract was concentrated in a rotary evaporator (50˚C, 60 rpm), transferred to a glass column filled with 5 g anhydrous sodium sulfate on silanized glass wool, and PAH were eluted from the column using 20 mL dichloromethane. After further concentration using the rotary evaporator, the extract was transferred to a 1 mL volumetric flask, and reduced under a flow of nitrogen before analysis. 2.4. Chromatographic Conditions Quantification of PAH was performed using a Shimadzu (Kyoto, Japan) Model 17A gas chromatograph equipped with a flame ionization detector and split/splitless inject- tor. The column was a Hewlett Packard (USA) fused- silica HP-5 (30 m × 0.25 mm × 0.25 µm film thickness), and 99.995% purity helium was used as carrier gas. Temperatures of the injector (splitless mode, 2 min) and detector were 250˚C and 300˚C, respectively. The col- umn temperature was programmed as follows: 40˚C for 1 min, increasing to 160˚C at 25˚C min–1 and to 270˚C at 5˚C min–1, with a hold for 11 min. The flow rate through the column was 1.32 mL·min-1, and the injection volume was 1 µL. 3. Results and Discussion Several parameters were examined at the sample prepa- ration stage in order to optimize the performance of the SPE technique. Method validation was undertaken after formalization of the PAH extraction procedure, with re- coveries determined using enriched produced water blank samples. 3.1. Filtration of the Matrix Possible losses by sorption onto particulate matter pre- sent in the produced water, due to low compound solu- bility, were examined by filtration of three samples under vacuum through 0.45 μm cellulose acetate filters, and comparison with three unfiltered samples. PAH concen- trations were lower for the filtered samples, and fluorene, phenanthrene, chrysene, benzo[k]fluoranthene, dibenzo [b,c]fluoranthene, dibenz[a,h]anthracene and benzo[g,h,i] perylene were not detected. With the exception of fluo- rene and phenanthrene, the PAH investigated possess between four and six aromatic rings. Hence, these com- pounds are strongly adsorbed onto matrix particulates. Copyright © 2011 SciRes. AJAC 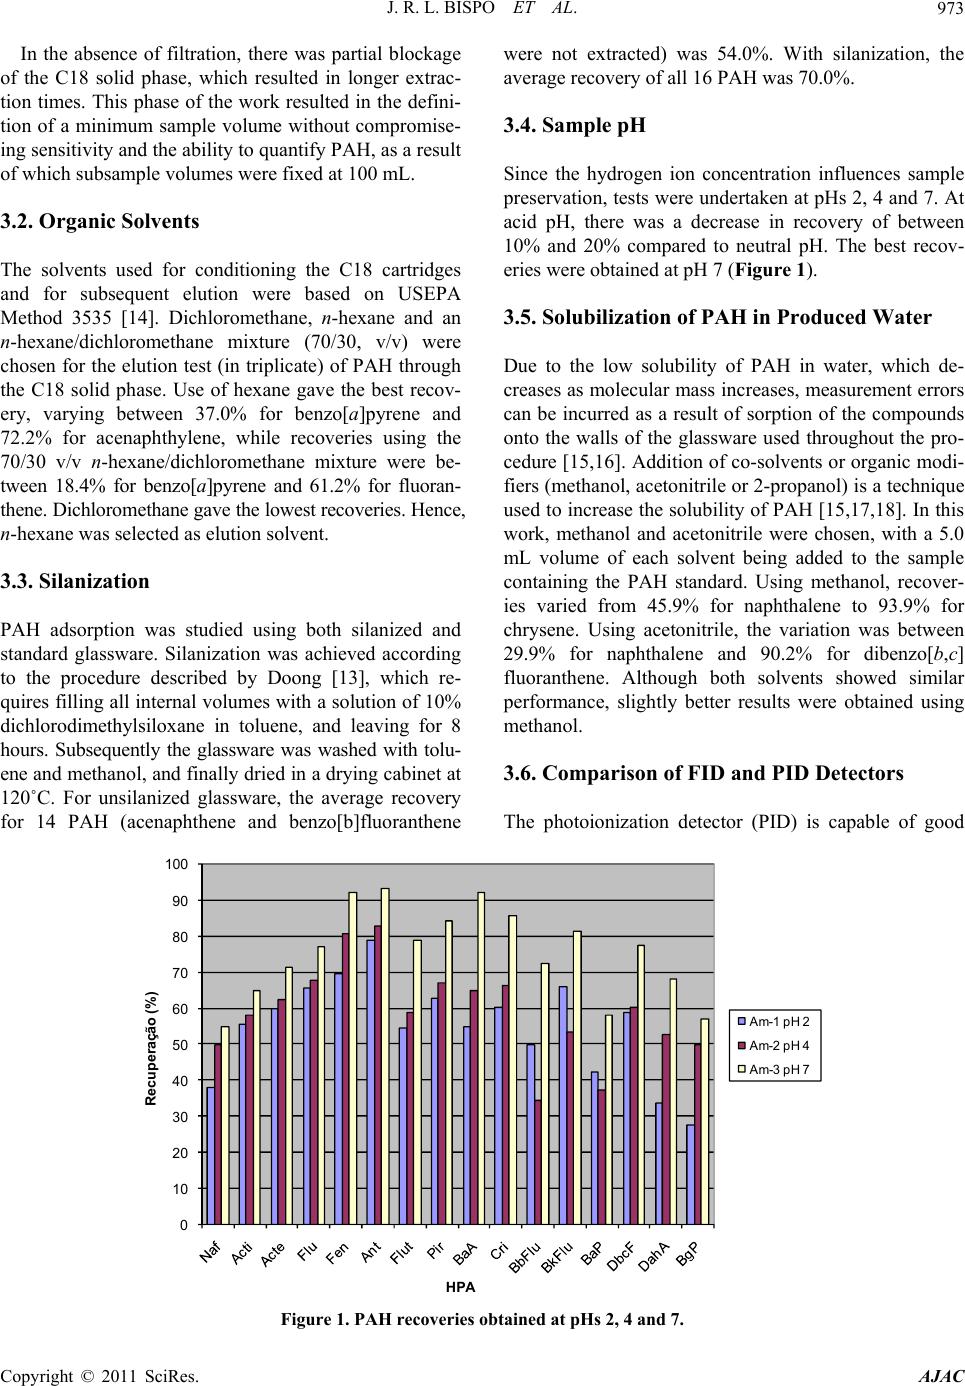 J. R. L. BISPO ET AL. Copyright © 2011 SciRes. AJAC 973 In the absence of filtration, there was partial blockage of the C18 solid phase, which resulted in longer extrac- tion times. This phase of the work resulted in the defini- tion of a minimum sample volume without compromise- ing sensitivity and the ability to quantify PAH, as a result of which subsample volumes were fixed at 100 mL. 3.2. Organic Solvents The solvents used for conditioning the C18 cartridges and for subsequent elution were based on USEPA Method 3535 [14]. Dichloromethane, n-hexane and an n-hexane/dichloromethane mixture (70/30, v/v) were chosen for the elution test (in triplicate) of PAH through the C18 solid phase. Use of hexane gave the best recov- ery, varying between 37.0% for benzo[a]pyrene and 72.2% for acenaphthylene, while recoveries using the 70/30 v/v n-hexane/dichloromethane mixture were be- tween 18.4% for benzo[a]pyrene and 61.2% for fluoran- thene. Dichloromethane gave the lowest recoveries. Hence, n-hexane was selected as elution solvent. 3.3. Silanization PAH adsorption was studied using both silanized and standard glassware. Silanization was achieved according to the procedure described by Doong [13], which re- quires filling all internal volumes with a solution of 10% dichlorodimethylsiloxane in toluene, and leaving for 8 hours. Subsequently the glassware was washed with tolu- ene and methanol, and finally dried in a drying cabinet at 120˚C. For unsilanized glassware, the average recovery for 14 PAH (acenaphthene and benzo[b]fluoranthene were not extracted) was 54.0%. With silanization, the average recovery of all 16 PAH was 70.0%. 3.4. Sample pH Since the hydrogen ion concentration influences sample preservation, tests were undertaken at pHs 2, 4 and 7. At acid pH, there was a decrease in recovery of between 10% and 20% compared to neutral pH. The best recov- eries were obtained at pH 7 (Figure 1). 3.5. Solubilization of PAH in Produced Water Due to the low solubility of PAH in water, which de- creases as molecular mass increases, measurement errors can be incurred as a result of sorption of the compounds onto the walls of the glassware used throughout the pro- cedure [15,16]. Addition of co-solvents or organic modi- fiers (methanol, acetonitrile or 2-propanol) is a technique used to increase the solubility of PAH [15,17,18]. In this work, methanol and acetonitrile were chosen, with a 5.0 mL volume of each solvent being added to the sample containing the PAH standard. Using methanol, recover- ies varied from 45.9% for naphthalene to 93.9% for chrysene. Using acetonitrile, the variation was between 29.9% for naphthalene and 90.2% for dibenzo[b,c] fluoranthene. Although both solvents showed similar performance, slightly better results were obtained using methanol. 3.6. Comparison of FID and PID Detectors The photoionization detector (PID) is capable of good 0 10 20 30 40 50 60 70 80 90 100 Recuper ação (%) HPA Am - 1 pH 2 Am - 2 pH 4 Am - 3 pH 7 Figure 1. PAH recoveries obtained at pHs 2, 4 and 7.  J. R. L. BISPO ET AL. Copyright © 2011 SciRes. AJAC 974 sensitivity for detection of the volatile monoaromatic hydrocarbons benzene, toluene, ethylbenzene, and the xylene isomers [2]. The operating conditions of this de- tector have been reported previously [1,2]. A test was undertaken to measure the performance of the PID for PAH. At a concentration of 0.4 g·mL–1, only the first seven compounds eluting from the column were detected, while all 16 PAH were detected at a concentration of 5 g·mL–1. 3.7. Validation of the SPE Method Validation was based on parameters defined in standard protocols describing chromatographic methods [15-17]. 3.8. Linearity A five-point calibration curve was constructed for each compound over the concentration range of interest (0.5 - 50 μg·mL–1), using external standards. Calibration curve regression coefficients (R2) were higher than 0.998 in all cases (Table 1). 3.9. Recovery Recoveries were measured at two enrichment levels, 10 and 100 μg·L–1 (Table 2). At the first level (10 μg·L–1), recoveries varied from 55.0% for naphthalene to 93.1% for anthracene. At the second level (100 μg·L–1) recover- ies were from 30.9% for naphthalene to 119.1% for chrysene. At these levels, the efficiency of the SPE method was satisfactory, with recoveries lying close to the range normally considered acceptable, between 70% and 130% [18] (with the exception of naphthalene). At the first level, recoveries of acenaphthylene, benzo[a] pyrene and benzo[g,h,i]perylene were below 70%. Ta- ble 3 lists previously reported PAH recoveries, with some values below 30%. 3.10. Precision Repeatability was measured using relative standard de- viations (RSD) at two concentration levels (10 and 100 μg·L–1), and ranged from 3.8% to 22.2% (Table 2). All RSDs were below 30%, the value considered acceptable. [18] Confidence limits at 95% probability were also ob- tained for each PAH. 3.11. Limits of Detection (LOD) and Quantification (LOQ) These were determined using the standard deviation (n = Table 1. Analytical curves, and limits of detection and quantification, for the PAH investigated. PAH Regression equation R2 LOD (µg·L–1) LOQ (µg·L–1) Naphthalene y = 2362.5x – 204.2 0.99980.02 0.08 Acenaphthylene y = 2315.3x – 216.9 0.99960.02 0.07 Acenaphthene y = 2391.1x – 213.7 0.99960.01 0.05 Fluorene y = 2288.0x – 269.1 0.99950.03 0.11 Phenanthrene y = 2471.6x – 322.2 0.99920.02 0.08 Anthracene y = 2327.7x – 341.3 0.99870.03 0.11 Fluoranthene y = 2449.8x – 207.6 0.99880.03 0.12 Pyrene y = 2379.2x – 331.0 0.99860.03 0.13 Benz[a]anthracene y = 2250.8x – 293.2 0.99940.02 0.08 Chrysene y = 2468.1x – 356.9 0.99800.03 0.13 Benzo[b]fluoranthene y = 2281.6x – 268.1 0.99930.02 0.08 Benzo[k]fluoranthene y = 2312.9x – 228.2 0.99870.03 0.13 Benzo[a]pyrene y = 2067.8x – 134.3 0.99980.03 0.12 Dibenzo[b,c] fluoranthene y = 1336.3x – 269.3 1.00000.04 0.16 Dibenz[a,h]anthracene y = 1591.5x – 321.5 0.99990.04 0.15 Benzo[g,h,i]perylene y = 1579.0x – 277.4 0.99950.03 0.11 LOD: Limit of detection; LOQ: Limit of quantification. 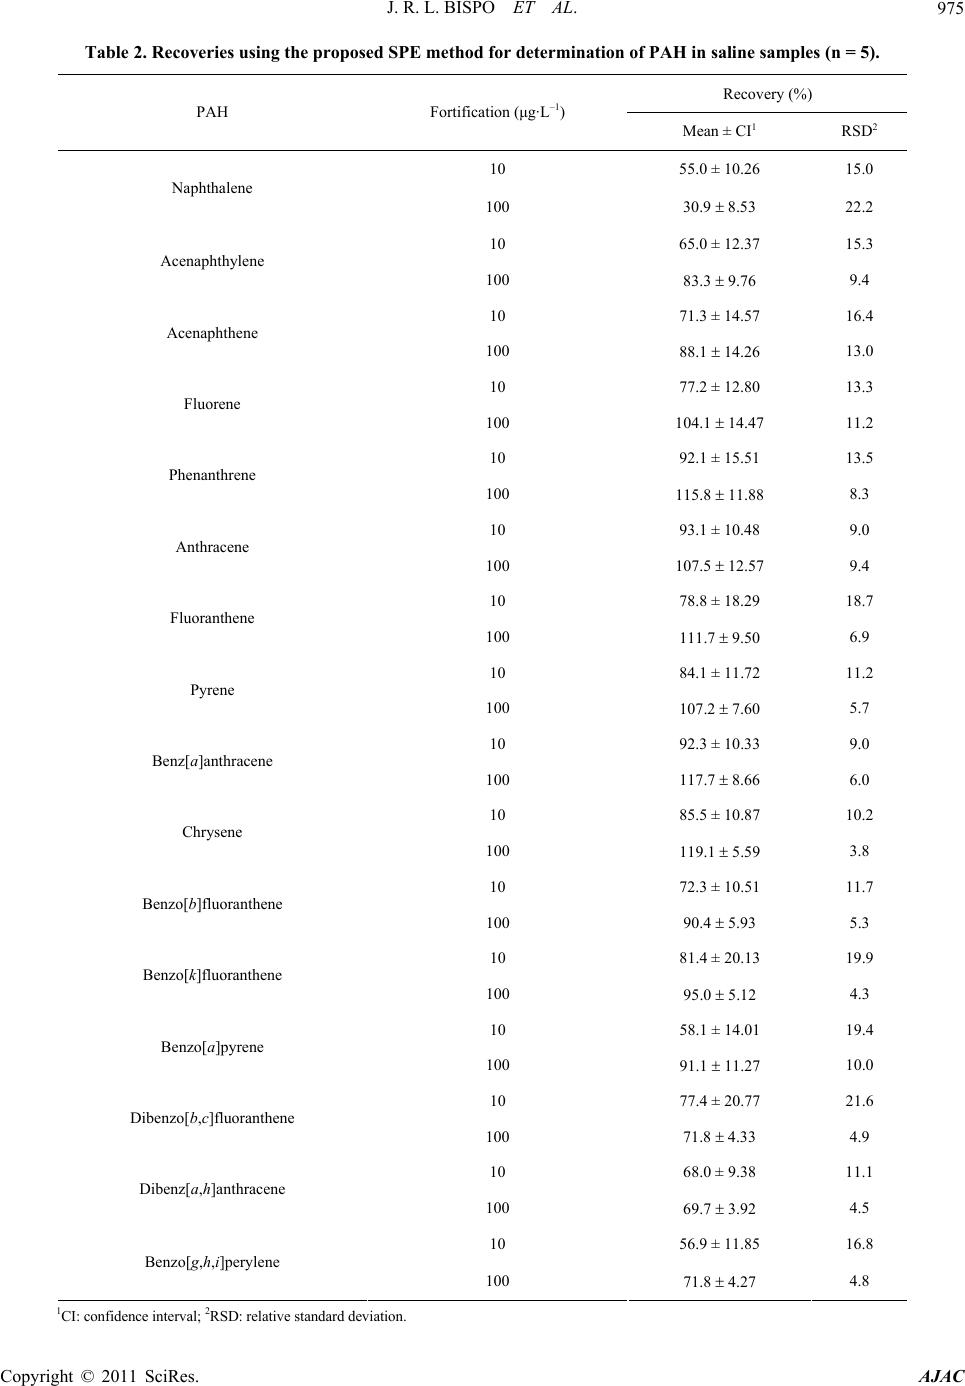 J. R. L. BISPO ET AL.975 Table 2. Recoveries using the proposed SPE method for determination of PAH in saline samples (n = 5). Recovery (%) PAH Fortification (μg·L–1) Mean ± CI1 RSD2 10 55.0 ± 10.26 15.0 Naphthalene 100 30.9 8.53 22.2 10 65.0 ± 12.37 15.3 Acenaphthylene 100 83.3 9.76 9.4 10 71.3 ± 14.57 16.4 Acenaphthene 100 88.1 14.26 13.0 10 77.2 ± 12.80 13.3 Fluorene 100 104.1 14.47 11.2 10 92.1 ± 15.51 13.5 Phenanthrene 100 115.8 11.88 8.3 10 93.1 ± 10.48 9.0 Anthracene 100 107.5 12.57 9.4 10 78.8 ± 18.29 18.7 Fluoranthene 100 111.7 9.50 6.9 10 84.1 ± 11.72 11.2 Pyrene 100 107.2 7.60 5.7 10 92.3 ± 10.33 9.0 Benz[a]anthracene 100 117.7 8.66 6.0 10 85.5 ± 10.87 10.2 Chrysene 100 119.1 5.59 3.8 10 72.3 ± 10.51 11.7 Benzo[b]fluoranthene 100 90.4 5.93 5.3 10 81.4 ± 20.13 19.9 Benzo[k]fluoranthene 100 95.0 5.12 4.3 10 58.1 ± 14.01 19.4 Benzo[a]pyrene 100 91.1 11.27 10.0 10 77.4 ± 20.77 21.6 Dibenzo[b,c]fluoranthene 100 71.8 4.33 4.9 10 68.0 ± 9.38 11.1 Dibenz[a,h]anthracene 100 69.7 3.92 4.5 10 56.9 ± 11.85 16.8 Benzo[g,h,i]perylene 100 71.8 4.27 4.8 1CI: confidence interval; 2RSD: relative standard deviation. Copyright © 2011 SciRes. AJAC  J. R. L. BISPO ET AL. Copyright © 2011 SciRes. AJAC 976 Table 3. Previously reported PAH recoveries for aqueous matrices. Recovery (%) PAH (SPE)1 Subsoil water (SPE)2 Milli-Q water (SPE)3 Sewage (LLE)4 Seawater (SPE)4 Seawater (LLE)5 Seawater (LLE)6 Seawater 1.Nap 35 99 nd nd x 2.Acpt 46 104 nd nd x 3.Ace 105 64 nd nd x 4.Flu 97 x 93 nd nd x x 5.Phe 102 72 10 52 x x 6.Ant 86 82 3 10 x x 7.Flt 113 81 13 34 x x 8.Py 112 90 13 32 x x 9.BaA 68 x 106 12 23 x 10.Chry 67 96 13 18 x x 11.BbF 86 x 91 14 25 x 12.BkF 73 x 87 13 18 x 13.BaP 61 x 77 7 10 x x 14.DBF 63 x 81 13 22 x 15.DBA 58 x 72 16 20 x 16.BPe 67 x 69 13 16 x Range 35 - 112 95 - 104 64 - 106 3 - 16 10 - 52 95 - 112 65 - 92 nd = not detected; x = PAH analysed; 1Martinez et al. (2004); 2Garcia-Falcón et al. (2004); 3Oleszezuk and Baran (2004); 4Filipkowska et al . (2005); 5Nemr and Abd-Allah (2003); 6Anyakora et al. (2005). 7) of the concentration at the lowest level of enrichment and in the sample blank (LOD = t95%.s) [19]. Detection limits varied between 0.01 and 0.04 µg·L–1 (Table 1). Limits of quantification were calculated as ten times the standard deviation (n = 7),and varied between 0.05 and 0.16 µg·L–1. 3.12. Comparison with Liquid-Liquid Extraction The proposed method employing SPE was applied to the determination of the 16 PAH in samples of produced water. Mean concentrations varied from 3.5 μg·L–1 for phenanthrene to 44.3 μg·L–1 for naphthalene, with a total combined PAH concentration of 177.7 μg·L–1 (Table 4). Previous work employing liquid-liquid extraction3 found the following PAH concentrations in produced water: naphthalene 26.68 μg·L–1; acenaphthylene 0.44 μg·L–1; acenaphthene 0.34 μg·L–1; fluorene 0.01 μg·L–1; phenan- threne 0.02 μg·L–1; anthracene 0.03 μg·L–1; fluoranthene 0.01 μg·L–1. The remaining PAH were not detected. Seawater samples collected near Aracaju, Sergipe State, were analyzed in order to confirm the wider appli- cability of the SPE method. The total PAH concentration was 60.27 μg·L–1 (Table 4), with the ratios between low molecular weight and high molecular weight compounds, phenanthrene/anthracene (<10) and fluoranthene/pyrene (>1), indicating that the likely source was pyrogenic (combustion). Furthermore, in pyrogenic material there is a predominance of 4 to 6 ring compounds (∑PAH = 44.0 μg·L–1) relative to 2 to 3 ring compounds (∑PAH = 16.2 μg·L–1) [20,21]. 4. Conclusions An analytical method for determination of the 16 priority polycyclic aromatic compounds in produced water using SPE and GC-FID analysis has been validated. The pa- rameters linearity, recovery, precision, detection limits and quantification limits were all shown to be acceptable. The proposed method was compared with liquid-liquid extraction for real samples of produced water. Using SPE, 15 PAH were detected in these samples, at concentration levels ranging from 3.5 to 44.3 μg·L–1 ( = 177.7 μg·L–1). Only seven PAH were detected using liq- uid-liquid extraction. To confirm that the method is suit- ble for typical saline samples, it was used for analysis of PAH a  J. R. L. BISPO ET AL. Copyright © 2011 SciRes. AJAC 977 Table 4. PAH concentrations measured in produced water and seawater (n = 2). PAH Produced water (μg·L–1) Seawater (μg·L–1) Naphthalene 44.30 2.64 Acenaphthylene 16.55 2.46 Acenaphthene 10.10 2.53 Fluorene 10.03 2.52 Phenanthrene 3.53 2.39 Anthracene 8.54 3.70 Fluoranthene 3.94 4.44 Pyrene 3.80 2.91 Benz[a]anthracene 8.29 12.95 Chrysene 12.10 9.53 Benzo[b]fluoranthene 6.02 9.13 Benzo[k]fluoranthene 14.44 1.97 Benzo[a]pyrene 18.58 3.10 Dibenzo[b,c]fluoranthene 7.81 nd Dibenz[a,h]anthracene nd nd Benzo[g,h,i]perylene 9.67 nd ∑ PAH 177.71 60.27 nd: not detected. seawater, in which 13 PAH were detected ( = 60.27 μg·L–1). PAH 5. Acknowledgements The authors gratefully acknowledge the assistance of Petrobras/UNSEAL during collection of produced water samples. Financial support was provided by the Brazilian agency CNPq (Process No. 461522). 6. References [1] H. S. Dórea, J. R. L. Bispo, K. A. S. Aragão, B. B. Cunha, S. Navickiene, J. P. H. Alves, L. P. C. Romão and C. A. B. Garcia, “Analysis of BTEX, PAHs and Metals in the Oilfield Produced Water in the State of Sergipe, Brazil,” Microchemical Journal, Vol. 85, No. 2, 2007, pp. 234- 238. doi:10.1016/j.microc.2006.06.002 [2] A. Gaujac, E. S. Emídio, S. Navickiene, S. L. C. Ferreira and H. S. Dórea, “Multivariate Optimization of a Solid Phase Microextraction-Headspace Procedure for the Determination of Benzene, Toluene, Ethylbenzene and Xylenes in Effluent Samples from a Waste Treatment Plant,” Journal of Chromatography A, Vol. 1203, No. 1, 2008, pp. 99-104. doi:10.1016/j.chroma.2008.06.022 [3] E. Barbieri, C. A. B. Garcia, J. R. L. Bispo, K. A. S. Aragão, J. P. H. Alves and H. S. Dórea, “Utilização do Camarão Sete. Barbas (Xiphopenaeus Kroyeri) na Determinação da Toxicidade da Água de Produção de Petróleo Caracterizada no Estado de Sergipe,” O Mundo da Saúde, Vol. 28, No. 4, 2004, p. 421. [4] J. P. Ray and F. R. Engelhardt, “Produced Water: Tech- nological Environmental Issues and Solutions,” Plenum Press, New York, 1992. [5] A. H. Neilson, “PAHs and Related Compounds, Chemis- try,” Springer, New York, 1998. [6] A. Filipkowska, L. Lubecki and G. Kowalewska, “Poly- cyclic Aromatic Hydrocarbon Analysis in Different Ma- trices of the Marine Environment,” Analytica Chimica Acta, No. 547, No. 2, 2005, pp. 243-254. doi:10.1016/j.aca.2005.05.023 [7] R. M. Higashi, G. N. Cherr, C. A. Bergens and T. W.-M. Fan, “Produced Water: Technological Environmental Is- sues and Solutions,” Plenum Press, New York, 1992. [8] Y. F. Song, X. Jing, S. Fleischmann and B. M. Wilke, “Comparative Study of Extraction Methods for the De- termination of PAHs from Contaminated Soils and Sedi- ments,” Chemosphere, Vol. 48, No. 9. 2002, pp. 993- 1001. doi:10.1016/S0045-6535(02)00180-7 [9] C. F. S. Filho, E. S. Emídio and H. S. Dórea, “Solid- Phase Microextraction for Determination of Anilino- Pyrimidine, Dimethylcarbamate and Thiadiazine Pesticides  J. R. L. BISPO ET AL. 978 in Irrigation Project Surface Water,” The Journal of the Brazilian Chemical Society, Vol. 22, No. 7, 2011, p. 1371. doi:10.1590/S0103-50532011000700024 [10] T. F. Silva, D. A. Azevedo and F. R. Aquino Neto, “Distribution of Polycyclic Aromatic Hydrocarbons in Surface Sediments and Waters from Guanabara Bay, Rio de Janeiro,” The Journal of the Brazilian Chemical Soci- ety, Vol. 18, No. 3, 2007, p. 628. doi:10.1590/S0103-50532007000300021 [11] M. Toledo, F. M. Lanças and E. Carrilho, “Solid-Phase Extraction of Nitro-PAH from Aquatic Samples and Its Separation by Reverse-Phase Capillary Liquid Chromato- graphy,” Journal of the Brazilian Chemical Society, Vol. 18, No. 5, 2007, p. 1004. doi:10.1590/S0103-50532007000500019 [12] R. M. Cavalcante, N. S. M. Filho, R. B. Viana, I. R. N. Oliveira and R. F. Nascimento, “Utilization of Solid- Phase Extraction (SPE) for the Determination of Poly- cyclic Aromatic Hydrocarbons in Environmental Aque- ous Matrices,” Química Nova, Vol. 30, No. 3, 2007, p. 560. doi:10.1590/S0100-40422007000300010 [13] R. Dong, S. Chang and Y. Sun, “Solid-Phase Micro- ex- traction for Determining the Distribution of Sixteen US Environmental Protection Agency Polycyclic Aromatic Hydrocarbons in Water Samples,” Journal of Chroma- tography A, Vol. 879, No. 2, 2000, pp. 177-188. doi:10.1016/S0021-9673(00)00347-2 [14] USEPA 3535, “Solid-Phase Extraction (SPE). Environ- mental Protection Agency. Test Methods On-Line,” 2011. http://www.epa.gov [15] M. Thompson, S. L. R. Ellison and R. Wood, “Harmo- nized Guidelines for Single-Laboratory Validation of Methods of Analysis―(IUPAC Technical Report),” Pure and Applied Chemistry, Vol. 74, No. 5, 2002, pp. 835- 855. doi:10.1351/pac200274050835 [16] Instituto Nacional de Metrologia, Inmetro, Orientação Sobre Validação de Métodos Analíticos, Document: DOQ-CGC- RE-008, Version 03, 2010, p. 20. http://www.inmetro.gov.br/Sidoq/Arquivos/CGCRE/DO Q/DOQ-CGCRE-8_03.pdf [17] M. Ribani, C. B. G. Bottoli, C. H. Collins, L. C. S. F. Jardim and L. F. C. Melo, “Validation for Chromatographic and Electrophoretic Methods,” Química Nova, Vol. 27, No. 5, 2004, p. 771. doi:10.1590/S0100-40422004000500017 [18] USEPA 8270, “Environmental Protection Agency. Test Methods On-Line,” 2011. http://www.epa.gov [19] E. Martinez, M. Gros, S. Lacorte and D. Barceló, “Simplified Procedures for the Analysis of Polycyclic Aromatic Hydrocarbons in Water, Sediments and Mussels,” Journal of Chromatography A, Vol. 1047, No. 2, 2004, pp. 181-188. doi:10.1016/j.chroma.2004.07.003 [20] F. Barros, V. Hatje, M. B. Figueiredo, W. F. Magalhães, H. S. Dórea and E. S. Emídio, “The Structure of the Benthic Macrofaunal Assemblages and Sediments Characteristics of the Paraguaçu Estuarine System, NE, Brazil,” Estuarine, Coastal and Shelf Science, Vol. 78, No. 4, 2008, pp. 753-762. doi:10.1016/j.ecss.2008.02.016 [21] F. G. Prahl and R. Carpenter, “Polycyclic Aromatic Hydrocarbon (PAH)-Phase Associations in Washington Coastal Sediment,” Geochimica et Cosmochimica Acta, Vol. 47, No. 6, 1983, pp. 1013-1023. doi:10.1016/0016-7037(83)90231-4 Copyright © 2011 SciRes. AJAC
|