 American Journal of Anal yt ical Chemistry, 2011, 2, 892-901 doi:10.4236/ajac.2011.28103 Published Online December 2011 (http://www.SciRP.org/journal/ajac) Copyright © 2011 SciRes. AJAC Evaluation o f Re s po nse Surface Methodology in Dispersive Liquid-Liquid Microextraction for Lead Determination Using Ionic Liquids Behrooz Majidi, Farzaneh Shemirani*, Rouhollah Khani Department of Analytical Chemistry, Faculty of Chemistry, University College of Science, University of Tehran, Tehran, Iran E-mail: *shemiran@khayam.ut.ac Received February 28, 2011; revised April 1, 2011; accepted May 22, 2011 Abstract This paper describes a dispersive liquid–liquid microextraction (DLLME) procedure using room temperature ionic liquids (RTILs) coupled with flame atomic absorption spectrometry detection with microsample intro- duction system capable of quantifying trace amounts of lead. In the proposed approach, ammonium pyr- rolidine dithiocarbamate (APDC) was used as a chelating agent and 1-hexyl-3-methylimmidazolium bis (trifluormethylsulfonyl)imid as an extraction solvent was dissolved in acetone as the disperser solvent. The binary solution was then rapidly injected by a syringe into the water sample containing Pb2+ complex. Some factors influencing the extraction efficiency of Pb2+ and its subsequent determination, including extraction and dispersive solvent type, pH of sample solution, concentration of the chelating agent and salt effect were inspected by a full factorial design to identify important parameters and their interactions. Next, a central composite design was applied to obtain the optimum points of the important parameters. Under the optimum conditions, the limit of detection (LOD) was 0.2 µg/L. The relative standard deviation (R.S.D) was 1.4% for 5 µg/L of Pb2+ (n = 7). The relative recovery of lead in seawater, blood, tomato and black tea samples was measured. Keywords: Ionic Liquid, Dispersive Liquid-Liquid Microextraction, Microsample Injection, Experimental Design 1. Introduction Lead is a toxic element and can affect almost every or- gan or system in human body. The main target for lead toxicity is a nervous system. It also increases blood pressure and causes weakness in fingers, wrists and an- kles. Moreover, exposure to high level of lead can se- verely damage kidneys and brain. The International Agency for Research on Cancer (IARC) has determined that inorganic lead is probably carcinogenic to human [1]. For humans, the main sources of this metal intake are food, air and drinking water [2]. The quantification of lead in drinking water is very important considering the toxicity of this metal [3,4]. Lead is recognized world- wide as a poisonous metal. Due to these adverse effects, monitoring of lead in environmental, biological and food samples even at ultra trace level is very important. However, these analyses are difficult because such sam- ples contain relatively low concentrations of lead, which fall below the detection limit of conventional analytical techniques, such as flame atomic absorption spectrome- try and inductively coupled plasma optical emission spec- trometry. Several preconcentration procedures to deter- mine lead have been devised involving separation tech- niques, such as liquid-liquid extraction [5], coprecipita- tion [6], solid phase extraction [7], dispersive liquid- liquid microextraction [8] and cloud point extraction [9]. Flame atomic absorption spectrometry (FAAS) has been a very attractive technique for routine metal deter- minations, owing to its ease of operation, low acquisition and operating costs compared with inductively coupled plasma optical emission spectrometry (ICP-OES) [10], graphite furnace atomic absorption spectrometry (GFAAS) [11] and its high sample throughput [12]. Determination of Pb2+ by flame atomic absorption spectrometry (FAAS) is practically free of interference  B. MAJIDI ET AL.893 and requires an air-acetylene flame. However, there is a great necessity for the preconcentration of trace metals prior to their determination, basically due to their low concentrations in the aqueous sample. But there is often a natural limitation of sample volume in the analysis of very low volume samples. Typically, a volume of 1 - 4 mL of the sample solution is generally used for FAAS determination of a single element. In case of small sam- ple volumes, due to high dilution, the concentration of measured elements may be lower than the detection limit. Therefore, means of minimizing sample consumption while retaining high sensitivity for the measurement is of considerable importance. The flame microsampling technique makes it possible to reach this goal. Since in the microextraction techniques the extraction phase has low volume, by using the microsampling it is possible to determine an element at the low concentration. For this reason, there is no decrease in the activity related to the development of new analytical methods for the precon- centration of metal ions [13]. Assadi and co-workers [14] developed a novel micro- extraction technique, termed dispersive liquid–liquid microextraction (DLLME). However, a problem still exists, continued reliance on using toxic, hazardous, flam- mable and environmentally damaging organic solvents. Room temperature ionic liquids (RTILs) have recently attracted special interest as environment-friendly sol- vents to replace traditional volatile organic solvents in various areas of chemistry. They are salts liquid over a wide temperature range including room temperature and prepared by the combination of organic cations with various anions. RTILs have some unique physicochemi- cal properties, such as negligible vapor pressure, non- flammability, as well as good extractability for various organic compounds and metal ions, which make them very useful for LLE and LPME [15]. Several reports have appeared in which RTILs have been successfully utilized for extraction of metal ions [16-19]. In this method very small amounts of a hydrophobic IL, namely 1-hexyl-3-methylimmidazolium bis (trifluor- methylsulfonyl)imid [Hmim] [TF2N], were used as an extraction solvent, which is dissolved in acetone as a disperser solvent and then dispersed into the sample so- lution. Then cloudy solution was formed and the mixture was centrifuged for 5 min at 5000 rpm. As a result, the fine droplets of IL settled at the bottom of the centrifuge tube. 2. Experimental 2.1. Reagents Analytical reagent-grade chemicals were used without further purification. Stock solutions containing 1000 mg/L of Pb2+ was prepared by dissolving appropriate amounts of its nitrate salts (purchased from Merck, Darmstadt, Germany) and diluting to 1000 mL. Working standard solutions were obtained by appropriate stepwise dilution of the stock standard solutions. An ammonium pyrrolidine dithiocarbamate (APDC) solution (0.1 mol/L) was prepared by dissolving the compound (Sigma-Al- drich Chemie, Germany) in methanol of high purity. Ethanol (for spectroscopy), acetone (suprasolv), HCl (37%, suprapure), NaNO3 (0.2 mol/L, suprapure), NH3 (25%, suprapure) and CH3COONa (suprapure) which were obtained from Merck. 2.2. Microsample Introduction System The A volume of 1 - 4 mL of the sample solution is gen- erally used for FAAS determination of a single element. In case of small sample volumes, as a result of high dilu- tion, the concentration of measured elements may be lower than the detection limit. To overcome this diffi- culty, it is possible to determine an element by FAAS in a microliter sample volume (less than 100 µL). The small length of the PTFE capillary tube was used for the microsample introduction, which was coupled to the nebulizer needle by a one 1/4 in.-28 UNF Hub (Cat. No. 88986, Hamilton), fifty microliter of the sedimented phase was manually introduced by micropipette (50µL) into the female Luer fitting (1/4 in.-28 UNF, Cat. No. 35031, Hamilton), connected to a Hamilton plug valve. When the female Luer fitting of the plug valve was filled with the sample, the valve was switched back into the flow path and the sample was swept onto the flame for the lead monitoring. The absorbance signals including peak height were measured with a 3 s integration time. The microsample introduction system offered the oppor- tunity to introduce a volume of above 50 µL to the flame, providing spike-like, reproducible and interesting signal profiles. 2.3. Dispersive Liquid-Liquid Microextraction Procedure Aliquots of 10.0 mL sample solution containing 30 µg/L Pb2+ and APDC (pH 2.0) was placed in a 12 mL screw cap glass test tube with conic bottom. The amount of 500 µL of binary solution containing 60 mg of [Hmim] [Tf2N] (extraction solvent) and acetone (disperser solvent) was injected rapidly into the sample solution using a syringe and a stable cloudy solution (water, acetone and IL) was obtained. The Pb-APDC complex was extracted into the fine droplets of IL. The mixture was then centrifuged for 4 min at 5000 rpm. After this process fine droplets of Copyright © 2011 SciRes. AJAC  B. MAJIDI ET AL. 894 [Hmim] [Tf2N] were joined together and sedimented at the bottom of the conical test tube. After removal of the whole aqueous solution, the extraction phase was diluted with 50 µL of ethanol. Fifty microliters of the sediment phase were removed by use of a 50 µL microsyringe (minimum scale of 1 µL) and injected into the FAAS for analysis. Calibration was performed against aqueous standards submitted to the same DLLME procedure. A blank submitted to the same procedure described above was measured parallel to the sample and calibration solu- tions. The enrichment factor was calculated as the ratio of the analytical signal of Pb2+ obtained after and before extraction. 2.4. Preparation of Samples 2 mL (blood sample) put in a beaker and 10 mL of dis- tilled deionized water, 24 mL HNO3 and 6 mL of H2O2 (30%) added to solution. While stirring heat on a plate until decrease its volume to half, it was filtrate and com- pleted in 100 mL volumetric flask with distilled water. The preconcentration procedure given above was applied to these solutions. The dry tea and tomato samples were digested as fol- low, after 10 g of tomato and 10 g of dry tea (dried at 110˚C) was placed in a 50 mL beaker, 7 mL of concen- trated nitric acid was added and the beaker was covered with glass watch and the content was heated on a hot plate (150˚C for 15 min). The sample was then cooled, 3 mL of hydrogen peroxide was added and the mixture was heated again at 200˚C, until the solution became clear (about 1 h). The glass watch was removed and the acid evaporated to dryness at 150˚C. The white residue was completely dissolved in 5 mL of 1 mol/L nitric acid and the solution was transferred to a 100 mL volumetric flask. The solution was then neutralized with proper NaOH solution. The resulting solution was diluted to the mark and the recommended procedure was followed. Sea water sample was collected from Caspian Sea, Iran. The water sample was filtered through a 0.45 µm pore size membrane filter and stored in dark. 3. Results and Discussion 3.1. Selection of Ionic Liquid ILs are composed of asymmetrically substituted nitrogen containing cations (e.g. imidazole, pyrrolidine, pyri- dine...) with inorganic anions (e.g. Cl−, 4 BF , 6 BF , (CF3SO2)2 N−...) [20]. Due to the reason that the range of available anion and cation combinations could provide up to 10 different room temperature ILs, it may be diffi- cult to select desired IL. However, following considera- tion can ease the IL selection: 1) IL must be water immiscible. ILs containing Cl−, 4 BF , and 33 CFSO are water-miscible and ILs contain- ing 6 PF , (CF3SO2)2N− are water-immiscible. 2) IL must be liquid in experimental conditions for LLE. 6 PF type ILs are often hydrolyzed with acids to pro- duce harmful hydrogen fluoride [21]. On the contrary, another type of ILs, those containing bis(trifluoromethanesulfonyl)imide anion (Tf2N–), are very stable and seldom hydrolyzed. Generally, selected IL has to be more immiscible in the sample solution to reduce extraction solvent consumption, moreover, IL must produce sedimented phase at appropriate amounts. Since the sample volume was 10 mL, if [Hmim] [Tf2N] was chosen as IL, about 34 mg of it will be dissolved in the sample, while water solubility of [Hmim] [PF6] is 75 mg/10 mL. Therefore, in this work we selected [Hmim] [Tf2N] IL as the extraction solvent. From these facts, it is obvious that the Tf2N– type ILs are manageable as extraction solvents compared with the 6 PF type ones analytical reagen. 3.2. Effect of Type and Volume of the Disperser Solvent Disperser solvent is soluble in the extraction solvent and should be miscible in water, thus enabling the extraction solvent to be dispersed as fine particles in aqueous phase to form a cloudy solution (water/disperser solvent/ex- traction solvent). In such a case, the surface area between extraction solvent and aqueous phase (sample) can be infinitely large, thus to increase the extraction efficiency. The commonly used disperser solvents include methanol, ethanol, acetonitrile, acetone and tetrahydrofuran. The main criterion for the selection of disperser solvent is its miscibility in the extraction solvent and aqueous solution. In addition, the type of disperser directly influences the viscosity of the binary solvent. Thus, this solvent can control droplet production and extraction efficiency. To study this effect, two different solvents such as acetone and ethanol were tested. A series of sample solutions were studied using 500 µL of each disperser solvent with 60 mg of the IL (extraction solvent). The obtained en- richment factors for these two dispersers show no statis- tically significant differences between them; however, acetone was selected because it is more accessible than ethanol. 3.3. Experimental Design After determining the range of the dispersive variable through screening, experiments were designed to find the Copyright © 2011 SciRes. AJAC  B. MAJIDI ET AL. Copyright © 2011 SciRes. AJAC 895 interaction of four variables, i.e. amount of binary solu- tion containing 60 mg of [Hmim] [Tf2N] (extraction sol- vent) and acetone (disperser solvent), NaNO3 0.2 mol/L as a salting out reagent, pH and APDC concentration. Table 1 represents the coded and non-coded values of the experimental variables. Design of experiment along with the enrichment factor is given in Table 2. The ex- periments were carried out in duplicate that was neces- sary to estimate the variability of measurements. The yields are reported as mean of the duplicates. The rela- tionship of the independent variables and the response was calculated by the second order polynomial equation. To find the most important effects and interactions, analysis of variance (ANOVA) was calculated using software package, Design-Expert 7.1.6 [22]. The Model F-value of 20.47 implies that the model is significant, there is only a 0.52% chance that such a large “Model F-Value” could occur due to noise. Values of “Prob > F” less than 0.0500 indicate the model terms are significant. In this case all factors are significant model terms. Values greater than 0.1000 indicate the model terms are not significant [23]. If there are many insignificant model terms (not count- ing those required to support hierarchy), model reduction may improve the model. Hence, the four factors of A, B, C and D were to be used in the next step of the design. Factorial designs are used primarily for screening sig- nificant factors, but can also be sequentially used to model and refine a process; the central composite design was widely used for fitting a second order model. By using this method, modeling is possible and it requires only a minimum number of experiments. It is not neces- sary in the modeling procedure to know the detailed re- action mechanism, since the mathematical model is em- pirical [24]. The experiments were randomized and divided into two blocks, for the same reasons as mentioned for the Table 1. Independent variable s, their levels and symbols for factorial design. Variable levels Variable Effect Symbol Low high binary solution containing 60 mg ionic liquid (mL) A 0.2 0.5 pH B 0 5 Ligand (mol/L) C 1 × 10⁻³ 4 × 10⁻³ NaNO3 0.2 mol/L (mL) D 0.5 2 Table 2. Analysis of variance (ANOVA) for full factorial design. Response Run no Block A B C D Recovery (%) Enrichment factor Sedimented phase volume (µL) 1 1 0.5 0 4 × 10⁻³ 0.5 41.21 58.8 78 2 1 0.2 5 10–3 2 22.82 38.1 60 3 1 0.2 5 4 × 10⁻³ 0.5 28.48 41.2 69 4 1 0.5 0 10–3 2 14.32 19.2 74 5 1 0.5 5 4 × 10⁻³ 2 57.14 76.18 75 6 1 0.5 5 10–3 0.5 69.14 91.3 77 7 1 0.2 0 10–3 0.5 37.36 54.9 68 8 1 0.2 0 4 × 10⁻³ 2 45.17 75.3 60 9 2 0.5 0 10–3 0.5 4.73 6.5 77 10 2 0.2 5 4 × 10⁻³ 2 8.18 13.6 60 11 2 0.5 5 10–3 2 32.25 43.5 74 12 2 0.2 0 4 × 10⁻³ 0.5 24.42 35..2 69 13 2 0.2 0 10–3 2 6.53 10.6 60 14 2 0.5 0 4 × 10⁻³ 2 32.27 43.6 74 15 2 0.2 5 10–3 0.5 31.82 46.7 68 16 2 0.5 5 4 × 10⁻³ 0.5 56.64 73.5 77  B. MAJIDI ET AL. Copyright © 2011 SciRes. AJAC 896 2 AB factorial design. The factor levels and the design matrix with the responses (Recovery (%)) are shown in Tables 3 and 4, respectively. The software package Design-Ex- pert 7.1.6 was used to analyze the experimental data and to plot the graphs. The ANOVA data to evaluate the sig- nificance of the model equation and model terms are shown; the model F-value of 6.85 implies that the model is significant. This model, shown in Equation (1), con- sisted of four main effects four two-factor interaction effects and four curvature effects. In this case A, B, C, AB, AC, A2, B2, C2 are significant model terms. 222 56.50 7.288.080.205.46 3.000.140.2 0.55 0.668.992.75 3.560.32 RABD ACAD BCBD CD ABCD (1) The quality of fit of the polynomial model equation was expressed by the coefficient of determination (R2, adjusted-R2 and “adequate precision”). R2 is a measure Table 3. Factors and their levels for the central composite design. levels Variable Symbol –α –1 0 +1 +α binary solution containing 60 mg ionic liquid (mL)A 0.3 0.4 0.5 0.6 0.7 pH B 0.5 2 3.5 5 6.5 Ligand (mol/L) C 5 × 10⁻⁴ 1.5 × 10⁻³ 2.5 × 10⁻³ 3.5 × 10⁻³ 4.5 × 10⁻³ NaNO3 0.2 mol/L (mL) D 0.5 1 1.5 2 2.5 Table 4. Design matrix and responses for the central composite design. RunNO Block A B C D Recovery (%) 1 1 0.6 2 3. 5 × 10⁻³ 2 58.05 2 1 0.6 2 3. 5 × 10⁻³ 1 56.78 3 1 0.4 5 3. 5 × 10⁻³ 1 34.49 4 1 0.4 2 3. 5 × 10⁻³ 2 74.76 5 1 0.5 3.5 2.5 × 10⁻³ 1.5 68.70 6 1 0.6 5 1.5 × 10⁻³ 2 34.57 7 1 0.4 5 1.5 × 10⁻³ 2 45.66 8 1 0.4 5 3.5 × 10⁻³ 2 40.34 9 1 0.6 2 1.5 × 10⁻³ 1 37.14 10 1 0.6 5 1.5 × 10⁻³ 1 33.43 11 1 0.6 5 3.5 × 10⁻³ 2 37.02 12 1 0.4 2 1.5 × 10⁻³ 2 52.01 13 1 0.5 3.5 2.5 × 10⁻³ 1.5 66.38 14 1 0.4 2 3.5 × 10⁻³ 1 78.54 15 1 0.6 2 1.5 × 10⁻³ 2 40.03 16 2 0.6 5 3.5 × 10⁻³ 1 35.47 17 2 0.5 3.5 2.5 × 10⁻³ 1.5 60.98 18 2 0.5 3.5 2.5 × 10⁻³ 1.5 62.52 19 2 0.4 5 1.5 × 10⁻³ 1 46.62 20 2 0.4 2 1.5 × 10⁻³ 1 53.88 21 2 0.5 3.5 5 × 10⁻⁴ 1.5 40.96 22 2 0.5 6.5 2.5 × 10⁻³ 1.5 13.81 23 2 0.5 0.5 2.5 × 10⁻³ 1.5 36.89 24 2 0.3 3.5 2.5 × 10⁻³ 1.5 62.54 25 2 0.5 3.5 4.5 × 10⁻³ 1.5 68.67 26 2 0.5 3.5 2.5 × 10⁻³ 1.5 69.47 27 2 0.5 3.5 2.5 × 10⁻³ 0.5 68.45 28 2 0.5 3.5 2.5 × 10⁻³ 1.5 68.72 29 2 0.7 3.5 2.5 × 10⁻³ 1.5 39.45 30 2 0.5 3.5 2.5 × 10⁻³ 2 69.18  B. MAJIDI ET AL. Copyright © 2011 SciRes. AJAC 897 of the amount of variation around the mean, explained by the model and equal to 0.9670. The adjusted-R2 is ap- plied for the number of terms in the model. If those addi- tional terms do not add value to the model, it is equal to 0.9341. It decreases, as the number of terms in the model increases. Adequate precision is a signal-to-noise ratio. It compares the range of the predicted values at the design points to the average prediction error. Ratios greater than 4 indicate adequate model discrimination. In this case, it is equal to 21.92. The response model is mapped against two experi- mental factors, while the third is held constant at its cen- tral level. Figure 1(a) shows the three dimensional re- sponse surfaces, which were constructed to show the two most important variables (pH and ionic liquid) on the absorbance of Pb2+ at constant ligand (250 µL) and initial volume of salt including NaNO3 0.2 mol/L (2 mL) to investigate the salting out effect. It can be seen from the Figure 1(a), that the efficiency increased by decreasing the volume of the extractor. This is related to the de- crease of the volume of sedimented phase and is ex- plained in Equation (1). pH plays a unique role in metal–chelate formation and subsequent extraction. The Figure 1(a) shows, that the extraction efficiency was nearly constant in the pH range of 1.5 - 2.5. Absorbance of complex versus pH is high, up to pH 2.5 and decrease from pH 2.5 - 5. Figure 1(b) shows, that there is no interaction be- tween the volume of salt and pH. Analysis of variance in Equation (1) also confirms that salt causes no significant effect. At higher salt content, the density of the solution became higher than that of IL; therefore the extractant phase did not settle. In Figure 1(c) there is a combined effect of APDC volume and the amount of [Hmim] [TF2N]. As it can be seen, the signal increases up to a known concentration of (a) (b) (c) (d) Figure 1. Response surface of recovery modeling: (a) show the most important two variables (pH and ionic liquid) on the extraction efficiency of Pb (II) at constant ligand (2.5 × 10⁻³ mol/L) and initial volume of NaNO3 0.2 mol/L (2 mL); (b) interaction betw een the volume of salt and pH; (c) showe d two variables (ligand and ionic liquid) on the extraction efficiency of Pb (II) at constant pH (2.5) and initial volume of salt (2 mL); (d) interaction between the volume of salt and amount of Hmim] [TF2N]. [ 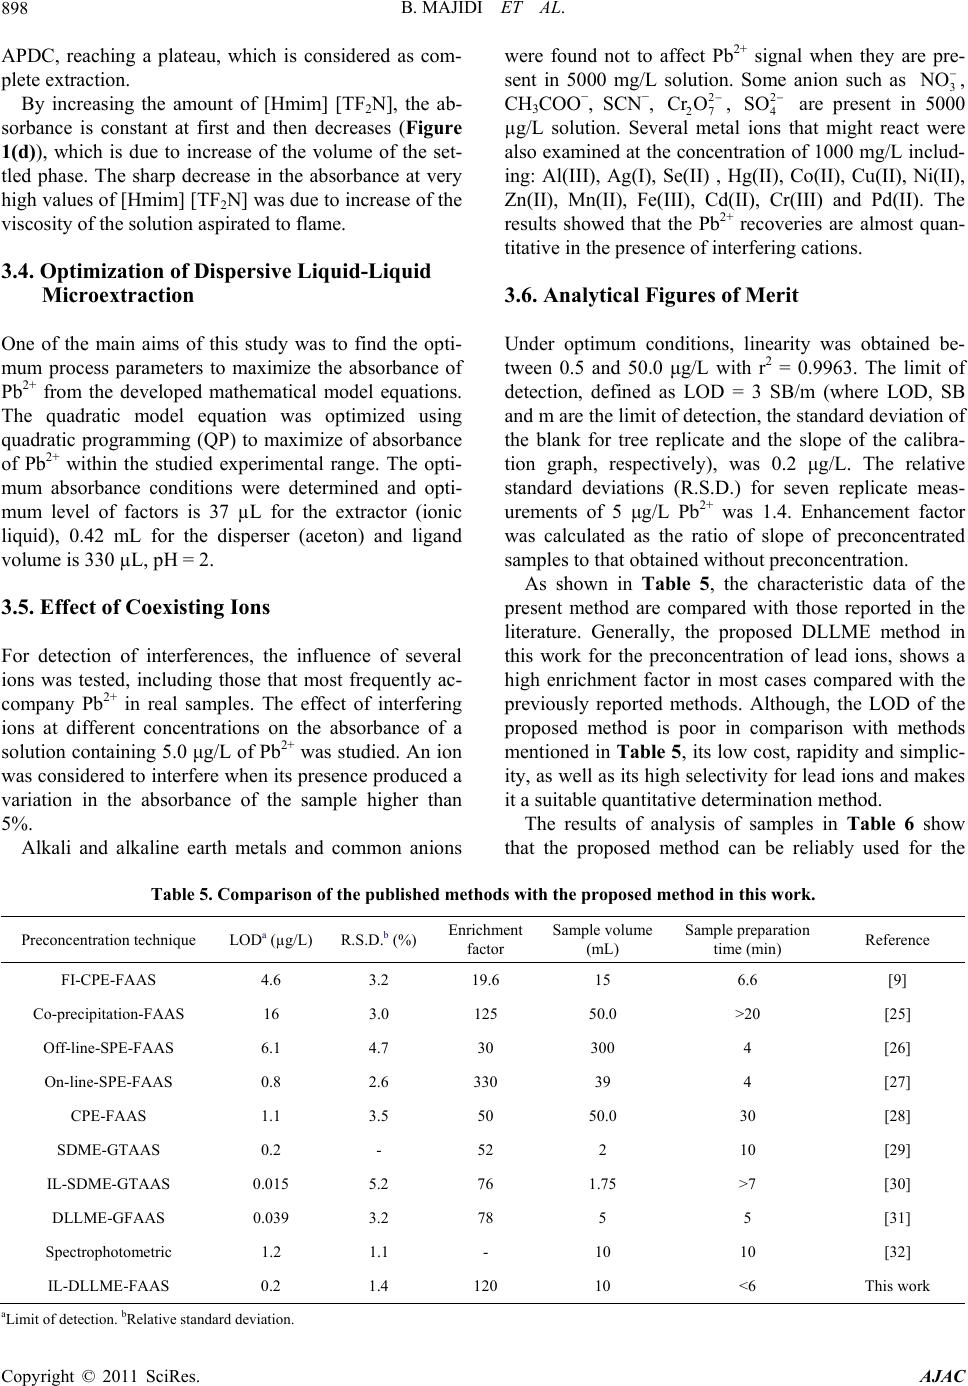 B. MAJIDI ET AL. Copyright © 2011 SciRes. AJAC 898 APDC, reaching a plateau, which is considered as com- plete extraction. By increasing the amount of [Hmim] [TF2N], the ab- sorbance is constant at first and then decreases (Figure 1(d)), which is due to increase of the volume of the set- tled phase. The sharp decrease in the absorbance at very high values of [Hmim] [TF2N] was due to increase of the viscosity of the solution aspirated to flame. 3.4. Optimization of Dispersive Liquid-Liquid Microextraction One of the main aims of this study was to find the opti- mum process parameters to maximize the absorbance of Pb2+ from the developed mathematical model equations. The quadratic model equation was optimized using quadratic programming (QP) to maximize of absorbance of Pb2+ within the studied experimental range. The opti- mum absorbance conditions were determined and opti- mum level of factors is 37 µL for the extractor (ionic liquid), 0.42 mL for the disperser (aceton) and ligand volume is 330 µL, pH = 2. 3.5. Effect of Coexisting Ions For detection of interferences, the influence of several ions was tested, including those that most frequently ac- company Pb2+ in real samples. The effect of interfering ions at different concentrations on the absorbance of a solution containing 5.0 μg/L of Pb2+ was studied. An ion was considered to interfere when its presence produced a variation in the absorbance of the sample higher than 5%. Alkali and alkaline earth metals and common anions were found not to affect Pb2+ signal when they are pre- sent in 5000 mg/L solution. Some anion such as 3 NO , CH3COO−, SCN−, 2 27 CrO , are present in 5000 µg/L solution. Several metal ions that might react were also examined at the concentration of 1000 mg/L includ- ing: Al(III), Ag(I), Se(II) , Hg(II), Co(II), Cu(II), Ni(II), Zn(II), Mn(II), Fe(III), Cd(II), Cr(III) and Pd(II). The results showed that the Pb2+ recoveries are almost quan- titative in the presence of interfering cations. 2 4 SO 3.6. Analytical Figures of Merit Under optimum conditions, linearity was obtained be- tween 0.5 and 50.0 μg/L with r2 = 0.9963. The limit of detection, defined as LOD = 3 SB/m (where LOD, SB and m are the limit of detection, the standard deviation of the blank for tree replicate and the slope of the calibra- tion graph, respectively), was 0.2 μg/L. The relative standard deviations (R.S.D.) for seven replicate meas- urements of 5 μg/L Pb2+ was 1.4. Enhancement factor was calculated as the ratio of slope of preconcentrated samples to that obtained without preconcentration. As shown in Table 5, the characteristic data of the present method are compared with those reported in the literature. Generally, the proposed DLLME method in this work for the preconcentration of lead ions, shows a high enrichment factor in most cases compared with the previously reported methods. Although, the LOD of the proposed method is poor in comparison with methods mentioned in Table 5, its low cost, rapidity and simplic- ity, as well as its high selectivity for lead ions and makes it a suitable quantitative determination method. The results of analysis of samples in Table 6 show that the proposed method can be reliably used for the Table 5. Comparison of the published methods with the proposed method in this work. Preconcentration technique LODa (µg/L) R.S.D.b (%) Enrichment factor Sample volume (mL) Sample preparation time (min) Reference FI-CPE-FAAS 4.6 3.2 19.6 15 6.6 [9] Co-precipitation-FAAS 16 3.0 125 50.0 >20 [25] Off-line-SPE-FAAS 6.1 4.7 30 300 4 [26] On-line-SPE-FAAS 0.8 2.6 330 39 4 [27] CPE-FAAS 1.1 3.5 50 50.0 30 [28] SDME-GTAAS 0.2 - 52 2 10 [29] IL-SDME-GTAAS 0.015 5.2 76 1.75 >7 [30] DLLME-GFAAS 0.039 3.2 78 5 5 [31] Spectrophotometric 1.2 1.1 - 10 10 [32] IL-DLLME-FAAS 0.2 1.4 120 10 <6 This work aLimit of detection. bRelative standard deviation.  B. MAJIDI ET AL.899 Table 6. Determination of Pb(II) in blood, sea water, tomato and Indian black tea. ICP-OES (µg/L) Recovery (℅) Founded Pb(II) (µg/L) Mean ± S.Da Added (µg/L) Sample No detect 20.4 ± 1.1 99.99 11.21 ± 0.08 21.20 ± 1.2 - 10 Sea waterb No detect 9.4 ± 1.2 101 0.4 ± 0.04 10.6 ± 0.08 - 10 Blood No detect 10.1 ± 0.3 - No detect 19.7 ± 0.09 - 10 Tap waterc 9.1 ± 0.3 20.82 ± 0.2 99.2 10.83 ± 0.07 20.67 ± 0.09 - 10 Tomatod No detect 15.7 ± 0.6 99.95 5.72 ± 0.03 15.51 ± 0.06 - 10 Indian black tea (seylon)d Concentration (µg/kg) Found Certified Reference material 26.52 ± 0.73 27.89 ± 0.14 SRM1640 aStandard deviation (n = 3); bCaspian sea water, Iran; cFrom drinking water system of Tehran, Iran; dunit of Pb(II) concentration is µg/kg. determination of Pb2+ in different matrices. The charac- teristic data of the present method are also compared with those reported in the literature. In order to validate the method for accuracy and precision, a certified refer- ence material (SRM 1640, for natural water) was ana- lyzed. The certified values and the analytical results are presented in Table 6. The found results were in good agreement with the certified values of CRM. 4. Conclusions Experiments showed that ionic liquid as an extraction solvent and pH are the most important parameters. To determine the optimum operating conditions that yield maximum efficiency, response surface methodologies (RSM) were used (considering the effect of each factor individually). But using central composite design, quad- ratic and interaction terms revealed. Therefore, we were able to see detailed effect of factors on each other and also on the efficiency. This helped us to choose the best experimental conditions for the effective factors more precisely with minimal experimental trials. DLLME based on ionic liquid combined with the flame atomic absorption spectrometry (FAAS) was evaluated for the separation, the preconcentration and the determination of the ultra trace amounts of Pb2+ (at sub µg/L level) in water samples. DLLME based on ionic liquid has been proved to be a fast, simple, inexpensive and reproducible technique for determination of trace metals with the use of low sample volumes. The high-preconcentration factor and the low sample volume requirements are the major advantages of the technique. An enrichment factor of about 150 times was attained with only a 10 mL of the sample. The determination was carried out by flame atomic absorption spectrometer using a home-made microsam- ple introduction system. Injection of small volume of the extractant phase leads to high values of the enrichment factor. The microsampling technique gave a linear cali- bration plot and a good precision. In this method, the sample preparation is time as well as the consumption of the organic solvents is minimized without affecting the sensitivity of the method. 5. Acknowledgements Financial support from University of Tehran is gratefully acknowledged. 6. References [1] Agency for Toxic Substances and Disease Registry (ATSDR), “Toxicological Profile for Lead, Public Health Service,” U.S. Department of Health and Human Services, Atlanta, 2004. [2] H. G. A. Seiler and H. Sigel, “Handbook on Toxicity of Inorganic Compounds,” Marcel Dekker, New York, 1998. [3] M. D. A. Kom, J. B. Andrade, D. S. de Jesus, V. A. Lemos, M. L. S. F. Bandeira, W. N. L. dos Santos, M. A. Bezerra, F. A. Amorim, C. A. S. Souza and S. L. C. Ferreira, “Separation and Preconcentration Procedures for the Determination of Lead Using Spectrometric Tech- niques: A Review,” Talanta, Vol. 69, No. 1, 2006, pp. 16-24. doi:10.1016/j.talanta.2005.10.043 [4] M. F. Silva, E. S. Cerutti and L. D. Martinez, “Coupling Cloud Point Extraction to Instrumental Detection Sys- tems for Metal Analysis,” Microchimica Acta, Vol. 155, No. 3-4, 2006, pp. 349-364. doi:10.1007/s00604-006-0511-3 Copyright © 2011 SciRes. AJAC 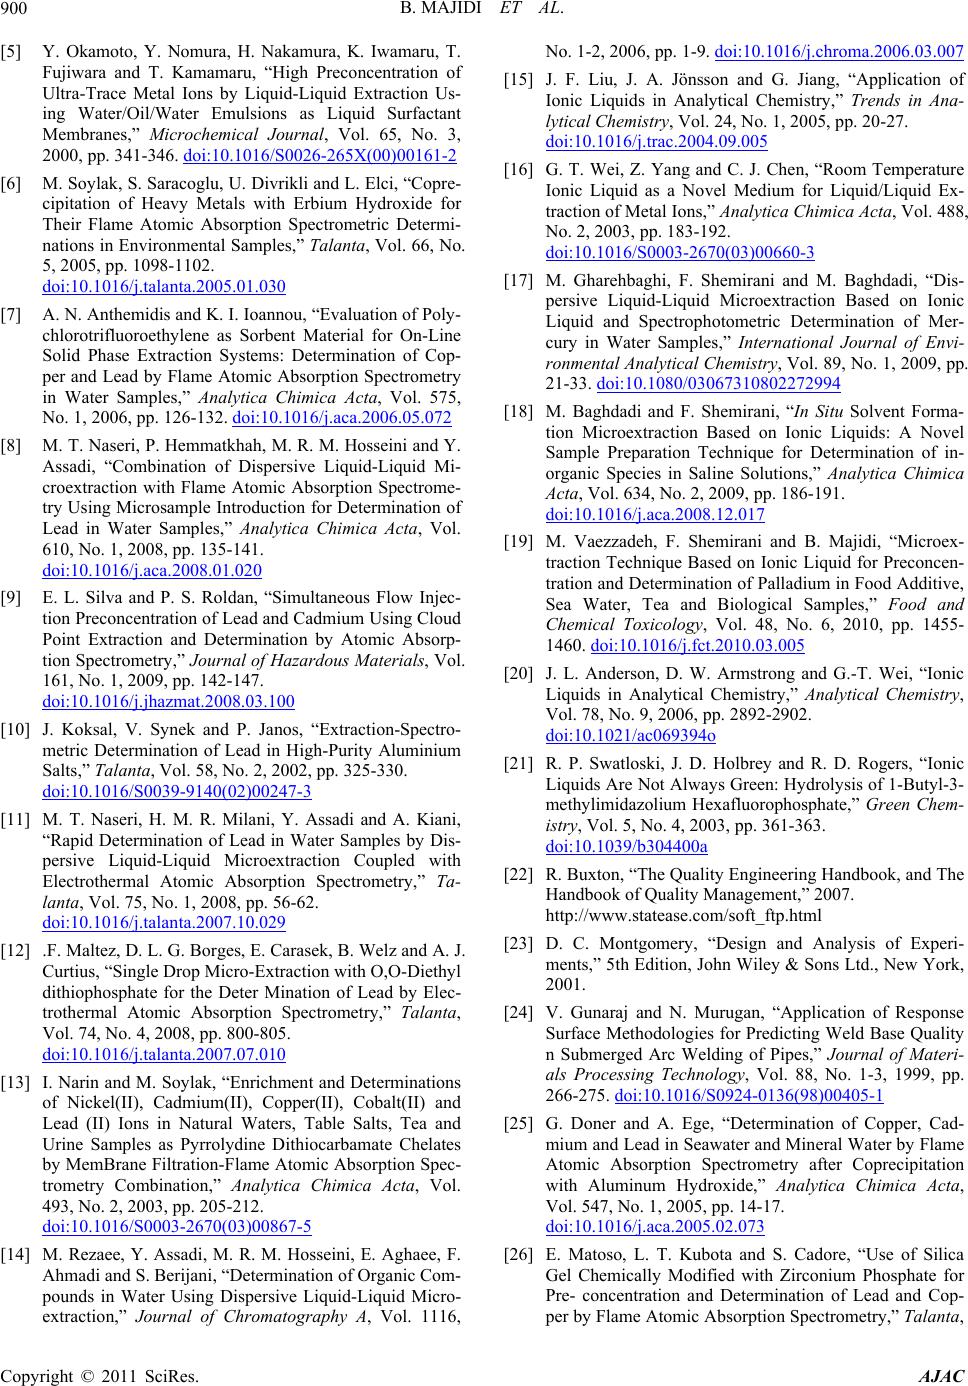 B. MAJIDI ET AL. 900 [5] Y. Okamoto, Y. Nomura, H. Nakamura, K. Iwamaru, T. Fujiwara and T. Kamamaru, “High Preconcentration of Ultra-Trace Metal Ions by Liquid-Liquid Extraction Us- ing Water/Oil/Water Emulsions as Liquid Surfactant Membranes,” Microchemical Journal, Vol. 65, No. 3, 2000, pp. 341-346. doi:10.1016/S0026-265X(00)00161-2 [6] M. Soylak, S. Saracoglu, U. Divrikli and L. Elci, “Copre- cipitation of Heavy Metals with Erbium Hydroxide for Their Flame Atomic Absorption Spectrometric Determi- nations in Environmental Samples,” Talanta, Vol. 66, No. 5, 2005, pp. 1098-1102. doi:10.1016/j.talanta.2005.01.030 [7] A. N. Anthemidis and K. I. Ioannou, “Evaluation of Poly- chlorotrifluoroethylene as Sorbent Material for On-Line Solid Phase Extraction Systems: Determination of Cop- per and Lead by Flame Atomic Absorption Spectrometry in Water Samples,” Analytica Chimica Acta, Vol. 575, No. 1, 2006, pp. 126-132. doi:10.1016/j.aca.2006.05.072 [8] M. T. Naseri, P. Hemmatkhah, M. R. M. Hosseini and Y. Assadi, “Combination of Dispersive Liquid-Liquid Mi- croextraction with Flame Atomic Absorption Spectrome- try Using Microsample Introduction for Determination of Lead in Water Samples,” Analytica Chimica Acta, Vol. 610, No. 1, 2008, pp. 135-141. doi:10.1016/j.aca.2008.01.020 [9] E. L. Silva and P. S. Roldan, “Simultaneous Flow Injec- tion Preconcentration of Lead and Cadmium Using Cloud Point Extraction and Determination by Atomic Absorp- tion Spectrometry,” Journal of Hazardous Materials, Vol. 161, No. 1, 2009, pp. 142-147. doi:10.1016/j.jhazmat.2008.03.100 [10] J. Koksal, V. Synek and P. Janos, “Extraction-Spectro- metric Determination of Lead in High-Purity Aluminium Salts,” Talanta, Vol. 58, No. 2, 2002, pp. 325-330. doi:10.1016/S0039-9140(02)00247-3 [11] M. T. Naseri, H. M. R. Milani, Y. Assadi and A. Kiani, “Rapid Determination of Lead in Water Samples by Dis- persive Liquid-Liquid Microextraction Coupled with Electrothermal Atomic Absorption Spectrometry,” Ta- lanta, Vol. 75, No. 1, 2008, pp. 56-62. doi:10.1016/j.talanta.2007.10.029 [12] .F. Maltez, D. L. G. Borges, E. Carasek, B. Welz and A. J. Curtius, “Single Drop Micro-Extraction with O,O-Diethyl dithiophosphate for the Deter Mination of Lead by Elec- trothermal Atomic Absorption Spectrometry,” Talanta, Vol. 74, No. 4, 2008, pp. 800-805. doi:10.1016/j.talanta.2007.07.010 [13] I. Narin and M. Soylak, “Enrichment and Determinations of Nickel(II), Cadmium(II), Copper(II), Cobalt(II) and Lead (II) Ions in Natural Waters, Table Salts, Tea and Urine Samples as Pyrrolydine Dithiocarbamate Chelates by MemBrane Filtration-Flame Atomic Absorption Spec- trometry Combination,” Analytica Chimica Acta, Vol. 493, No. 2, 2003, pp. 205-212. doi:10.1016/S0003-2670(03)00867-5 [14] M. Rezaee, Y. Assadi, M. R. M. Hosseini, E. Aghaee, F. Ahmadi and S. Berijani, “Determination of Organic Com- pounds in Water Using Dispersive Liquid-Liquid Micro- extraction,” Journal of Chromatography A, Vol. 1116, No. 1-2, 2006, pp. 1-9. doi:10.1016/j.chroma.2006.03.007 [15] J. F. Liu, J. A. Jönsson and G. Jiang, “Application of Ionic Liquids in Analytical Chemistry,” Trends in Ana- lytical Chemistry, Vol. 24, No. 1, 2005, pp. 20-27. doi:10.1016/j.trac.2004.09.005 [16] G. T. Wei, Z. Yang and C. J. Chen, “Room Temperature Ionic Liquid as a Novel Medium for Liquid/Liquid Ex- traction of Metal Ions,” Analytica Chimica Acta, Vol. 488, No. 2, 2003, pp. 183-192. doi:10.1016/S0003-2670(03)00660-3 [17] M. Gharehbaghi, F. Shemirani and M. Baghdadi, “Dis- persive Liquid-Liquid Microextraction Based on Ionic Liquid and Spectrophotometric Determination of Mer- cury in Water Samples,” International Journal of Envi- ronmental Analytical Chemistry, Vol. 89, No. 1, 2009, pp. 21-33. doi:10.1080/03067310802272994 [18] M. Baghdadi and F. Shemirani, “In Situ Solvent Forma- tion Microextraction Based on Ionic Liquids: A Novel Sample Preparation Technique for Determination of in- organic Species in Saline Solutions,” Analytica Chimica Acta, Vol. 634, No. 2, 2009, pp. 186-191. doi:10.1016/j.aca.2008.12.017 [19] M. Vaezzadeh, F. Shemirani and B. Majidi, “Microex- traction Technique Based on Ionic Liquid for Preconcen- tration and Determination of Palladium in Food Additive, Sea Water, Tea and Biological Samples,” Food and Chemical Toxicology, Vol. 48, No. 6, 2010, pp. 1455- 1460. doi:10.1016/j.fct.2010.03.005 [20] J. L. Anderson, D. W. Armstrong and G.-T. Wei, “Ionic Liquids in Analytical Chemistry,” Analytical Chemistry, Vol. 78, No. 9, 2006, pp. 2892-2902. doi:10.1021/ac069394o [21] R. P. Swatloski, J. D. Holbrey and R. D. Rogers, “Ionic Liquids Are Not Always Green: Hydrolysis of 1-Butyl-3- methylimidazolium Hexafluorophosphate,” Green Chem- istry, Vol. 5, No. 4, 2003, pp. 361-363. doi:10.1039/b304400a [22] R. Buxton, “The Quality Engineering Handbook, and The Handbook of Quality Management,” 2007. http://www.statease.com/soft_ftp.html [23] D. C. Montgomery, “Design and Analysis of Experi- ments,” 5th Edition, John Wiley & Sons Ltd., New York, 2001. [24] V. Gunaraj and N. Murugan, “Application of Response Surface Methodologies for Predicting Weld Base Quality n Submerged Arc Welding of Pipes,” Journal of Materi- als Processing Technology, Vol. 88, No. 1-3, 1999, pp. 266-275. doi:10.1016/S0924-0136(98)00405-1 [25] G. Doner and A. Ege, “Determination of Copper, Cad- mium and Lead in Seawater and Mineral Water by Flame Atomic Absorption Spectrometry after Coprecipitation with Aluminum Hydroxide,” Analytica Chimica Acta, Vol. 547, No. 1, 2005, pp. 14-17. doi:10.1016/j.aca.2005.02.073 [26] E. Matoso, L. T. Kubota and S. Cadore, “Use of Silica Gel Chemically Modified with Zirconium Phosphate for Pre- concentration and Determination of Lead and Cop- per by Flame Atomic Absorption Spectrometry,” Talanta, Copyright © 2011 SciRes. AJAC  B. MAJIDI ET AL. Copyright © 2011 SciRes. AJAC 901 Vol. 60, No. 6, 2003, pp. 1105-1111. doi:10.1016/S0039-9140(03)00215-7 [27] G. A. Zachariadis, A. N. Anthemidis, P. G. Bettas and J. A. Stratis, “Determination of Lead by On-Line Solid Phase Extraction Using a PTFE Micro-Column and Flame Atomic Absorption Spectrometry,” Talanta, Vol. 57, No. 5, 2002, pp. 919-927. doi:10.1016/S0039-9140(02)00132-7 [28] J. Chen and K. C. Teo, “Determination of Cadmium, Copper, Lead and Zinc in Water Samples by Flame Atomic Absorption Spectrometry after Cloud Point Ex- traction,” Analytica Chimica Acta, Vol. 450, No. 1-2, 2001, pp. 215-222. doi:10.1016/S0003-2670(01)01367-8 [29] H. F. Maltez, D. L. G. Borges, E. Carasek, B. Welz and A. J. Curtius, “Single Drop Micro-Extraction with O,O Di- ethyl Dithiophosphate for the Determination of Lead by Electrothermal Atomic Absorption Spectrometry,” Ta- lanta, Vol. 74, No. 4, 2008, pp. 800-805. doi:10.1016/j.talanta.2007.07.010 [30] J. L. Manzoori and M. A. J. Abulhassani, “Ultra-Trace Determination of Lead in Water and Food Samples by Using Ionic Liquid-Based Single Drop Microextrac- tion-Electrothermal Atomic Absorption Spectrometry,” Analytica Chimica Acta, Vol. 644, No. 1-2, 2009, pp. 48- 52. doi:10.1016/j.aca.2009.04.029 [31] P. Liang and H. Sang, “Determination of Trace Lead in Biological and Water Samples with Dispersive Liquid- Liquid Microextraction Preconcentration,” Analytical Biochemistry, Vol. 380, No. 1, 2008, pp. 21-25. doi:10.1016/j.ab.2008.05.008 [32] Z. Li, J. Tang and J. Pan, “The Determination of Lead in Preserved Food by Spectrophotometry with Dibromohy- droxyphenylporphyrin,” Food Control, Vol. 15, 2004, pp. 565-570. doi:10.1016/j.foodcont.2003.09.002
|