American Journal of Anal yt ical Chemistry, 2011, 2, 885-891
doi:10.4236/ajac.2011.28102 Published Online December 2011 (http://www.SciRP.org/journal/ajac)
Copyright © 2011 SciRes. AJAC
Comparison of FT-NIR Transmission and HPLC to Assay
Montelukast in Its Pharmaceutical Tablets
Ahmed B. Eldin1*, Abdalla A. Shalaby2
1Sigma Pharmaceutical Corp., Egypt
2Analytical Chemistry Department, Faculty of Pharmacy, Zagazig University, Zagazig, Egypt
E-mail: a.badr@sigma-pharm.com
Received February 25, 2011; revised April 6, 2011; accepted April 25, 2011
Abstract
For several years, near-infrared spectroscopy (NIRS) has become an analytical technique of great interest for
the pharmaceutical industry, particularly for the non-destructive analysis of dosage forms. The goal of this
study is to show the capacity of this new technique to assay the active ingredient in low-dosage tablets. NIR
spectroscopy is a rapid, non-destructive technique and does not need any sample preparation. A prediction
model was built by using a partial least square regression fit method. The NIR assay was performed by
transmission. The results obtained by NIR spectroscopy were compared with the conventional HPLC method
for Montelukast tablets produced by Sigma pharmaceutical corp. The study showed that Montelukast tablets
can be individually analyzed by NIR with high accuracy. It was shown that the variability of this new tech-
nique is less important than that of the conventional method which is the HPLC with UV detection.
Keywords: FT-NIR Transmission, PAT, Validation, HPLC Assay, Montelukast Tablets, PLS Model
1. Introduction
Currently the Food and Drug Administration adopt what
is known as process analytical technology (PAT) initia-
tive which is a collaboration effort with industry to fa-
cilitate the introduction of new and efficient manufac-
turing technologies. PAT are systems for design, analysis,
and control of manufacturing processes, based on timely
measurements of critical quality and performance attrib-
utes of raw and in-process materials and products, to
assure high quality of products at the completion of
manufacturing (http://www.fda.gov/cder) [1]. PAT in-
cludes scientifically based process design that identifies
key measurements of product quality and the critical
process variables that affect them, appropriate measure-
ment devices, statistical information technology tools,
and feedback process control strategies that work to-
gether to ensure production of final products with the
desired quality.
Several vibrational spectroscopy techniques are used
for the application of PAT in the on-line monitoring of
the pharmaceutical process. For several years, near-in-
frared spectroscopy (NIRS) has become an analytical
technique of great interest for the pharmaceutical Indus-
try. NIR spectroscopy is a rapid, non-destructive tech-
nique and requires none or minimal sample pretreatment.
The NIR region spans the wavelength range 12,500 -
4000 cm–1.
In this region, absorption bands correspond mainly to
overtones and combinations of fundamental vibrations
[2].
In the pharmaceutical sector, several qualitative and
quantitative applications of NIR spectroscopy have been
described during manufacturing steps. In the beginning
of manufacturing process, NIR can be used for the iden-
tification of active substances and excipients [3-5]. By
recording a NIR spectrum, it has been shown that iden-
tity, crystallinity, and water content are controlled mak-
ing NIRS an interesting tool for the characterization of
raw materials. The blending step can also be followed by
NIRS [6]. It is well known that creating homogeneous
blend is one of the most important step during manufac-
turing of most of dosage forms in pharmaceutical Indus-
tries. Typically, the most time consuming part of the
blending process is not the blending itself but the analy-
sis that must be performed to validate the final homoge-
neity of the drug substance in the blend especially in low
strength preparation. In practice the relationship between
concentration and absorbance is empirically determined
by calibration. In the first step, spectra of substances with
A. B. ELDIN ET AL.
886
known composition are recorded. Then, these acquired
spectra and the data available from a reference analysis
are used to determine a calibration function. In the sec-
ond step, spectra of substances with unknown composi-
tion are measured and then used to determine the proper-
ties of interest by means of the calibration function [7,8].
Processing NIR data can be carried out in a number of
ways to simplify the spectral information. It has been
shown that data pretreatment could be a key step for
success of NIR spectroscopy [9].
The aim of the study is to show the agreement be-
tween the NIR technique and the HPLC-UV detection
assay method.
2. Experimental
2.1. Materials and Methods
2.1.1. Materials
All materials were kindly supplied by Sigma pharmaceu-
ticals Corp. - Egypt. The commercial samples of Monte-
lukast tablets were used and a placebo contains the same
raw materials used in the production process, were used.
The placebo was used to make serials of dilutions for
establishing the calibration curve. All materials are of
pharmaceutical grade and include microcrystalline cel-
lulose, magnesium stearate, Croscarmellose sodium and
Aerosil 200 are kindly supplied by Sigma pharmaceuti-
cals Corp., to be of the same type used for preparation of
Montelukast tablets.
2.1.2. Analytical Procedures
NIR Spectroscopy
FT-NIR Spectrometer MPA Flexible NIR spectrometer
from Bruker Optics (Germany) [See Figure 1], for me-
thod development and quality control.
Optional extension modules are available for connect-
ing up to 2 fiber optic probes, NIR probe for liquids
“quartz”. Pistol grip model with external trigger and
LED status lights. Includes 2 m fiber optic cable with
Bruker Quick connect. Fixed optical path length of 1 mm.
Solid Probe has a head of 80 mm length and utilizes an
integrating sphere for analysis of solid samples in diffuse
reflectance and a measurement unit for analyzing highly
scattering solid media in transmission.
The spectrometer is equipped with a fast, PC-based
data system with OPUS/IR FT-IR Spectroscopy Soft-
ware Package Version 5.0 which was provided by Bruker
Optics. OPUS IDENT is a software package designed to
identify substances by their NIR spectra while OPUS
Quant is designed for the quantitative analysis. For this
purpose, QUANT used a partial least square (PLS) fit
Figure 1. FT-NIR Spectrometer MPA flexible NIR spec-
trometer.
method. In PLS, the calibration involves correlating the
data in the spectral matrix X with the data in the concen-
tration matrix Y.
This means that the factoring of the spectral data is
more suited for concentration prediction. Construction of
the PLS model: in a first step a PLS regression model
was built using calibration samples. The obtained model
was chemometrically validated by leave-one-out cross
validation. The final PLS model was described by a se-
lected spectral region, a certain spectra pretreatment and
a number of PLS factors. To build the model, eleven
different concentrations of tablets were prepared and 5
samples were measured per concentration. To obtain
these different concentrations, raw materials and placebo
are used and samples were prepared on Lab. scale. Each
spectrum was the average of 32 scans and the spectro-
photometer was operated at a resolution of 8 cm–1.
Spectral data pretreatments: NIR spectra are affected
by the state of the analyzed material. The baseline can
drift and maximum absorbance may change. Spectral
pretreatments correct these interferences [10,11]. In our
study, a normalisation and a first derivative were used to
enhance spectral information and to reduce baseline drift.
The normalisation method used was a vector normalisa-
tion. The absorbance of the Montelukast tablets samples
was measured and NIR spectrums were saved. Meas-
urements were performed by the NIR fiber optic probe
for solids. Before measurement a measurement for the
background must be taken and the detector single shall
be checked. In developing method the measurement con-
ditions shall be determined and saved to be recalled in
each measurement time to avoid result variation and en-
sure high accuracy of the developed analytical procedure.
Samples were measured in amber colored glass samples
and minimum illumination in the measurement place
were kept to ensure that there was no stray light during
measurement
The measurement time for each sample was about 10
Copyright © 2011 SciRes. AJAC
A. B. ELDIN ET AL.
Copyright © 2011 SciRes. AJAC
887
tration ranges of about 50, 100, 150, 200, 250 and 300
µg/ml, each concentration level was injected 3 times (n =
3) and the average peak area was calculated. The result-
ing curve was found to be linear with correlation coeffi-
cients of better than 0.999 in most cases (Table 1). Fur-
thermore, Table 1 lists the linearity parameters of the
calibration curves for Montelukast in pure and drug-ma-
trix solutions.
seconds per scan and the instrument was operated at a
resolution of 8 cm–1 between 4000 and 12,000 cm–1. In
first trials five scans for each sample were taken and a
mean spectrum for them was calculated but it was found
that no difference between the mean spectrum and the
single one that is due to the complete homogeneity of the
measured sample.
2.1.3. Reference Method
3.1.2. Sensitivity and accuracy Simple, sensitive and accurate stability indicating ana-
lytical method for Montelukast has been used by using
RP-HPLC techniques and applying the proposed method
in the assay of Montelukast pure material, tablets and
the brand product (sigulair®), since there is no official
monograph. Chromatography was performed with mo-
bile phase containing a mixture of acetonitrile and 0.01M
potassium dihydrogen phosphate buffer, pH 4.0 (7:3, v/v)
with flow rate of 1.0 ml per min., C18 column and UV
detection at 355 nm. developed method satisfies the sys-
tem suitability criteria, peak integrity, and resolution for
the parent drug and its degradants. The method was
validated for linearity (correlation coefficient = 0.9999),
accuracy, robustness and precision.
The limits of detection LOD and limits of quantitation,
LOQ, were calculated for the calibration graphs of Mon-
telukast as three and ten times of the noise level for LOD
and LOQ, respectively [USP-32; 2009]. The values for
LOD and LQD are given in Table 1. The accuracy of an
analytical method is the closeness of test results obtained
by that method to the true value [USP-32; 2009]. The
accuracy of the method was tested by analyzing different
samples of Montelukast at various concentration levels
ranged from 150 - 250 µg/ml in either pure solutions or
in solutions comprising the drug-matrix used in tablet
formulation, each concentration level was injected 3 times
(n = 3) and the average peak area was calculated. The
results were expressed as percent recoveries of the Mon-
telukast in the samples (Table 2). Table 2 shows that the
overall percent recoveries of Montelukast in pure and
drug-matrix solutions were 100.11%, relative standard
3. Results and Discussions
3.1. Methods Validation
Figure 2 shows the raw spectra obtained with the cali-
bration samples.
A vector normalization was applied to these spectra.
From these spectra, three regions were selected, auto-
matically by the Quant program; it was between 11,250
and 8500 cm–1.
All samples were also analyzed by the HPLC method.
The following validation items were applied for the ref-
erence HPLC method.
3.1.1. Linearity
The linearity of calibration curves (peak area vs. concen-
tration) for Montelukast in pure solutions as well as in
the drug-matrix solutions were checked over the concen- Figure 2. The FT-NIR spectrum for Montelukast tablets.
Table 1. Linearity of calibration curve for Montelukast in standard preparations and in drug-matrix preparation. Number of
points in the regression line is 6 for each case.
Item Calibration
range (mcg/ml)
Correlation
coefficient Slope
Slope 95%
confidence interval
for the slopea
Intercept
Slope 95%
confidence interval
or the intercepta
LOD
mcg/ml
LOQ
mcg / ml
Montelukast in
standard preparation 50 - 300 0.9999 0.690±0.0110 –0.125±1.985 5.51 9.36
Montelukast in
drug-matrix preparation 50 - 300 0.9999 0.685±0.0180 1.023 ±2.987 6.24 15.42
Confidence intervals of the slope and the intercept = (S.D of the slope or intercept x t), the value of t at 3 degree of freedom and 95% confidence level is 3.18.
A. B. ELDIN ET AL.
Copyright © 2011 SciRes. AJAC
888
deviation (R.S.D.) = 0.35% and 99.9% (R.S.D.) = 5.27%,
respectively.
3.1.3. Stability of Analytical Solutions
Sample solutions of Montelukast in pure and drug-matrix
solutions were tested for HPLC stability over 24 h. The
samples were analyzed by the optimized HPLC method
in fresh and stored solutions. The percent difference ob-
served was in the range of –0.31 to –0.76 (Table 3), in-
dicating the possibility of using standard solutions of
Montelukast in pure or drug-matrix solutions over a pe-
riod of 24 h without degradation.
3.1.4. Precision
As stated in the ICH [12] and FDA [13] guidelines, the
precision of an analytical procedure expresses the close-
ness of agreement (degree of scatter) between a series of
measurements obtained from multiple samplings of the
same homogeneous sample under prescribed conditions.
In this study precision was evaluated through repeatabil-
ity and reproducibility.
Various samples containing about 200 mcg/ml Mon-
telukast in a synthetic matrix (drug-matrix) were ana-
lyzed by three independent analysts (six samples each)
over 1 day and various days.
The 1 day repeatability gave the overall percent re-
coveries of 100.1%, 101.2% and 99.9% with %R.S.D. of
1.2, 0.62 and 0.26, respectively. The long-term repro-
ducibility for all the analysis gave an over all recovery
and R.S.D. of 100.4% and 0.96%, respectively.
3.1.5. Robustness
As defined by the ICH, the robustness of an analytical
procedure refers to its capability to remain unaffected by
small and deliberate variations in method parameters
[14,15]. In order to study the simultaneous variation of
Table 2. Estimation of the accuracy as an item for validation of the proposed HPLC method for the determination of Mon-
telukast in standard or drug matrix solution.
Standard solutions Drug-matrix solutions
Quantity added in mcg/ml of Montelukast
Quantity found in mcg/ml Recovery (%)Quantity found in mcg/ml Recovery (%)
150.2 150.4 100.1332 151.2 152.1
161.3 160.9 99.75201 165.7 164.8
172.4 173 100.348 175.4 173.9
182.3 183.1 100.4388 184.1 184
193.7 192.9 99.58699 195.1 194.4
203.1 202.7 99.80305 205.1 204.4
221.2 222.2 100.4521 219.8 220.2
253.4 254.4 100.3946 250.7 252.2
Average 100.11% Average 99.90%
Calculations:
% R.S.D 0.350% % R.S.D 0.527%
Table 3. Stability of Montelukast in standard and drug-matrix solutions over a period of 24 ha.
Quantity found
Sample Quantity added in mcg/ml of Montelukast
Fresh solution Stored solution
Difference (%)
100.18 100.19 100.21 –0.14
201.89 200.95 200.9 0.16
Standard solution
of Montelukast.
302.76 301.5 301.55 –0.07
100.18 99.8 100.13 0.49
201.89 200.87 200.53 1.07
Standard solution
of Montelukast in
the drug-matrix. 302.76 301.65 300.49 0.22
aDifference (%) = (Quantity found in fresh solution – Quantity found in stored solution)/(Quantity found in fresh solution) × 100.
A. B. ELDIN ET AL.
Copyright © 2011 SciRes. AJAC
889
the factors on the considered responses, a multivariate
approach using design of experiments is recommended in
robustness testing. A response surface method was car-
ried out to obtain more information and to investigate the
behavior of the response around the nominal values of
the factors. Response surface methodology (RSM) has
the following advantages: (a) to allow a complete study
where all interaction effects are estimated; (b) to give an
accurate description of an experimental region around a
center of interest with validity of interpolation [15].
Generally the large numbers of experiments required by
standard designs applied in RSM discourage their use in
the validation procedure. However, if an analytical
method is fast and requires the testing of a few factors
(three or less), a good choice for robustness testing may
be the central composite design (CCD), widely employed
because of its high efficiency with respect to the number
of runs required. A CCD in k factors requires 2 k facto-
rial runs, 2 k axial experiments, symmetrically spaced at
α ± along each variable axis, and at least one center point
[17]. Two to five center repetitions are generally carried
out in order to know the experimental error variance and
to test the predictive validity of the model [18]. In order
to study the variables at no more than three levels (1, 0,
+1), the design used in robustness testing of montilukast
was a central composite design (CCD) with α = ±1.
Three factors were considered: percentage v/v of ace-
tonitrile (x1); flow rate ml·min1 (x2) and pH (x3). The
experimental domain of the selected variables is reported
in Table 4. The ranges examined were small deviations
from the method settings and the corresponding re-
sponses in the peak area considered (Y) were observed.
A three-factor CCD requires 9 experiments, including
two replicates of the center point. The experimental plan
and the corresponding responses are reported in Table 4.
All experiments were performed in randomized order to
minimize the effects of uncontrolled factors that may
introduce a bias on the response. A classical second-
degree model with a cubic experimental domain was
postulated. Experimental results were computed by
Minitab-15. The coefficients of the second-order poly-
nomial model were estimated by the least squares regres-
sion. The regression equation was as follow:
AUC = 127933 + 221 AcN% – 27628 F.R – 555 pH
The factor flow rate (x2) was significant for the re-
gression model assumed.
The model was validated by the analysis of variance
(ANOVA). The statistical analysis showed (Table 5) that
the model represents the phenomenon quite well and the
variation of the response was correctly related to the
variation of the factors, Figure 3 shows the influence of
each of the variables studied in the montelukast as a re-
sponse where none of them exceeds the limit except the
Table 4. Experimental domain of the selected variables.
Exp. No. AcN % F.R pH AUC
1 63 0.8 3.5 119297
2 77 0.8 3.5 120962
3 63 1.2 3.5 108200
4 77 1.2 3.5 102096
5 63 0.8 4.5 118187
6 77 0.8 4.5 118742
7 63 1.2 4.5 103206
8 77 1.2 4.5 106535
9 63 0.8 4 105980
10 77 1.2 4 110974
11 70 1 4 108200
12 70 1 4 117078
13 70 1 3.5 118742
14 70 1 4.5 119852
15 70 1 4 119852
16 70 1 4 119297
Table 5. Analysis of variance for the experimental plan and
the corresponding responses.
Source DFSS MS F P
Regression 3 295839577 98613192 2.950.076
Residual 4 401025227 33418769
Total 7 696864804
Figure 3. The resulting chromatogram for montelukast.
flow rate as clear. The interpretation of the results has to
start from the analysis of the whole model equation
rather than from the analysis of the single coefficients. It
is important for the response surface study, to consider
also the factors whose coefficients are statistically non
A. B. ELDIN ET AL.
890
significant. For this reason the analysis of the response
surface plot is necessary. As shown in Figure 3 the analy-
sis produces three-dimensional graphs by plotting the
response model against two of the factors, while the third
is held constant at a specified level, usually the proposed
optimum. Figure 4 shows a graphical representation of
the isoresponse surface for variation of percentage of
(a)
(b)
(c)
Figure 4. Three-dimensional plot of the response surface for
Y (found drug peak area ratio). (a) Variation of the re-
sponse Y as a function of x1 (% acetonitrile) and x2 (flow
rate); fixed factor: x3 (pH) = 3.0; (b) Variation of the re-
sponse Y as a function of x1 (% Acetonitrile) and x3 (pH)
fixed factor: x2 (flow rate) = 1.0 ml·min1; (c) Variation of
the response Y as a function of x2 (flow rate) and x3 (pH);
fixed factor: x1 (% acetonitrile) = 50% v/v.
ACN (x1) and flow rate (x2), while the pH (x3) is main-
tained constant at its optimum of 4.0. An increase in the
flow rate results in a decrease of the observed peak area
ratio (Y), while the percentage of organic modifier had
no important effect on the response. Analogous interpret-
tation may be derived by examining the factors flow rate
(x2) versus pH (x3), where the factor flow rate is main-
tained constant and the method can be considered robust
for the studied experimental response. In conclusion, by
examining the ANOVA results and analysis of response
surface confirms that Y is not robust for factor x2, thus a
precautionary statement should be included in the ana-
lytical procedure for this factor.
3.1.6. Predictability
To evaluate the predictability of the model, the relative
standard error of prediction (RSEP) was used [16].
 
1
1
%
n
HPLC NIR
i
n
HPLC
i
CC
RSEP C
where C is the amount of Montelukast as measured by
the HPLC reference method and the NIR method and n is
the number of samples.
The chosen model has a RMSECV value of 1.76%.
This regression model gave a coefficient of correlation
(r2) of 99.48.
This regression, which indicate the relation between
the predicted and true values is shown in Figure 5.
3.1.4. Agreement between the Two Methods for
Unknown Samples
According to Bland and Altman’s method, the first step
is to examine the data. A simple plot of the results given
by a method versus those of the other one is a useful start.
However, the data points will usually be clustered near
the line and it will be difficult to assess between method
differences so that a plot of the difference between the
methods against their mean is chosen. This plot of data
may be more informative. Figure 6 shows the distribu-
Figure 5. Regression of the calibration samples.
Copyright © 2011 SciRes. AJAC
A. B. ELDIN ET AL.
Copyright © 2011 SciRes. AJAC
891
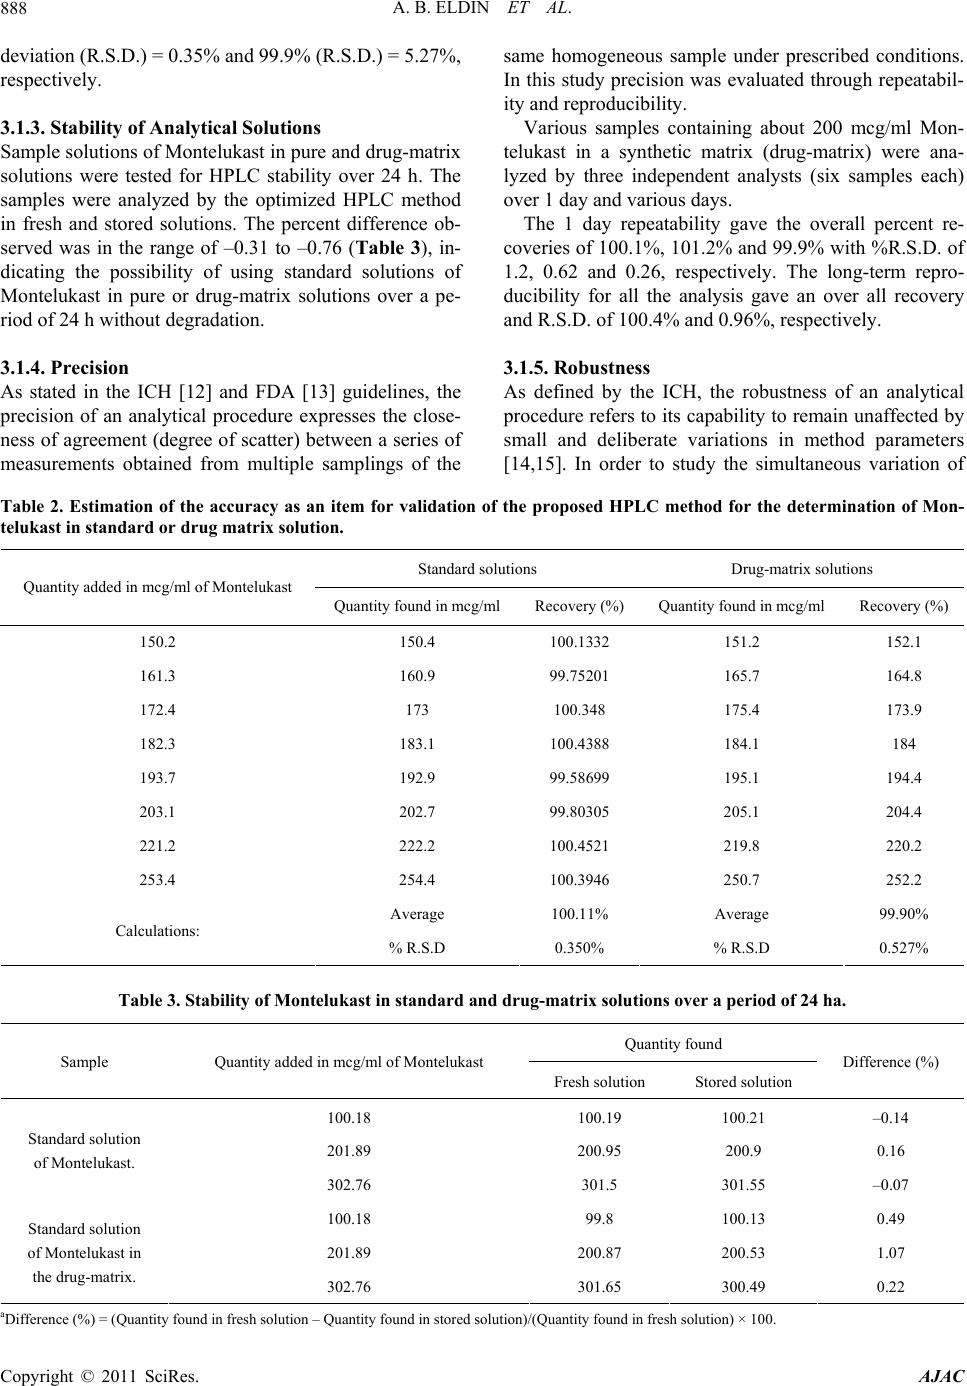
Difference vs True / Montelukast % / Cross Validation
-0.8
-0.6
-0.4
-0.2
0
0.2
0.4
0.6
0.8
051015202530
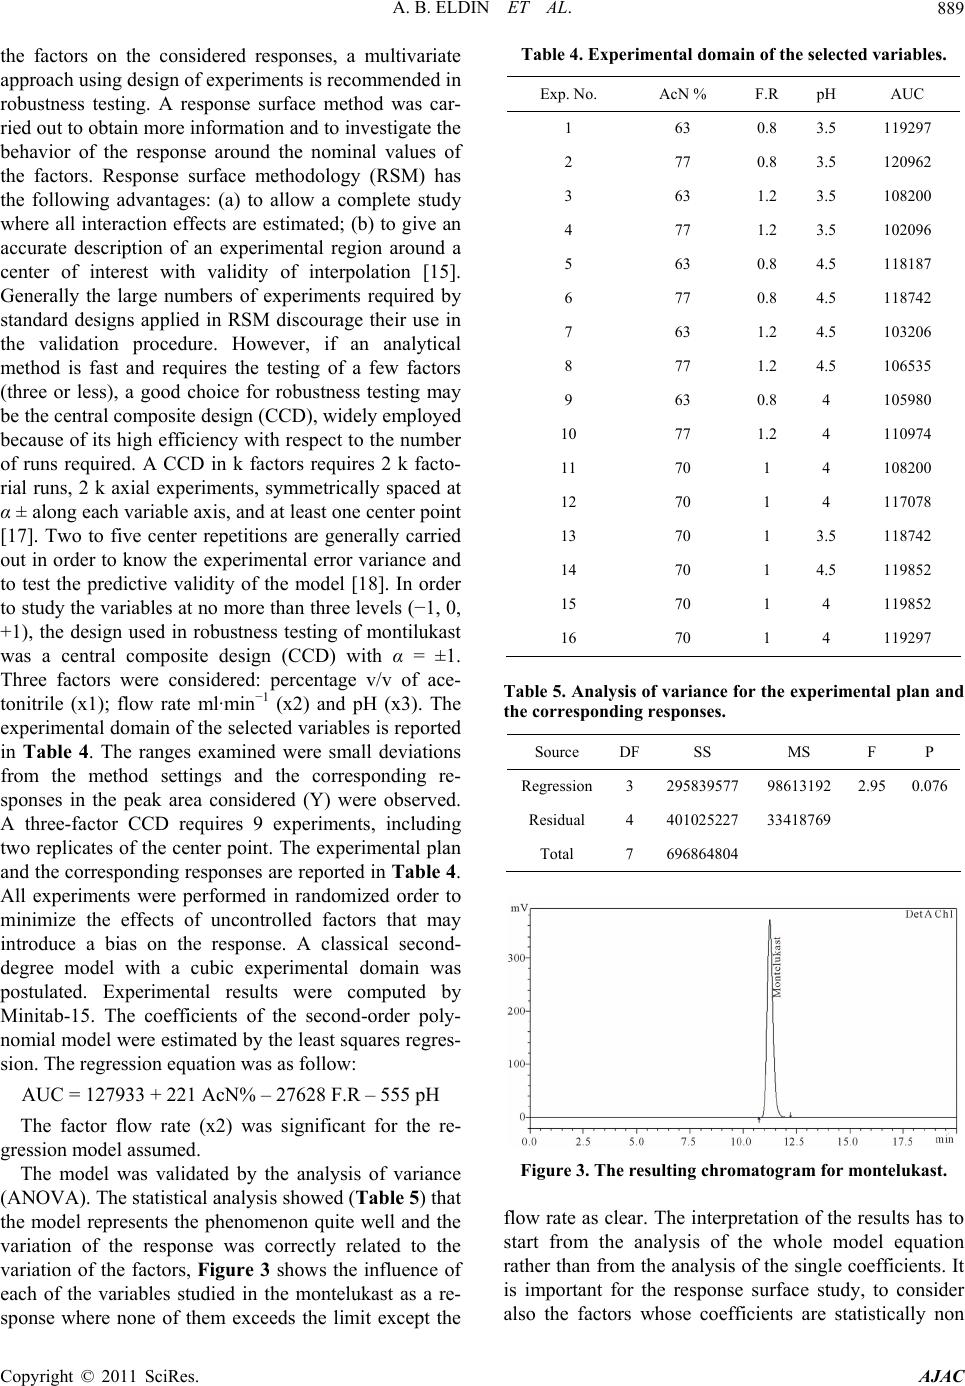
Figure 6. Distribution of the differences against their mean.
tion of the differences against their mean.
4. Conclusions
NIR spectroscopy has been shown to be a viable alterna-
tive to HPLC with UV detection for the assay of Monte-
lukast tablets, and it takes only few minutes to analyse a
batch once the calibration model has been set up. The
proposed model is easy to use and give accurate results.
It is a non-destructive method and thus lends itself very
well for on-line/at-line production control purposes.
Compared to the conventional technique, the NIR
spectroscopy method is faster, non-destructive, and gives
less variability. It has been shown that NIRspectroscopy
can replace safely the UV-vis spectrophotometry.
5. Acknowledgements
The authors thank Sigma Pharmaceutical Corp., Egypt
for technical support.
6. References
[1] FDA, “PAT—A Framework for Innovative Pharmaceu-
tical Manufacturing and Quality Assurance,” 2004.
http://fda.gov/cder
[2] E. W. Ciurczak and J. K. Drennen, “Practical Spectros-
copy Series: Pharmaceutical d Medical Applications of
Near-Infrared Spectroscopy,” Marcel Dekker, New York,
2002.
[3] W. Plugge and C. Van der Vlies, “The Use of Near In-
frared Spectroscopy in the Quality Control Laboratory of
the Pharmaceutical Industry,” Journal of Pharmaceutical
and Biomedical Analysis, Vol. 10, No. 10-12, 1992, pp.
797-803. doi:10.1016/0731-7085(91)80083-L
[4] C. I. Gerh¨ausser and K. A. Kovar, “Strategies for
Constructing Near-Infrared Spectral Libraries for the
Identification of Drug Substances,” Applied Spectroscopy,
Vol. 51, No. 10, 1997, pp. 1504-1510.
doi:10.1366/0003702971939000
[5] M. J. Vredenbregt, P. W. J. Caspers, R. Hoogerbrugge
and D. M. Barends, “Choice and Validation of a Near
Infrared Spectroscopic Application for the Identity
Control of Starting Materials.: Practical Experience with
the EU Draft Note for Guidance on the Use of Near
Infrared Spectroscopy by the Pharmaceutical Industry
and the Data to be Forwarded in Part II of the Dossier for
a Marketing Authorization,” European Journal of
Pharmaceutics and Biopharmaceutics, Vol. 56, No. 3,
2003, pp. 489-499. doi:10.1016/S0939-6411(03)00119-X
[6] S. S. Sekulic, H. W. Ward and P. K. Aldridge, “On-Line
Monitoring of Powder Blend Homogeneity by Near-In-
frared Spectroscopy,” Analytical Chemistry, Vol. 68, No.
3, 1996, pp. 509-513. doi:10.1021/ac950964m
[7] P. Merckle and K.-A. Kovar, “Assay of Effervescent
Tablets by Near-Infrared Spectroscopy in Transmittance
and Reflectance Mode: Acetylsalicylic Acid in Mono and
Combination Formulations,” Journal of Pharmaceutical
and Biomedical Analysis, Vol. 17, No. 3, 1998, pp. 365-
374. doi:10.1016/S0731-7085(97)00194-5
[8] R. P. Cogdill, C. A. Anderson and J. K. Drennen, Phar-
maceutical Technology, 2004, pp. 29-34.
[9] J. Sun, Journal of Chemometrics, Vol. 11, 1997, pp.
525-532.
[10] R. J. Barnes, M. S. Dhanoa and S. J. Lister, “Standard
Normal Variate Transformation and De-trending of Near-
Infrared Diffuse Reflectance Spectra,” Applied Spectros-
copy, Vol. 43, No. 5, 1989, pp. 772-777.
doi:10.1366/0003702894202201
[11] T. Fearn, NIR News, Vol. 10, 1999, pp. 10-11.
[12] ICH Q2B, International Conference on Harmonisation,
Validation of Analytical Procedures, Methodology, 2002.
[13] FDA, “Guidance for Industry: Validation of Analytical
Procedures,” Food and Drug Administration, Rockville,
1997.
[14] International Conference on Harmonisation Topic Q2B,
“Validation of Analytical Methods: Methodology,” The
Third International Conference on Harmonization of
Technical Requirements for Registration of Pharmaceu-
ticals for Human Use (ICH) Yokohama-Japan.
[15] Y. V. Heyden, A. Nijhuis, J. Smeyers-Verbeke and B. G.
M. Vandeginste D. L., Journal of Pharmaceutical and
Biomedical Analysis, 2001, p. 24723.
[16] A. Eustaquio, P. Graham, R. D. Jee, A. C. Moffat and A.
D. Trafford, “Quantification of Paracetamol in Intact
Tablets Using Near-Infrared Transmittance Spectros-
copy,” Analyst, Vol. 123, No. 11, 1998, pp. 2303-2306.
doi:10.1039/a804528c
[17] R. Ragonese, M. Mulholland and J. Kalman, “Full and
Fractionated Experimental Designs for Robustness Test-
ing in the High-Performance Liquid Chromatographic
Analysis of Codeine Phosphate, Pseudoephedrine Hy-
drochloride and Chlorpheniramine Maleate in a Pharma-
ceutical Preparation,” Journal of Chromatography A, Vol.
870, No. 1-2, 2000, p. 45.
doi:10.1016/S0021-9673(99)00972-3
[18] G. A. Lewis, D. Mathieu and R. Phan-Tan-Luu, “Phar-
maceutical Experimental Design,” Marcel Dekker, New
York, 1999.