 American Journal of Plant Sciences, 2011, 2, 753-764 doi:10.4236/ajps.2011.26090 Published Online December 2011 (http://www.SciRP.org/journal/ajps) Copyright © 2011 SciRes. AJPS 753 Assessing Genetic Structure and Relatedness of Jerusalem Artichoke (Helianthus tuberosus L.) Germplasm with RAPD, ISSR and SRAP Markers Preeya Puangs omlee W a ngsomn u k1*, Sudarat Khampa1, Sanun Jogloy2, Trin Srivong1, Aran Patanothai2, Yong-Bi Fu3* 1Department of Biology, Faculty of Science, Khon Kaen University, Khon Kaen, Thailand; 2Department of Plant Science and Agri- cultural Resources, Faculty of Agriculture, Khon Kaen University, Khon Kaen, Thailand; 3Plant Gene Resources of Canada, Saska- toon Research Centre, Agriculture and Agri-Food Canada, Saskatoon, Canada. Email: *prepua@kku.ac.th, *yong-bi.fu@agr.gc.ca Received September 8th, 2011; revised October 7th, 2011; accepted October 21st, 2011. ABSTRACT Jerusalem artichoke (Helianthus tuberosus L.) is an old tuber crop with a recently renewed interest in multipurpose improvement, but little effort has been made to characterize its genetic resources. A study was conducted to assess ge- netic structure and genetic relatedness of 47 diverse Jerusalem artichoke accessions using RAPD, ISSR and SRAP markers. A total of 296 (87.1%) polymorphic bands were detected from 13 RAPD markers; 92 (80%) from six ISSR primers; and 194 (88.6%) for nine combinations of SRAP primers. Five optimal clusters were inferred by the STRUC- TURE program from the RAPD or ISSR data, while six optimal clusters were found from the SRAP data or combined marker data. Significant linear relationships between the distance matrices for all pairs of individual accessions were detected for all marker pairs and the estimated correlation coefficient was 0.40 for RAPD-ISSR, 0.53 for RAPD-SRAP, and 0.43 for ISSR-SRAP. Based on the combined data, the neighbor-joining clustering of the 47 accessions matched closely with those inferred from the STRUCTURE program. Three ancestral groups were observed for the Canadian germplasm. Most diverse germplasm harbored in the USA collection. These findings not only reveal the compatible patterns of genetic structure and relatedness inferred with three marker types, but also are useful for managing Jerusa- lem artichoke germplasm and utilizing diverse germplasm for genetic improvement. Keywords: Jerusalem Artichoke, Genetic Structure, Germplasm Management, RAPD, ISSR, SRAP 1. Introduction Recent years have seen an increased characterization effort directed toward the assessments of genetic structure and genetic relatedness in plant germplasm [1-3]. These as- sessments can not only facilitate the conservation and management of many plant germplasm collections, but also enhance the utilization of existing germplasm diver- sity in plant breeding [4]. The assessed genetic related- ness is critical for selection of diverse parents from less explored plant germplasm and for design of experimental crosses to widen the breeding gene pool [5]. The inferred genetic structure is essential to capture functional genetic diversity by setting up core subsets of germplasm [6] and association mapping of genes controlling complex traits [7]. However, the marker-based assessments of genetic structure and relatedness can vary, depending on the nature of molecular markers used, as different markers may sam- ple a plant genome in different ways [8]. The variation could be substantial for a genetically heterogeneous plant with highly outcrossing and variable ploidy. Thus, an adequate attention should be paid to the performance of different molecular markers in assessments of genetic structure and relatedness [2,8]. Jerusalem artichoke (He- lianthus tuberosus L.) has been cultivated mainly for tu- bers since the 17th century [9]. Its inulin-containing tu- bers are consumed as vegetable and can be used as raw material to produce various value-added products such as healthy food products, animal additive feed [10] and bio- ethanol [11]. The crop has been largely abandoned after the Second World War [12], but recently it has received a renewed interest in genetic improvement for multiple purposes [9]. Also, Jerusalem artichoke is a cold-hardy North American wild relative of the cultivated sunflower  Assessing Genetic Structure and Relatedness of Jerusalem Artichoke (Helianthus tuberosus L.) Germplasm 754 with RAPD, ISSR and SRAP Markers (H. annuus L.) and will play an increasing role in the genetic improvement of economically important traits in sunflower such as oil characters and disease resistance [13,14]. However, insufficient effort has been made to characterize and conserve Jerusalem artichoke genetic resources, in contrast to sunflower germplasm [15]. Currently, only several hundred Jerusalem artichoke accessions are maintained in plant germplasm collections worldwide [9,16,17]. These accessions represent germ- plasm only from a dozen or so countries and include wild and weedy accessions, landraces, or traditional and ob- solete cultivars, and advanced or improved cultivars. Some efforts have been made to characterize existing Je- rusalem artichoke germplasm [12,18-20]. However, these characterizations were mainly focused on phenotypic and genotypic data and would be more informative with sup- plementary applications of informative molecular mark- ers. Many molecular markers have been developed for plant genetic research over the recent decades [4,21]. The random amplified polymorphism DNA (RAPD) [22] and inter simple sequence repeats (ISSR) [23] were among the earliest developed molecular tools used to assess plant genetic diversity due to technical simplicity and practical feasibility. For example, the RAPD and ISSR markers require no prior sequence information for the survey of plant genomes, but generally suffer from low resolution due to various issues associated with repro- ducibility, dominance and non-homologous DNA frag- ment [8], of which issues are similar to other dominant markers [24]. The sequence-related amplified polymor- phism (SRAP) [25] represents another simple and re- liable PCR-based marker tool for genetic diversity ana- lysis [26,27]. However, these molecular markers have rarely been applied to assess genetic variation of Jerusa- lem artichoke [28-30]. A study was conducted to assess the genetic structure and genetic relatedness of 47 di- verse Jerusalem artichoke accessions using RAPD, ISSR and SRAP markers and to compare the congruency of the structural and relatedness assessments. It was our hope that this study can provide a useful set of diversity in- formation not only for genetic improvement of Jerusalem artichoke, but also for understanding to what extent the different classes of molecular markers provide concor- dant information about the structure of populations and the relationships among individuals. 2. Materials and Methods 2.1. Plan t Ma teria l Forty-seven Jerusalem artichoke accessions were used for this study (Ta ble 1). The studied germplasm was ob- tained from Plant Gene Resources of Canada (PGRC), Saskatoon, Canada and originated from Canada, USA, France, and the former Union of Soviet Socialist Repub- lics (USSR). It also included six accessions collected directly from the wild populations in Texas, USA. 2.2. DNA Extraction Young leaf tissue was collected from at least three indi- vidual plants of one accession and bulked for DNA ex- traction following the Tai and Tanksley’s modified me- thod [31], which was shown to be the most effective DNA extraction method for Jerusalem artichoke [32]. The bulked tissue (300 mg) was ground with a homoge- nizer and 0.7 ml of extraction buffer (100 mM Tris-HCl; pH 8, 50 mM EDTA pH 8, 0.5 M NaCl, 1.25% SDS, 8.3 mM NaOH, 0.38% Na bisulfite) was added and mixed by vortexing. The sample was incubated at 65˚C for 20 min and 0.22 ml of 5 M potassium acetate added and mixed well. The tube was placed on ice for 40 min, followed by centrifugation for 3 min. The supernatant was transferred to the new tube. The DNA was precipitated by adding 0.7 volume of isopopanol, mixed well and centrifuged for 3 min. The supernatant was poured off and the pellet rinsed with 70% ethanol. The pellet was re-suspended in 300 µl of T5E (50 mM Tris-HCl pH 8, 10 mM EDTA) by briefly vortexing, and incubated at 65˚C for 5 min, followed by vortexing again. 150 µl of 7.4 M ammonium acetate were added and mixed well before centrifugation for 3 min and removal of the supernatant to the new tube. The DNA was precipitated by mixing with 330 µl of iso- propanol and centrifuged for 3 min. The pellet was rin- sed with 70% ethanol and re-suspended in 100 µl of T5E, incubated at 65˚C for 5 min, and then vortexing. The DNA was re-suspended in 150 µL of TE (10 mM Tris- HCl, pH 8.0, 1 mM EDTA). The purity and quality of genomic DNA were assessed after digested with RNaseA (Sigma), and quantified on 1% agarose gel against know concentration of 100 bp DNA ladder plus (Vivantis). The extracted genomic DNAs were stored at –20˚C until fur- ther use. 2.3. RAPD Analysis Thirty-one decamer primers (Operon Technologies, Ala- meda, CA) were initially screened using two sets of bul- ked DNAs of Jerusalem artichoke to determine the suit- ability of each primer for the study. The first bulk con- sisted of 34 accessions (JA29, JA30, JA31, JA32, JA34, JA35, JA36, JA42, JA43, JA44, JA45, JA46, JA47, JA48, JA49, JA50, JA54, JA55, JA58, JA59, JA60, JA61, JA66, JA69, JA70, JA71, JA72, JA73, JA74, JA78, JA87, JA88, JA91, JA92) and the second bulk included 11 accessions (JA95, JA97, JA98, JA100, JA105, JA106, JA107, JA108, JA109, JA110, JA111). Based on their ability to Copyright © 2011 SciRes. AJPS  Assessing Genetic Structure and Relatedness of Jerusalem Artichoke (Helianthus tuberosus L.) Germplasm with RAPD, ISSR and SRAP Markers Copyright © 2011 SciRes. AJPS 755 Table 1. List of 47 Jerusalem artichoke accessions studied, along with some description, country origin and the cluster in- ferred with the STRUCTURE program. Acc Description Origin StCAcc Description Origin StC JA27 DHM-7 Canada 6 JA66 FR. MAMMOTH WHITE USA 5|1 JA28 DHM-13 Canada 6 JA69 TUB-364 USDA-ARS-SR USA, Taxas 3 JA29 DHM-14 Canada 6 JA70 TUB-365 USDA-ARS-SR USA, Taxas 3 JA30 DHM-16 Canada 6 JA71 TUB-675 USDA-ARS-SR USA, Taxas 3 JA31 DHM-18 Canada 6 JA72 TUB-676 USDA-ARS-SR USA, Taxas 1 JA32 DHM-19 Canada 6 JA73 TUB-709 USDA-ARS-SR USA, Taxas 2 JA34 DHM-22 Canada 6 JA74 TUB-847 USDA-ARS-SR USA, Taxas 2 JA35 W-97 Canada 6 JA78 FUSEA U 60 France 3 JA36 W-106 Canada 6 JA87 242-63 France 1 JA42 75005 Canada 6 JA88 TOPINSOL 63 USSR 1 JA43 75004-52 Canada 6 JA91 KIEVSKII USSR 1 JA44 A-3-6 Canada 6 JA92 INDUSTRIE USSR 5|1 JA45 HM hybrid-A-4 Canada 2 JA95 NACHODKA USSR 1 JA46 DHM-14-3 Canada 6 JA97 D19-63340 France 5 JA47 DHM-14-6 Canada 2 JA98 242-62 France 1 JA48 DHM-15 Canada 6 JA100 105-62G2 France 1 JA49 7513A Canada 2|6 JA105 357303 VOLGA 2 USSR 1 JA50 W-97 Canada 1 JA106 83-001-1 (37 × 6) Canada 5 JA54 Unknown USA 2 JA107 83-001-2 (37 × 6) Canada 5 JA55 Unknown USA 2 JA108 83-001-3 (37 × 6) Canada 5 JA58 Intress USSR 3 JA109 83-001-4 (37 × 6) Canada 5 JA59 VOLZSKIJ-2 USSR 3 JA110 83-001-5 (37 × 6) Canada 5 JA60 Jamcovskij Krashyj USSR 4 JA111 83-001-6 (37 × 6) Canada 1 JA61 VADIM USSR 4 Acc = accession and label following those described in [9]. USSR = the former Union of Soviet Socialist Republics. Six accessions from Texas, USA, were collected from wild populations. StC = the most likely cluster inferred with STRUCTURE based on the combined marker data; the accession with two clusters means that the ancestry levels for both clusters were less than 0.5, but the first cluster had the larger ancestry than the other cluster. detect distinct, clearly resolved, and reproducible ampli- fied products in the initial screening, 13 most informative primers (Table 2) were selected for further analysis. The polymerase chain reaction (PCR) was run in final volume of 50 ng DNA template, 0.4 U Taq DNA poly- merase (Vivantis), 1.0 µl 10x buffer (750 mM NH4(SO2)4, 0.1% Tween 20, Fermantas), 1.5 mM MgCl2 (Fermantas), 0.2 mM dNTPs (Vivantis), 1.0 µM RAPD primer in 0.20 ml PCR tube. The amplification was performed in a ther- mocycler called “CG1-96” (Corbett Research, Germany). The amplification regime consisted of 95˚C for 2 min; then 45 cycles at 94˚C for 30 s, annealing temperature 40˚C (36˚C for OPS04) for 30 s, and 72˚C for 90 s; and a final extension at 72˚C for 5 min. The RAPD amplification products were analyzed by electrophoresis on 1.2% agarose gels, run in 1× TBE, visualized under UV transilluminator, and photographed. The PCR reactions were done three times independently. Only repeatable amplified DNA fragments were manu- ally scored as 1 or 0 for presence or absence, respectively, for each sample. 2.4. ISSR Analysis A total of 25 primers were initially screened using two sets of bulked DNAs described above to determine the suitability of each primer for the study. Based on their ability to detect distinct, clearly resolved, and reproduci- ble amplified products from the initial screening, six most informative primers (Table 2) were selected for further analysis. The polymerase chain reaction (PCR) was run in final volume of 50 ng DNA template, 0.4 U Taq DNA polymerase (Vivantis), 1.0 µl 10× buffer (750 mM NH4(SO 2)4, 0.1% Tween 20; Fermantas) 1.5 mM MgCl2 (Fermantas), 0.2 mM dNTPs (Vivantis), 1.0 µM  Assessing Genetic Structure and Relatedness of Jerusalem Artichoke (Helianthus tuberosus L.) Germplasm 756 with RAPD, ISSR and SRAP Markers Table 2. List of 13 RAPD, 6 ISSR and 9 SRAP markers used and polymorphism detected in the 47 Jerusale m artichoke ac- cessions. Primer Sequence (5' - 3') Total No. of bands Polymorphic bands (%) Entropy-based diversity content RAPD OPA02 TGCCGAGCTG 28 85.7 5.61 OPA10 GTGATCGCAG 25 88.0 5.56 OPA20 GTTGCGATCC 25 84.0 5.69 OPE01 CCCAAGGTCC 29 82.8 5.92 OPE02 GGTGCGGGAA 31 90.3 7.65 OPE08 TCACCACGGT 22 95.5 4.64 OPE09 CTTCACCCGA 20 90.0 3.87 OPS01 CTACTGCGCT 20 90.0 3.89 OPS02 CCTCTGACTG 33 90.9 8.67 OPS04 CACCCCCTTG 28 64.3 4.23 OPS06 GATACCTCGG 26 96.2 6.10 OPS12 CTGGGTGAGT 32 84.4 7.03 OPS15 CAGTTCACGG 21 95.2 4.95 Total/Mean 340 87.1 5.68 ISSR P03 HVHTCCTCCTCCTCCTCC 19 78.9 4.25 P06 CACACACACACACACART 16 68.8 1.92 P07 TGTGTGTGTGTGTGTGRT 6 50.0 0.70 P18 CACACACACACACACAG 27 85.2 5.92 P40 GAGAGAGAGAGAGAGAGAYT 21 71.4 4.24 P76 GATAGATAGACAGACA 26 96.2 6.75 Total/Mean 115 80.0 3.97 SRAP ME2/EM5 ME2: TGAGTCCAAACCGGAGC 19 100.0 4.55 EM5: GACTGCGTACGAATTCAA ME2/EM6 ME2: TGAGTCCAAACCGGAGC 37 97.3 9.08 EM6: GACTGCGTACGAATTCCA ME2/EM8 ME2: TGAGTCCAAACCGGAGC 20 90.0 3.33 EM8: GACTGCGTACGAATTCAC ME5/EM5 ME5: TGAGTCCAAACCGGAAG 24 79.2 4.23 EM5: GACTGCGTACGAATTCAA ME5/EM6 ME5: TGAGTCCAAACCGGAAG 20 80.0 2.51 EM6: GACTGCGTACGAATTCCA ME5/EM8 ME5: TGAGTCCAAACCGGAAG 33 93.9 7.85 EM8: GACTGCGTACGAATTCAC ME7/EM5 ME7: TGAGTCCTTTCCGGTCC 12 83.3 3.37 EM5: GACTGCGTACGAATTCAA ME7/EM6 ME7: TGAGTCCTTTCCGGTCC 26 69.2 4.25 EM6: GACTGCGTACGAATTCCA ME7/EM8 ME7: TGAGTCCTTTCCGGTCC 28 96.4 6.03 EM8: GACTGCGTACGAATTCAC Total/Mean 219 88.6 5.02 Copyright © 2011 SciRes. AJPS 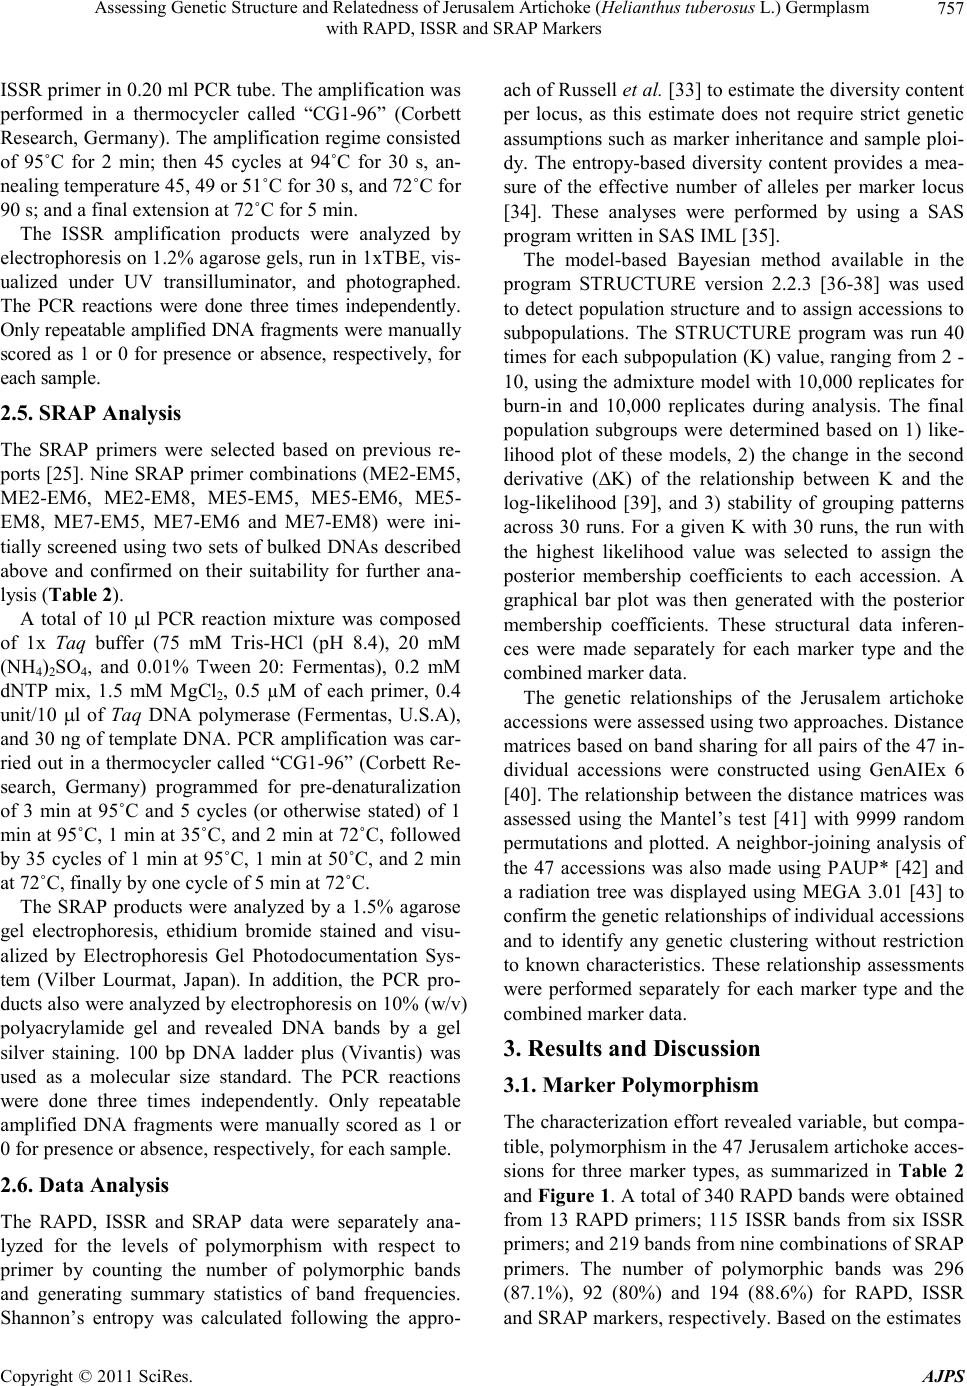 Assessing Genetic Structure and Relatedness of Jerusalem Artichoke (Helianthus tuberosus L.) Germplasm 757 with RAPD, ISSR and SRAP Markers ISSR primer in 0.20 ml PCR tube. The amplification was performed in a thermocycler called “CG1-96” (Corbett Research, Germany). The amplification regime consisted of 95˚C for 2 min; then 45 cycles at 94˚C for 30 s, an- nealing temperature 45, 49 or 51˚C for 30 s, and 72˚C for 90 s; and a final extension at 72˚C for 5 min. The ISSR amplification products were analyzed by electrophoresis on 1.2% agarose gels, run in 1xTBE, vis- ualized under UV transilluminator, and photographed. The PCR reactions were done three times independently. Only repeatable amplified DNA fragments were manually scored as 1 or 0 for presence or absence, respectively, for each sample. 2.5. SRAP Analysis The SRAP primers were selected based on previous re- ports [25]. Nine SRAP primer combinations (ME2-EM5, ME2-EM6, ME2-EM8, ME5-EM5, ME5-EM6, ME5- EM8, ME7-EM5, ME7-EM6 and ME7-EM8) were ini- tially screened using two sets of bulked DNAs described above and confirmed on their suitability for further ana- lysis (Table 2). A total of 10 l PCR reaction mixture was composed of 1x Taq buffer (75 mM Tris-HCl (pH 8.4), 20 mM (NH4)2SO4, and 0.01% Tween 20: Fermentas), 0.2 mM dNTP mix, 1.5 mM MgCl2, 0.5 µM of each primer, 0.4 unit/10 l of Taq DNA polymerase (Fermentas, U.S.A), and 30 ng of template DNA. PCR amplification was car- ried out in a thermocycler called “CG1-96” (Corbett Re- search, Germany) programmed for pre-denaturalization of 3 min at 95˚C and 5 cycles (or otherwise stated) of 1 min at 95˚C, 1 min at 35˚C, and 2 min at 72˚C, followed by 35 cycles of 1 min at 95˚C, 1 min at 50˚C, and 2 min at 72˚C, finally by one cycle of 5 min at 72˚C. The SRAP products were analyzed by a 1.5% agarose gel electrophoresis, ethidium bromide stained and visu- alized by Electrophoresis Gel Photodocumentation Sys- tem (Vilber Lourmat, Japan). In addition, the PCR pro- ducts also were analyzed by electrophoresis on 10% (w/v) polyacrylamide gel and revealed DNA bands by a gel silver staining. 100 bp DNA ladder plus (Vivantis) was used as a molecular size standard. The PCR reactions were done three times independently. Only repeatable amplified DNA fragments were manually scored as 1 or 0 for presence or absence, respectively, for each sample. 2.6. Data Analysis The RAPD, ISSR and SRAP data were separately ana- lyzed for the levels of polymorphism with respect to primer by counting the number of polymorphic bands and generating summary statistics of band frequencies. Shannon’s entropy was calculated following the appro- ach of Russell et al. [33] to estimate the diversity content per locus, as this estimate does not require strict genetic assumptions such as marker inheritance and sample ploi- dy. The entropy-based diversity content provides a mea- sure of the effective number of alleles per marker locus [34]. These analyses were performed by using a SAS program written in SAS IML [35]. The model-based Bayesian method available in the program STRUCTURE version 2.2.3 [36-38] was used to detect population structure and to assign accessions to subpopulations. The STRUCTURE program was run 40 times for each subpopulation (K) value, ranging from 2 - 10, using the admixture model with 10,000 replicates for burn-in and 10,000 replicates during analysis. The final population subgroups were determined based on 1) like- lihood plot of these models, 2) the change in the second derivative (∆K) of the relationship between K and the log-likelihood [39], and 3) stability of grouping patterns across 30 runs. For a given K with 30 runs, the run with the highest likelihood value was selected to assign the posterior membership coefficients to each accession. A graphical bar plot was then generated with the posterior membership coefficients. These structural data inferen- ces were made separately for each marker type and the combined marker data. The genetic relationships of the Jerusalem artichoke accessions were assessed using two approaches. Distance matrices based on band sharing for all pairs of the 47 in- dividual accessions were constructed using GenAIEx 6 [40]. The relationship between the distance matrices was assessed using the Mantel’s test [41] with 9999 random permutations and plotted. A neighbor-joining analysis of the 47 accessions was also made using PAUP* [42] and a radiation tree was displayed using MEGA 3.01 [43] to confirm the genetic relationships of individual accessions and to identify any genetic clustering without restriction to known characteristics. These relationship assessments were performed separately for each marker type and the combined marker data. 3. Results and Discussion 3.1. Marker Polymorphism The characterization effort revealed variable, but compa- tible, polymorphism in the 47 Jerusalem artichoke acces- sions for three marker types, as summarized in Table 2 and Figure 1. A total of 340 RAPD bands were obtained from 13 RAPD primers; 115 ISSR bands from six ISSR primers; and 219 bands from nine combinations of SRAP primers. The number of polymorphic bands was 296 (87.1%), 92 (80%) and 194 (88.6%) for RAPD, ISSR and SRAP markers, respectively. Based on the estimates Copyright © 2011 SciRes. AJPS  Assessing Genetic Structure and Relatedness of Jerusalem Artichoke (Helianthus tuberosus L.) Germplasm 758 with RAPD, ISSR and SRAP Markers Band frequency 0.05 0.15 0.25 0.35 0.45 0.55 0.65 0.75 0.85 0.95 Percentage of total bands 0 2 4 6 8 10 12 14 RAPD ISSR SRAP Figure 1. Band frequency spectra for RAPD, ISSR and SRAP markers detected in the 47 Jerusalem artichoke ac- cessions. of the Shannon’s entropy per primer (or primer pair), the most informative marker type was RAPD with the Shan- non entropy of 5.68, followed by SRAP with the Shan- non’s entropy of 5.02 and ISSR with the Shannon’s en- tropy of 3.97. The low information value for ISSR mark- ers may reflect the use of a smaller number of ISSR primers. The range of the band frequencies observed in the 47 accessions was roughly the same from 0.021 to 0.979 for three marker types, but their average band frequencies differed with 0.46, 0.40 and 0.60 for RAPD, ISSR and SRAP markers, respectively. Interestingly, an average of five RAPD bands was observed for each 0.05 interval of band frequency ranging from 0 to 1 (Figure 1). Slightly more ISSR bands with a frequency of 0.5 or smaller were observed, while slightly more SRAP bands with a fre- quency greater than 0.5 were found (Figure 1). As expected for Jerusalem artichoke, an outcrossing, hexaploidy (2n = 6x = 102) plant [44], a high level of genetic polymorphism was observed for these marker types [45]. Such a level of polymorphism was consistent with some reports based on various molecular markers [28-30], and compatible with those results reported in the cultivated sunflower [46,47]. Interestingly, the overall polymorphism was compatible over the three marker ty- pes, but the SRAP marker appeared to display a slightly higher polymorphism and detect more DNA fragments with frequencies larger than 0.5. 3.2. Genetic Structure The model-based inference of genetic structure within the 47 Jerusalem artichoke accessions by STRUCTURE considered K = 2 to 10 clusters and revealed five to six optimal clusters with the highest log-likelihoods for these three marker types and their combined data (Figure 2). First, the RAPD or ISSR markers revealed five most likely clusters with more than 80% memberships shared in corresponding clusters (Figure 2(a)). Similarly the SRAP markers or the combined marker data displayed six most likely clusters with more than 85% member- ships shared in corresponding clusters (Figure 2(a)). Note that the colors or labels used for inferred clusters may differ for different markers, but a corresponding clu- ster inferred from two marker types was defined based on the share of the membership majority. For example, the blue and green SRAP clusters are corresponding to the red and yellow clusters in the combined data, respec- tively (Figure 2(a)). The inferences of the optimal number of clusters for three marker types gained further support from the pat- terns of log-likelihood of the data (Figure 2(b)) and from the change in the second derivative (∆K) of the relation- ship between K and the log-likelihood (Figure 2(c)). The largest average log-likelihood of –6556.3 was observed for the RAPD markers when K = 5; –2024.8 for ISSR when K = 5; and –3946.0 for SRAP when K = 6 (Figure 2(b)). When the three marker data were combined, the highest average log-likelihood of –18,004.8 was obtained when K = 6. Similarly, the first dramatic change in the second derivative of the log-likelihoods over various Ks analyzed was occurred when K = 5 for the RAPD and ISSR markers, and when K = 6 for the SRAP markers (Figure 2(c)). Interestingly, the RAPD and ISSR data carried similar signals of genetic structure in this germplasm set, while the SRAP data were more compatible with the combined data in the structural inference. The reason for such a discrepancy remains unknown, but it was clear that the SRAP data carried more unique information on the ge- netic structure of this germplasm set. In spite of this, the overall patterns of genetic structure inferred from these three marker types were highly compatible, as one of the six optimal clusters obtained from SRAP or the com- bined data had only two members from the former Soviet Union (JA60 and JA61) and removing these two acces- sions generated compatible patterns of genetic structure for all marker types (results not shown). Based on the combined data, the average distance be- tween individual accessions in the same cluster for six clusters were 0.346, 0.254, 0.138, 0.158, 0.239 and 0.261, respectively, for clusters 1 to 6. The mean value of cluster- specific Fst was 0.113, 0.390, 0.670, 0.710, 0.439, and 0.323, respectively, for clusters 1 to 6. The overall pro- portions of membership of the sample in each of the six clusters were 0.248, 0.153, 0.132, 0.059, 0.128 and 0.279, respectively, for clusters 1 to 6. The detailed member- Copyright © 2011 SciRes. AJPS  Assessing Genetic Structure and Relatedness of Jerusalem Artichoke (Helianthus tuberosus L.) Germplasm with RAPD, ISSR and SRAP Markers Copyright © 2011 SciRes. AJPS 759 K 246810 0 1 2 3 4 K 246810 -14000 -12000 -10000 -8000 -6000 -4000 -2000 0 (b): In (pr(Data/K)) (c): ΔK Figure 2. The genetic structure of the 47 Jerusalem artichoke accessions inferred with STRUCTURE and the sensitivity as- sessment of inference w i th ST RUCTURE with respect to marker ty pe. (a): th e most likelihood genetic structures inferred with STRUCTURE for three marker data and the combine d marker data. Each column represents an accession and the column labels from 1 to 47 matched the sequence of the accessions given in Table 1. For example, the column 4 is JA30 and the column 26 is JA69; (b) and (c): the log-likelihood profiles and the rates of change in log-likelihood for models with K = 2 to 10 for RAPD, ISSR and SRAP markers labeled with filled circle, open circle, and open square, respectively. Note that the standard deviations of the log-likelihoods for RAPD markers when K = 8 and 10 were reduced in half for ease of illustration. ships of the 47 accessions in each cluster were given in Table 1, which was based on the highest level of inferred ancestry for one cluster from one STRUCTURE run with the highest log-likelihood of data (–11,792.9). Three accessions had the cluster membership with an ancestry level of 0.5 or less and 24 accessions displayed an ance- stry level of 0.80 or higher (Figure 2(a)). The optimal clusters detected here might reflect the current Jerusalem artichoke gene pool, as some clusters reflected either the wild populations sampled or the con- sequence of long term Jerusalem artichoke breeding, particularly in Canada. However, the sampling bias may  Assessing Genetic Structure and Relatedness of Jerusalem Artichoke (Helianthus tuberosus L.) Germplasm 760 with RAPD, ISSR and SRAP Markers exist, as this germplasm set is small and may not well re- present the worldwide Jerusalem artichoke germplasm. Adding other representative samples to such structural analysis would help to verify and correct the sampling bias. Thus, some caution is needed in interpretation of these optimal clusters. 3.3. Genetic Distance Distance matrices based on band sharing were constru- cted for all pairs of the 47 individual accessions for three marker types and the relationship between the distance matrices was plotted in Figure 3. The pairwise distances based on the RAPD markers ranged from 0.091 to 0.432 and averaged 0.328; the pairwise distances based on the ISSR markers ranged from 0.065 to 0.5 and averaged 0.326; and the pairwise distances based on the SRAP markers ranged from 0.036 to 0.474 and averaged 0.339. Obviously, highly significant (P < 0.0001) linear rela- tionships between the distance matrices were detected for three pairs of marker type. The relationship for the pair of the RAPD and ISSR markers explained 16.4% varia- tion with a correlation coefficient of 0.40. The relation- ship for the pair of the RAPD and SRAP markers ex- plained 28.4% variation with a correlation coefficient of 0.53. The relationship for the pair of the ISSR and SRAP markers explained 19.2% variation with a correlation co- efficient of 0.44. However, the estimated correlation coef- ficients of distance matrices among these marker types are relatively low. The revealed correlations of pairwise distance matri- ces, although relatively weak, were compatible among three marker types. The extent of distance matrix corre- lation reported here was consistent with those reported from similar studies of other plants [48,49]. The low co- rrelations reflect the relatively low resolution of sam- pling genetic variation of a genome with these marker types, in contrast to the most informative markers such as microsatellite or simple-nucleotide polymorphism av- ailable in well-studied plant species [1,2]. However, the SRAP marker seemed to be slightly more informative than the other two marker types, as the correlations be- tween SRAP and the other marker types were higher. The neighbor-joining (NJ) analysis of the combined data revealed several interesting patterns of genetic re- latedness (Figure 4). First, up to six clusters could be identified, but they were not well separated, even based on the information from a total of 582 DNA fragments. In spite of the low resolution, the NJ clustering matched relatively well with those inferred from the STRUC- TURE program, as illustrated in Figure 4. Two discrepancies were identified: the accessions JA45 and JA47 for Cluster 6 and Cluster 2 and the accession of JA72 for Cluster 4 and Cluster 1. Second, the six wild accessions from Texas, USA, were clustered into three groups and may reflect the different levels of ancestry among them. Third, the 24 accessions from Canada lar- gely represented cultivated materials and were clustered into three groups, two of which the wild accessions from USA were also present. This suggests at least three ancestral ISSR distance 0.0 0.1 0.2 0.30.40.5 0.0 0.1 0.2 0.3 0.4 0.5 RAPD dista n ce 0.0 0.1 0.2 0.30.40.5 0.0 0.1 0.2 0.3 0.4 0.5 RAPD dista n ce 0.0 0.1 0.2 0.30.40.5 0.0 0.1 0.2 0.3 0.4 0.5 Y=0.8031X+0.0756 R2=0.2835, P<0.0001 Y=0.5115X+0.1587 R2=0.1636, P<0.0001 Y=0.5227X+0.1683 R2=0.192, P<0.0001 A C B (a) (b) (c) ISSR distance SRAP distance SRAP distance Figure 3. Correlation between genetic distances based on RAPD, ISSR and SRAP markers in the 47 Jerusalem artichoke acces- sions. Each point represents the genetic distance between a pair of acces sions, based on band sharing of either m arker. Copyright © 2011 SciRes. AJPS 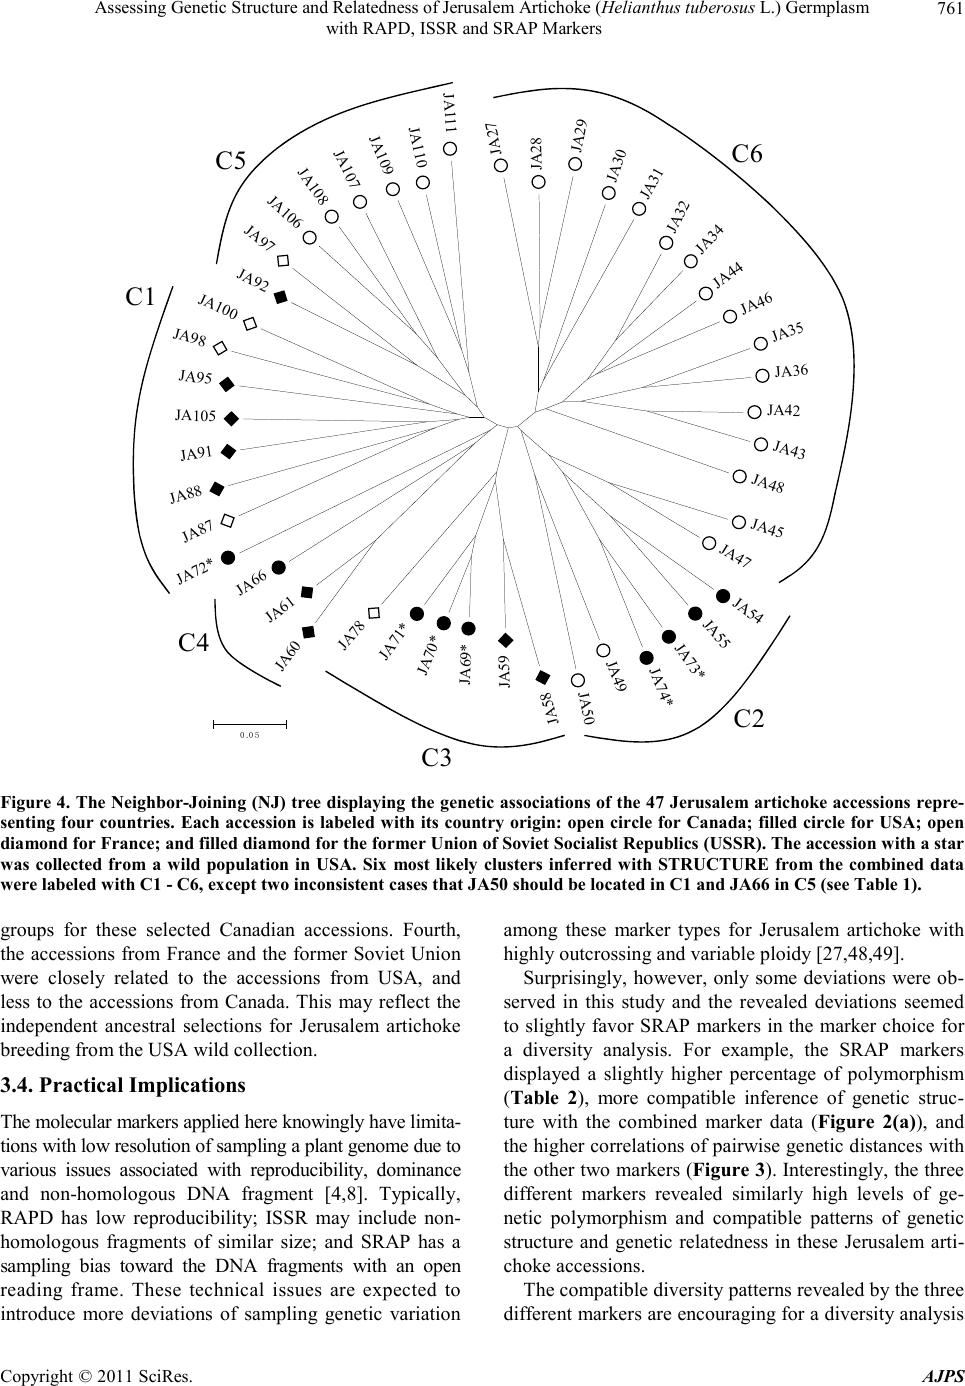 Assessing Genetic Structure and Relatedness of Jerusalem Artichoke (Helianthus tuberosus L.) Germplasm with RAPD, ISSR and SRAP Markers Copyright © 2011 SciRes. AJPS 761 C6 C1 C5 C4 C2 C3 JA27 JA28 JA29 JA30 JA31 JA32 JA34 JA44 JA46 JA35 JA36 JA42 JA43 JA48 JA45 JA47 JA54 JA55 JA73* JA74* JA49 JA50 JA58 JA59 JA69* JA70* JA71* JA78 JA60 JA61 JA66 JA72* JA87 JA88 JA91 JA105 JA95 JA98 JA100 JA92 JA97 JA106 JA108 JA107 JA109 JA110 JA111 0.05 Figure 4. The Neighbor-J oining (NJ) tree display ing the genetic asso ciations of the 47 J erusale m articho ke accessi ons re pre- senting four countries. Each accession is labeled with its country origin: open circle for Canada; filled circle for USA; open diamond for France; and filled diamond for the former Union of Soviet Socialist Republics (USSR). The accession with a star was collected from a wild population in USA. Six most likely clusters inferred with STRUCTURE from the combined data were labeled with C1 - C6, except two i nconsistent cases t hat J A 50 should be located in C1 and JA66 in C5 (see Table 1) . groups for these selected Canadian accessions. Fourth, the accessions from France and the former Soviet Union were closely related to the accessions from USA, and less to the accessions from Canada. This may reflect the independent ancestral selections for Jerusalem artichoke breeding from the USA wild collection. 3.4. Prac t i c al Implic ation s The molecular markers applied here knowingly have limita- tions with low resolution of sampling a plant genome due to various issues associated with reproducibility, dominance and non-homologous DNA fragment [4,8]. Typically, RAPD has low reproducibility; ISSR may include non- homologous fragments of similar size; and SRAP has a sampling bias toward the DNA fragments with an open reading frame. These technical issues are expected to introduce more deviations of sampling genetic variation among these marker types for Jerusalem artichoke with highly outcrossing and variable ploidy [27,48,49]. Surprisingly, however, only some deviations were ob- served in this study and the revealed deviations seemed to slightly favor SRAP markers in the marker choice for a diversity analysis. For example, the SRAP markers displayed a slightly higher percentage of polymorphism (Table 2), more compatible inference of genetic struc- ture with the combined marker data (Figure 2(a)), and the higher correlations of pairwise genetic distances with the other two markers (Figure 3). Interestingly, the three different markers revealed similarly high levels of ge- netic polymorphism and compatible patterns of genetic structure and genetic relatedness in these Jerusalem arti- choke accessions. The compatible diversity patterns revealed by the three different markers are encouraging for a diversity analysis  Assessing Genetic Structure and Relatedness of Jerusalem Artichoke (Helianthus tuberosus L.) Germplasm 762 with RAPD, ISSR and SRAP Markers of an under-explored plant species like Jerusalem arti- choke with limited genomic resources available. The three types of molecular markers applied here are tech- nically simple and practically feasible and could still play a role in the sampling of genetic variation in poorly known or less characterized plant species. The SRAP marker appeared to be slightly more informative than the other assayed markers and favored for further diversity analysis, but its limitation in sampling bias should also be considered in the marker choice. The revealed patterns of genetic structure are useful for managing worldwide Jerusalem artichoke germplasm by taking the structural patterns into account in the de- velopment of diverse core subsets for further germplasm characterization and utilization. The specific core subsets [6] can facilitate the association mapping of genes con- trolling ecologically important traits such as inulin, oil characters and disease resistance. The revealed patterns of genetic relatedness are informative for parental selec- tions and experimental design of productive crosses in Jerusalem artichoke breeding. Three ancestral lines were detected for the Canadian germplasm and quite distin- guished from the germplasm from other countries. As expected with its species distribution, more genetically diverse accessions remain in the USA germplasm collec- tion and a further comprehensive characterization of the USA collection would yield more useful diversity infor- mation for utilizing Jerusalem artichoke germplasm. 3.5. Conclusive Remarks The multi-marker characterization of the 47 Jerusalem artichoke accessions revealed compatible patterns of ge- netic polymorphism, genetic structure and genetic rela- tedness for three marker types. The SRAP marker ap- peared to be slightly more informative and thus favored for further diversity analysis. A high level of genetic polymorphism was detected and six optimal groups were identified in this germplasm set. Three ancestral groups were identified for the Canadian germplasm. Most di- verse germplasm harbored in the USA collection. These results are useful for managing Jerusalem artichoke ger- mplasm and utilizing diverse germplasm for genetic im- provement. 4. Acknowledgements We gratefully acknowledge the Thailand Research Fund (TRF), the commission for High Education (CHE) and Khon Kaen University (KKU) for providing financial supports to this research through the Distinguish Re- search Professor Grant to Professor Dr. Aran Patanothai and an anonymous reviewer for his/her helpful com- ments on an early version of the manuscript. REFERENCES [1] N. Liu, L. Chen, S. Wang, C. Oh and H. Zhao, “Com- parison of Single Nucleotide Polymorphism and Mi- crosatellites in Inference of Population Structure,” BMC Genetics, Vol. 6, Supplement 1, 2005, p. S26. doi:10.1371/journal.pone.0001367 [2] M. T. Hamblin, M. L. Warburton and E. S. Buckler, “Empirical Comparison of Simple Sequence Repeats and Single Nucleotide Polymorphism in Assessment of Maize Diversity and Relatedness,” PLOS One, Vol. 2, No. 12, 2007, p. e1367. [3] P. K. Ingvarsson and N. R. Street, “Association Genetics of Complex Traits in Plants,” New Phytologist, Vol. 189, No. 4, 2011, pp. 909-922. doi:10.1111/j.1469-8137.2010.03593.x [4] A. Karp, “The New Genetic Era: Will It Help Us in Managing Genetic Diversity?” In: J. M. M. Engels, V. R. Rao, A. H. D. Brown and M. T. Jackson, Eds., Managing Plant Genetic Diversity, International Plant Genetic Re- sources Institute, Rome, 2002, pp. 43-56. [5] Y. B. Fu, G. W. Peterson, K. W. Richards, T. R. Tarn and J. E. Percy, “Genetic Diversity of Canadian and Exotic Potato Germplasm Revealed by Simple Sequence Repeat Markers,” American Journal of Potato Research, Vol. 86, No. 1, 2009, pp. 38-48. do i:1 0.10 07 / s12 23 0-0 08 -90 59 -6 [6] A. H. D. Brown, “Core Collection: A Practical Approach to Genetic Resources Management,” Genome, Vol. 31, No. 2, 1989, pp. 818-824. doi:10.1139/g89-144 [7] J. Yu, G. Pressoir, W. H. Briggs, I. V. Bi, M. Yamasaki, J. F. Doebley, M. D. McMullen, B. S. Gaut, D. M. Nielsen, J. B. Holland, S. Kresovich and E. S. Buckler, “A Unified Mixed-Model Method for Association Mapping that Ac- counts for Multiple Levels of Relatedness,” Nature Ge- netics, Vol. 38, 2006, pp. 203-208. do i :1 0.10 38 /n g17 02 [8] H. Nybom, “Comparison of Different Nuclear DNA Mar- kers for Estimating Intraspecific Genetic Diversity in Plants,” Molecular Ecology, Vol. 13, No. 15, 2004, pp. 1143-1155. doi:10.1111/j.1365-294X.2004.02141.x [9] S. J. Kays and S. F. Nottingham, “Chapter 8 Genetic Resources, Breeding and Cultivars,” In: Biology and Bio- chemistry of Jerusalem Artichoke, Taylor and Francis, CRC Press, Boca-Raton, 2008, pp. 149-240. [10] E. A. Zaky, “Physiological Response to Diets Fortified with Jerusalem Artichoke Tubers (Helianthus tuberosus L.) Powder by Diabetic Rats,” American - Eurasian Jour- nal of Agricultural & Environmental Sciences, Vol. 5, No. 5, 2009, pp. 682-688. [11] G. J. Seiler, “The Potential of Wild Sunflower Species for Industrial Uses,” Helia, Vol. 30, No. 46, 2007, pp. 175- 198. [12] H. Serieys, I. Souyris, A. Gil, B. Poinso and A. Berville, “Diversity of Jerusalem Artichoke Clones (Helianthus tuberosu s L.) from the INRA-Montpellier Collection,” Genetic Resources and Crop Evolution, Vol. 57, No. 8, 2010, pp. 1207-1215. doi:10.1007/s10722-010-9560-x Copyright © 2011 SciRes. AJPS  Assessing Genetic Structure and Relatedness of Jerusalem Artichoke (Helianthus tuberosus L.) Germplasm 763 with RAPD, ISSR and SRAP Markers [13] R. Sennoi, S. Jogloy, W. Saksirirat and A. Patanothai, “Pathogeneicity Test of Sclerotium rolfsii, a Causal Agent of Jerusalem Artichoke (Helianthus tuberosus L.) Stem rot,” Asian Journal of Plant Sciences, Vol. 9, No. 5, 2010, pp. 281-284. doi:10.3923/ajps.2010.281.284 [14] C. Breton, H. Serieys and A. Bervill, “Gene Transfer from Wild Helianthus to Sunflower: Topicalities and Li- mits,” Oleagineux Corps Gras Lipides, Vol. 17, No. 2, 2010, pp. 104-114. [15] J. R. Mandel, J. M. Dechaine, L. F. Marek and J. M. Burke, “Genetic Diversity and Population Structure in Cultivated Sunflower and a Comparison to Its Wild Pro- genitor, Helianthus annuus L,” Theoretical and Applied Genetics, Vol. 123, No. 5, 2011, pp. 693-704. do i:1 0.10 07 / s00 12 2-0 11 -16 19 -3 [16] L. J. M. van Soest, H. D. Mastebroek and E. P. M. de Meijer, “Genetic Resources and Breeding: A Necessity for the Success of Industrial Crops,” Industrial Crops and Products, Vol. 1, 1993, pp. 283-288. do i:1 0.10 16 / 0926 - 6690 ( 92) 90 029- U [17] G. M. Volk and K. Richards, “Preservation Methods for Jerusalem Artichoke Cultivars,” HortScience, Vol. 41, No. 1, 2006, pp. 80-83. [18] S. Schittenhelm, “Inheritance of Agronomical Important Traits in Jerusalem Artichoke (Helianthus tuberosus L.),” Vorträge für Pflanzenzĝchtung , 1990, pp. 15-16. [19] S. J. Kays and F. Kultur, “Genetic Variation in Jerusalem Artichoke (Helianthus tuberosus L.) Flowering Date and Duration,” HortScience, Vol. 40, No. 6, 2005, pp. 1675- 1678. [20] R. Puttha, S. Jogloy, P. P. Wangsomnuk, S. Srijaranai, T. Kesmala and A. Patanothai, “Genotypic Variability and Genotype by Environment Interactions for Inulin Content of Jerusalem Artichoke Germplasm,” Euphytica, Vol. 183, No. 1, pp. 119-131. doi:10.1007/s10681-011-0520-0 [21] I. A. Arif, M. A. Bakir, H. A. Khan, A. H. A. Farhan, A. A. A. Homaidan, A. H. Bahkali, M. A. Sadoon and M. Shobrak, “A Brief Review of Molecular Techniques to Assess Plant Diversity,” International Journal of Mo- lecular Sciences, Vol. 11, No. 5, 2010, pp. 2079-2096. doi:10.3390/ijms11052079 [22] J. G. K. Williams, A. R. Kubelik, K. J. Livak, J. A. Rafa- lski and S. V. Tingey, “DNA Polymorphisms Amplified by Arbitrary Primers Are Useful as Genetic Markers,” Nucleic Acids Research, Vol. 18, No. 22, 1990, pp. 6531- 6535. doi:10.1093/nar/18.22.6531 [23] E. Zietkiewicz, A. Rafalski and D. Labuda, “Genome Fingerprinting by Simple Sequence Repeats (SSR)-An- chored PCR Amplification,” Genomics, Vol. 20, No. 2, 1994, pp. 176-183. doi:10.1006/geno.1994.1151 [24] W. J. M. Koopman, “Phylogenetic Signal in AFLP Data sets,” Systems Biology, Vol. 54, No. 2, 2005, pp. 197-217. doi:10.1080/10635150590924181 [25] G. Li and C. F. Quiros, “Sequence-Related Amplified Polymorphism (SRAP), a New Marker System Based on a Simple PCR Reaction: Its Application to Mapping and Gene tagging in Brassica,” Theoretical and Applied Ge- netics, Vol. 103, 2001, pp. 455-461. do i:1 0. 1007 / s00 12 20 100 57 0 [26] M. Ferriol, B. Pico and F. Nuez, “Genetic Diversity of Some Accessions of Cucurbita maxima from Spain Using RAPD and SRAP Markers,” Genetic Resources and Crop Evolution, Vol. 50, 2003, pp. 227-238. doi:10.1023/A:1023502925766 [27] H. Budak, R. C. Shearman, I. Parmaksiz and I. Dweikat, “Comparative Analysis of Seeded and Vegetative Bio- type Buffalograsses Based on Phylogenetic Relationship Using ISSRs, SSRs, RAPDs and SRAPs,” Theoretical and Applied Genetics, Vol.109, No. 2, 2004, pp. 280-288. do i:1 0.10 07 / s00 12 2-0 04 -16 30 -z [28] B. Dozet, R. Marinković, D. Vasić and A. Marjanović, “Genetic Similarity of the Jerusalem Artichoke Popula- tions (Helianthus tuberosus L.) Collected in Montene- gro,” Helia, Vol. 16, No. 18, 1993, pp. 41-48. [29] P. P. Wangsomnuk, S. Khampa, S. Jogloy, P. Wangsom- nuk and Y. Kitijataropas, “Assessment of Genome and Genetic Diversity in Jerusalem Artichoke (Helianthus tuberosu s L.) with ISSR Markers,” Khon Kaen Agricul- ture Journal, Vol. 34, No. 2, 2006, pp. 124-138. [30] S. A. El Gengaihi, A. M. Aboul Enein, F. M. Abou Elalla and D. H. Abou Baker, “Molecular Characterizations and Antimicrobial Activities of Chicory and Jerusalem Arti- choke Plants,” International Journal of Academic Re- search, Vol. 1, No. 2, 2009, pp. 66-71. [31] T. H. Tai and S. D. Tanksley, “A Rapid and Inexpensive Method for Isolation of Total DNA from Dehydrated Plant Tissue,” Plant Molecular Biology Reporter, Vol. 8, No. 4, 1990, pp. 297-303. doi:10.1007/BF02668766 [32] T. Mornkham, P. P. Wangsomnuk, S. Jogloy, P. Wang- somnuk, A. Patanothai and Y. B. Fu, “An Assessment of Five DNA Extraction Methods for Molecular Analyses of Jerusalem Artichoke (Helianthus tuberosus L.),” Genetics and Molecular Research, in press. [33] J. R. Russell, F. Hosein, E. Johnson, R. Waugh and W. Powell, “Genetic Differentiation of Cocoa (Theobroma cacao L.) Populations Revealed by RAPD Analysis,” Molecular Ecology, Vol. 2, No. 2, 1993, pp. 89-97. doi:10.1111/j.1365-294X.1993.tb00003.x [34] M. H. Reyes-Valdes and C. G. Williams, “An Entropy- Based Measure of Founder Informativeness,” Genetics Research, Vol. 85, 2005, pp. 81-88. do i:1 0.10 17 / S00 16 67 2305 00 73 54 [35] SAS Institute Inc, “The SAS System for Windows V9.2,” SAS Institute Incorporated, Cary, 2008. [36] J. Pritchard, M. Stephens and P. Donnelly, “Inference of Population Structure Using Multilocus Genotype Data,” Genetics, Vol. 155, No. 2, 2000, pp. 945-959. [37] D. Falush, M. Stephens and J. K. Pritchard, “Inference of Population Structure Using Multilocus Genotype Data: Linked Loci and Correlated Allele Frequencies,” Genet- ics, Vol. 164, No. 4, 2003, pp. 1567-1587. [38] D. Falush, M. Stephens and J. K. Pritchard, “Inference of Copyright © 2011 SciRes. AJPS  Assessing Genetic Structure and Relatedness of Jerusalem Artichoke (Helianthus tuberosus L.) Germplasm with RAPD, ISSR and SRAP Markers Copyright © 2011 SciRes. AJPS 764 Population Structure Using Multilocus Genotype Data: Dominant Markers and Null Alleles,” Molecular Ecology Notes, Vol. 7, No. 4, 2007, pp. 574-578. doi:10.1111/j.1471-8286.2007.01758.x [39] G. Evanno, S. Regnaut and J. Goudet, “Detecting the Number of Clusters of Individuals Using the Software STRUCTURE: A Simulation Study,” Molecular Ecology, Vol. 14, No. 8, 2005, pp. 2611-2620. doi:10.1111/j.1365-294X.2005.02553.x [40] R. Peakall and P. E. Smouse, “GenAlEx 6: Genetic Ana- lysis in Excel. Population Genetic Software for Teaching and Research,” The Australian National University, Can- berra, 2005. http://www.anu.edu.au/BoZo/GenAlEx/ [41] N. Mantel, “The Detection of Disease Clustering and a Ge- neralized Regression Approach,” Cancer Research, Vol. 27, No. 2, 1967, pp. 209-220. [42] D. L. Swofford, “PAUP*. Phylogenetic Analysis Using Parsimony (*and Other Methods). Version 4,” Sinauer Associates, Sunderland, 1998. [43] S. Kumar, K. Tamura and M. Nei, “MEGA3: Integrated Software for Molecular Evolutionary Genetics Analysis and Sequence Alignment,” Briefings in Bioinformatics, Vol. 5, No. 2, 2004, pp. 150-163. doi :1 0. 10 93 /b ib /5 . 2. 15 0 [44] C. J. Swanton, P. B. Cavers, D. R. Clements and M. J. Moore, “The Biology of Canadian Weeds. 101. Helian- thus tuberosus L.,” Canadian Journal of Plant Science, Vol. 72, No. 4, 1992, pp. 1367-1382. do i:1 0.41 41 / cjp s92 -16 9 [45] J. L. Hamrick and M. J. W. Godt, “Allozyme Diversity in Plant Species,” In A. H. D. Brown, M. T. Clegg, A. L. Kahler and B. S. Weir, Eds., Plant Population Genetics, Breeding and Gentic Resources, Sinauer Associates, Sun- derland, 1989, pp. 43-63. [46] W.R. Lawson, R. J. Henry, J. K. Kochman and G. A. Kong, “Genetic Diversity in Sunflower (Helianthus an- nuus L.) as Revealed by Random Amplified Polymorphic DNA Analysis,” Australian Journal of Agricultural Re- search, Vol. 45, No. 7, 1994, pp. 1319-1327. doi:10.1071/AR9941319 [47] G. Quagliaro, M. Vischi, M. Tyrka and A. M. Olivieri, “Identification of Wild and Cultivated Sunflower for Breeding Purposes by AFLP Markers,” Journal of Hered- ity, Vol. 92, 2001, pp. 38-42. do i:1 0.10 93 / jh ered /9 2.1 .3 8 [48] L. Liu, L. Zhao, Y. Gong, M. Wang, L. Chen, J. Yang, Y. Wang, F. Yu and L. Wang, “DNA Fingerprinting and Genetic Diversity Analysis of Late-Bolting Radish Culti- vars with RAPD, ISSR and SRAP Markers,” Scientia Horticulturae, Vol. 116, 2008, pp. 240-247. doi:10.1016/j.scienta.2007.12.011 [49] P. Kumar, M. A. Alam, H. Singh, V. Goyal, S. Parida, S. Kalia and T. Mohapatra, “Assessment of Genetic Diver- sity through RAPD, ISSR and AFLP Markers in Podo- phyllum hexandrum: A Medicinal Herb from the North- western Himalayan Region,” Physiology and Molecular Biology of Plants, Vol. 16, No. 2, 2010, pp. 135-148. do i:1 0.10 07 / s12 29 8-0 10 -00 15 -9
|