J. R. COX ET AL.
464
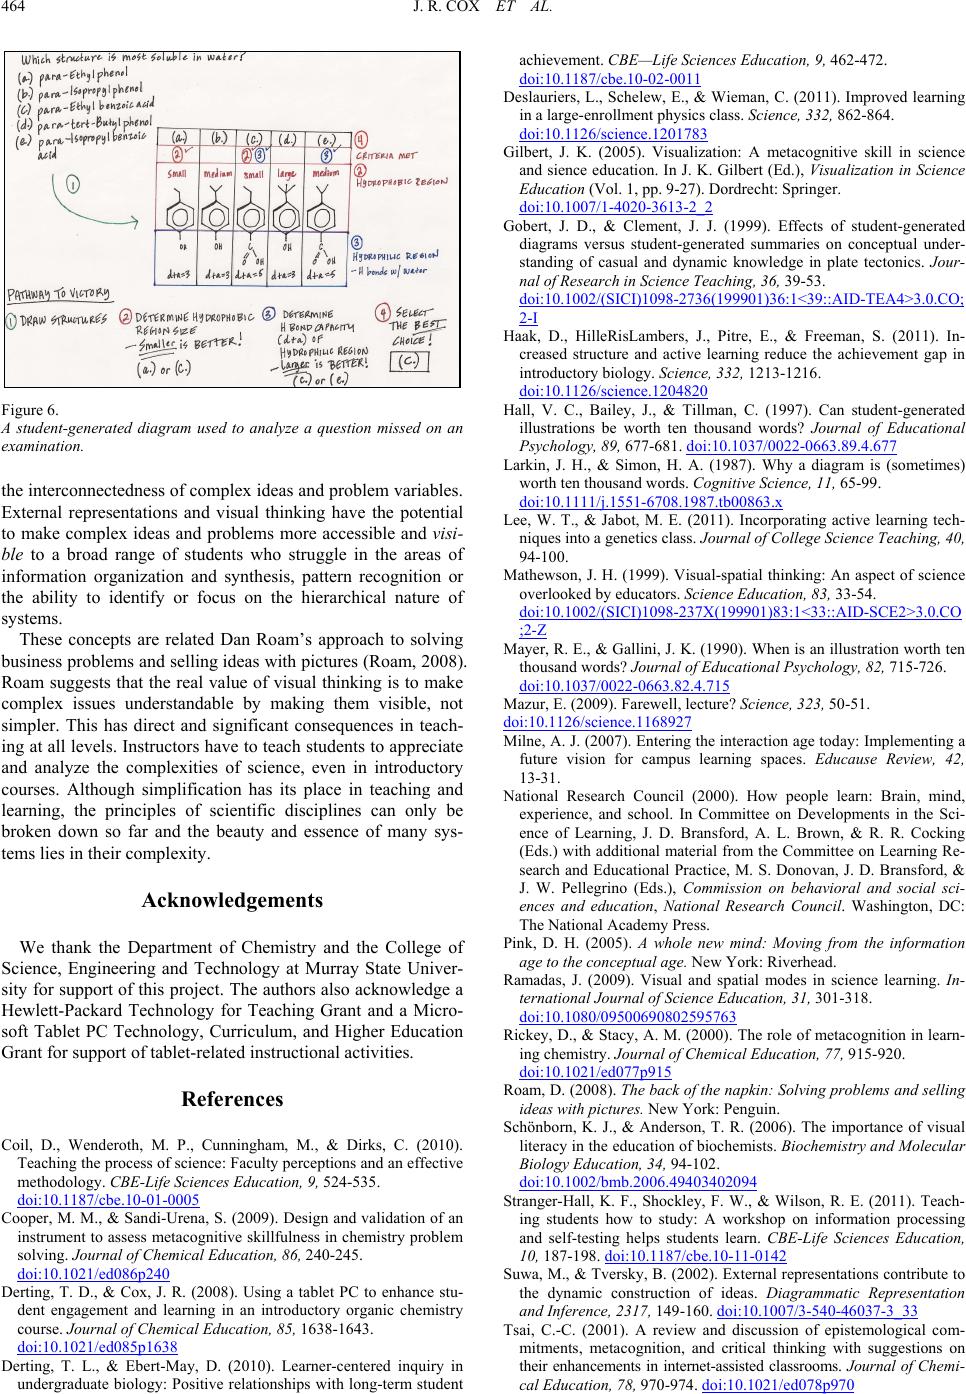
Figure 6.
A student-generated diagram used to analyze a question missed on an
examination.
the interconnectedness of complex ideas and problem variables.
External representations and visual thinking have the potential
to make complex ideas and problems more accessible and visi-
ble to a broad range of students who struggle in the areas of
information organization and synthesis, pattern recognition or
the ability to identify or focus on the hierarchical nature of
systems.
These concepts are related Dan Roam’s approach to solving
business problems and selling ideas with pictures (Roam, 2008).
Roam suggests that the real value of visual thinking is to make
complex issues understandable by making them visible, not
simpler. This has direct and significant consequences in teach-
ing at all levels. Instructors have to teach students to appreciate
and analyze the complexities of science, even in introductory
courses. Although simplification has its place in teaching and
learning, the principles of scientific disciplines can only be
broken down so far and the beauty and essence of many sys-
tems lies in their complexity.
Acknowledgements
We thank the Department of Chemistry and the College of
Science, Engineering and Technology at Murray State Univer-
sity for support of this project. The authors also acknowledge a
Hewlett-Packard Technology for Teaching Grant and a Micro-
soft Tablet PC Technology, Curriculum, and Higher Education
Grant for support of tablet-related instructional activities.
References
Coil, D., Wenderoth, M. P., Cunningham, M., & Dirks, C. (2010).
Teaching the process of science: Faculty perceptions and an effective
methodology. CBE-Life Sciences Education, 9, 524-535.
doi:10.1187/cbe.10-01-0005
Cooper, M. M., & Sandi-Urena, S. (2009). Design and validation of an
instrument to assess metacognitive skillfulness in chemistry problem
solving. Journal of Chemical Education, 86, 240-245.
doi:10.1021/ed086p240
Derting, T. D., & Cox, J. R. (2008). Using a tablet PC to enhance stu-
dent engagement and learning in an introductory organic chemistry
course. Journal of Chem ic al Education, 85, 1638-1643.
doi:10.1021/ed085p1638
Derting, T. L., & Ebert-May, D. (2010). Learner-centered inquiry in
undergraduate biology: Positive relationships with long-term student
achievement. CBE—Life Sciences Education, 9, 462-472.
doi:10.1187/cbe.10-02-0011
Deslauriers, L., Schelew, E., & Wieman, C. (2011). Improved learning
in a large-enrollment physics class. Science, 332, 862-864.
doi:10.1126/science.1201783
Gilbert, J. K. (2005). Visualization: A metacognitive skill in science
and sience education. In J. K. Gilbert (Ed.), Visualization in Science
Education (Vol. 1, pp . 9-27). Dordrecht: Springer.
doi:10.1007/1-4020-3613-2_2
Gobert, J. D., & Clement, J. J. (1999). Effects of student-generated
diagrams versus student-generated summaries on conceptual under-
standing of casual and dynamic knowledge in plate tectonics. Jour-
nal of Research in Science T eaching, 36, 39-53.
doi:10.1002/(SICI)1098-2736(199901)36:1<39::AID-TEA4>3.0.CO;
2-I
Haak, D., HilleRisLambers, J., Pitre, E., & Freeman, S. (2011). In-
creased structure and active learning reduce the achievement gap in
introductory biology. Science, 332, 1213-1216.
doi:10.1126/science.1204820
Hall, V. C., Bailey, J., & Tillman, C. (1997). Can student-generated
illustrations be worth ten thousand words? Journal of Educational
Psychology, 89, 677-681. doi:10.1037/0022-0663.89.4.677
Larkin, J. H., & Simon, H. A. (1987). Why a diagram is (sometimes)
worth ten thousand words. Cognitive Science, 11, 65-99.
doi:10.1111/j.1551-6708.1987.tb00863.x
Lee, W. T., & Jabot, M. E. (2011). Incorporating active learning tech-
niques into a genetics class. Journal of College Science Teaching, 40,
94-100.
Mathewson, J. H. (1999). Visual-spatial thinking: An aspect of science
overlooked by educato rs. Science Education, 83, 33-54.
doi:10.1002/(SICI)1098-237X(199901)83:1<33::AID-SCE2>3.0.CO
;2-Z
Mayer, R. E., & Gallini, J. K. (1990). When is an illustration worth ten
thousand words? Journal of Educational Ps ych ol ogy , 82, 715-726.
doi:10.1037/0022-0663.82.4.715
Mazur, E. (2009). Farewell, lecture? Scienc e, 323, 50-51.
doi:10.1126/science.1168927
Milne, A. J. (2007). Entering the interaction age today: Implementing a
future vision for campus learning spaces. Educause Review, 42,
13-31.
National Research Council (2000). How people learn: Brain, mind,
experience, and school. In Committee on Developments in the Sci-
ence of Learning, J. D. Bransford, A. L. Brown, & R. R. Cocking
(Eds.) with additional material from th e Committee on Learning Re-
search and Educational Practice, M. S. Donovan, J. D. Bransford, &
J. W. Pellegrino (Eds.), Commission on behavioral and social sci-
ences and education, National Research Council. Washington, DC:
The National Academy Press.
Pink, D. H. (2005). A whole new mind: Moving from the information
age to the conceptual age. New York: Riverhead.
Ramadas, J. (2009). Visual and spatial modes in science learning. In-
ternational Journal o f Science Education, 31, 301-318.
doi:10.1080/09500690802595763
Rickey, D., & Stacy, A. M. (2000). The role of metacognition in learn-
ing chemistry. Journal of Chemical Education, 77, 915-920.
doi:10.1021/ed077p915
Roam, D. (2008). The back of the napkin: Solving problems and selling
ideas with pictures. New York: Penguin.
Schönborn, K. J., & Anderson, T. R. (2006). The importance of visual
literacy in the education of biochemists. Biochemistry and Molecular
Biology Education, 34, 94-102.
doi:10.1002/bmb.2006.49403402094
Stranger-Hall, K. F., Shockley, F. W., & Wilson, R. E. (2011). Teach-
ing students how to study: A workshop on information processing
and self-testing helps students learn. CBE-Life Sciences Education,
10, 187-198. doi:10.1187/cbe.10-11-0142
Suwa, M., & Tversky, B. (2002). External representations contribute to
the dynamic construction of ideas. Diagrammatic Representation
and Inference, 2317, 149-160. doi:10.1007/3-540-46037-3_33
Tsai, C.-C. (2001). A review and discussion of epistemological com-
mitments, metacognition, and critical thinking with suggestions on
their enhancements in internet-assisted classrooms. Journal of Chemi-
cal Education, 78, 970-974. doi:10.1021/ed078p970