Paper Menu >>
Journal Menu >>
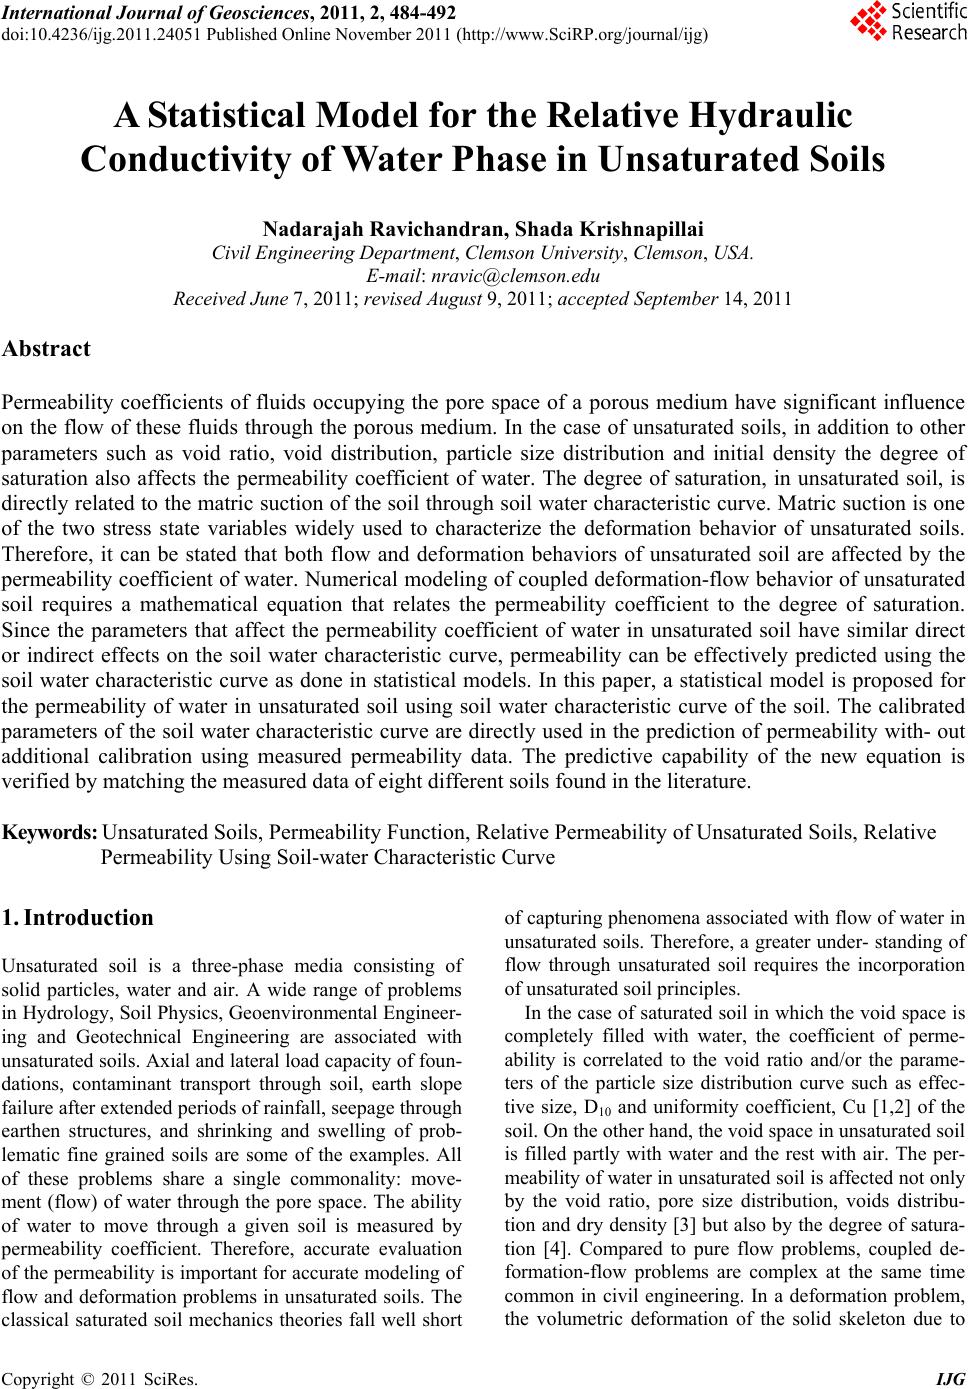 International Journal of Geosciences, 2011, 2, 484-492 doi:10.4236/ijg.2011.24051 Published Online November 2011 (http://www.SciRP.org/journal/ijg) Copyright © 2011 SciRes. IJG A Statistical Model for the Relative Hydraulic Conductivity of Water Phase in Unsaturated Soils Nadarajah Ravichandran, Shada Krishnapillai Civil Engineering Department, Clemson University, Clemson, USA. E-mail: nravic@clemson.edu Received June 7, 2011; revised August 9, 2011; accepted September 14, 2011 Abstract Permeability coefficients of fluids occupying the pore space of a porous medium have significant influence on the flow of these fluids through the porous medium. In the case of unsaturated soils, in addition to other parameters such as void ratio, void distribution, particle size distribution and initial density the degree of saturation also affects the permeability coefficient of water. The degree of saturation, in unsaturated soil, is directly related to the matric suction of the soil through soil water characteristic curve. Matric suction is one of the two stress state variables widely used to characterize the deformation behavior of unsaturated soils. Therefore, it can be stated that both flow and deformation behaviors of unsaturated soil are affected by the permeability coefficient of water. Numerical modeling of coupled deformation-flow behavior of unsaturated soil requires a mathematical equation that relates the permeability coefficient to the degree of saturation. Since the parameters that affect the permeability coefficient of water in unsaturated soil have similar direct or indirect effects on the soil water characteristic curve, permeability can be effectively predicted using the soil water characteristic curve as done in statistical models. In this paper, a statistical model is proposed for the permeability of water in unsaturated soil using soil water characteristic curve of the soil. The calibrated parameters of the soil water characteristic curve are directly used in the prediction of permeability with- out additional calibration using measured permeability data. The predictive capability of the new equation is verified by matching the measured data of eight different soils found in the literature. Keywords: Unsaturated Soils, Permeability Function, Relative Permeability of Unsaturated Soils, Relative Permeability Using Soil-water Characteristic Curve 1. Introduction Unsaturated soil is a three-phase media consisting of solid particles, water and air. A wide range of problems in Hydrology, Soil Physics, Geoenvironmental Engineer- ing and Geotechnical Engineering are associated with unsaturated soils. Axial and lateral lo ad capacity of foun- dations, contaminant transport through soil, earth slope failure after extended periods of rainfall, seepage through earthen structures, and shrinking and swelling of prob- lematic fine grained soils are some of the examples. All of these problems share a single commonality: move- ment (flow) of water through the pore space. The ability of water to move through a given soil is measured by permeability coefficient. Therefore, accurate evaluation of the permeability is important for accurate modeling of flow and deformation problems in unsaturated soils. The classical saturated soil mechanics theories fall well short of capturing phenomena associated with flow of water in unsaturated soils. Therefore, a greater under- standing of flow through unsaturated soil requires the incorporation of unsaturated soil principles. In the case of saturated soil in which the void space is completely filled with water, the coefficient of perme- ability is correlated to the void ratio and/or the parame- ters of the particle size distribution curve such as effec- tive size, D10 and uniformity coefficient, Cu [1,2] of the soil. On the other hand, the void space in unsaturated soil is filled partly with water and the rest with air. The per- meability of water in unsaturated soil is affected not on ly by the void ratio, pore size distribution, voids distribu- tion and dry density [3] but also by the degree of satura- tion [4]. Compared to pure flow problems, coupled de- formation-flow problems are complex at the same time common in civil engineering. In a deformation problem, the volumetric deformation of the solid skeleton due to 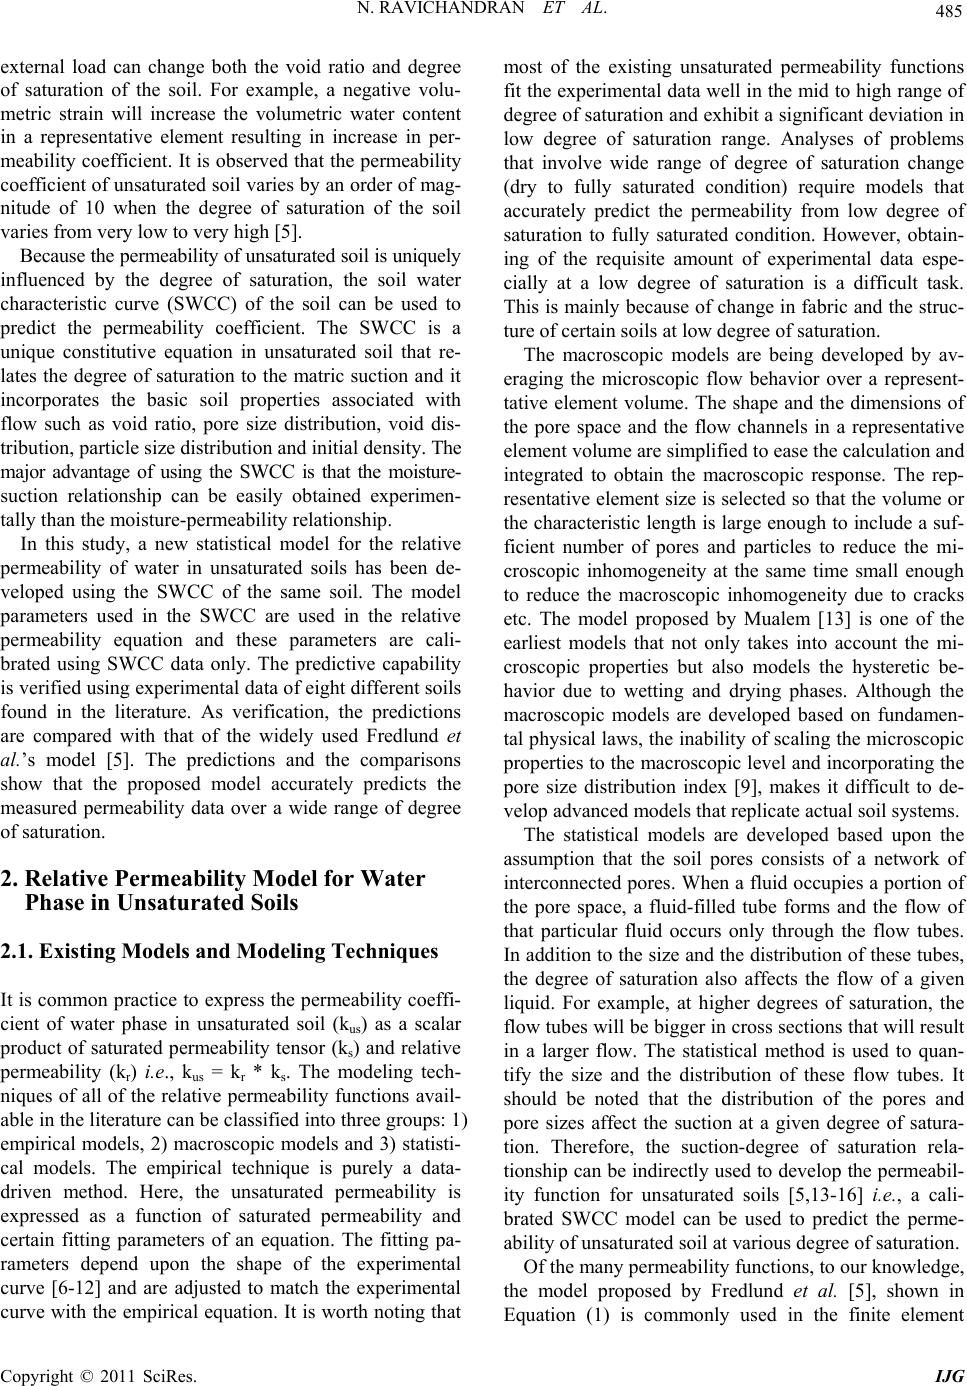 N. RAVICHANDRAN ET AL. Copyright © 2011 SciRes. IJG 485 external load can change both the void ratio and degree of saturation of the soil. For example, a negative volu- metric strain will increase the volumetric water content in a representative element resulting in increase in per- meability coefficient. It is observed that the permeability coefficient of unsaturated soil varies by an order of mag- nitude of 10 when the degree of saturation of the soil varies from very low to very h i gh [5]. Because the permeability of unsaturated soil is uniquely influenced by the degree of saturation, the soil water characteristic curve (SWCC) of the soil can be used to predict the permeability coefficient. The SWCC is a unique constitutive equation in unsaturated soil that re- lates the degree of saturation to the matric suction and it incorporates the basic soil properties associated with flow such as void ratio, pore size distribution, void dis- tribution, particle size distribution and initial density. The major advantage of using the SWCC is that the moisture- suction relationship can be easily obtained experimen- tally than the moisture-permeability relationship. In this study, a new statistical model for the relative permeability of water in unsaturated soils has been de- veloped using the SWCC of the same soil. The model parameters used in the SWCC are used in the relative permeability equation and these parameters are cali- brated using SWCC data only. The predictive capability is verified using experimental data of eight different soils found in the literature. As verification, the predictions are compared with that of the widely used Fredlund et al.’s model [5]. The predictions and the comparisons show that the proposed model accurately predicts the measured permeability data over a wide range of degree of saturation. 2. Relative Permeability Model for Water Phase in Unsaturated Soils 2.1. Existing Models and Modeling Techniques It is common practice to express the permeability coeffi- cient of water phase in unsaturated soil (kus) as a scalar product of saturated permeability tensor (ks) and relative permeability (kr) i.e., kus = kr * ks. The modeling tech- niques of all of the relative permeability functions avail- able in the literature can be classified into three groups: 1) empirical models, 2) macroscopic models and 3) statisti- cal models. The empirical technique is purely a data- driven method. Here, the unsaturated permeability is expressed as a function of saturated permeability and certain fitting parameters of an equation. The fitting pa- rameters depend upon the shape of the experimental curve [6-12] and are adjusted to match the experimental curve with the empirical equation. It is worth noting that most of the existing unsaturated permeability functions fit the experimental data well in the mid to high range of degree of saturation and exhibit a significant deviation in low degree of saturation range. Analyses of problems that involve wide range of degree of saturation change (dry to fully saturated condition) require models that accurately predict the permeability from low degree of saturation to fully saturated condition. However, obtain- ing of the requisite amount of experimental data espe- cially at a low degree of saturation is a difficult task. This is mainly because of change in fabric and the struc- ture of certain soils at low degree of saturation. The macroscopic models are being developed by av- eraging the microscopic flow behavior over a represent- tative element volume. The shape and the dimensions of the pore space and the flow channels in a representative element volume are simplified to ease the calculation and integrated to obtain the macroscopic response. The rep- resentative element size is selected so that the volume or the characteristic length is larg e enough to include a suf- ficient number of pores and particles to reduce the mi- croscopic inhomogeneity at the same time small enough to reduce the macroscopic inhomogeneity due to cracks etc. The model proposed by Mualem [13] is one of the earliest models that not only takes into account the mi- croscopic properties but also models the hysteretic be- havior due to wetting and drying phases. Although the macroscopic models are developed based on fundamen- tal physical laws, the inability of scaling the microscopic properties to the macroscopic level and incorporating the pore size distribution index [9], makes it difficult to de- velop advanced models that replicate actual soil systems. The statistical models are developed based upon the assumption that the soil pores consists of a network of interconnected pores. When a fluid occupies a portion of the pore space, a fluid-filled tube forms and the flow of that particular fluid occurs only through the flow tubes. In addition to the size and the distribution of th ese tubes, the degree of saturation also affects the flow of a given liquid. For example, at higher degrees of saturation, the flow tubes will be bigger in cross sections that will result in a larger flow. The statistical method is used to quan- tify the size and the distribution of these flow tubes. It should be noted that the distribution of the pores and pore sizes affect the suction at a given degree of satura- tion. Therefore, the suction-degree of saturation rela- tionship can be indirectly used to develop the permeabil- ity function for unsaturated soils [5,13-16] i.e., a cali- brated SWCC model can be used to predict the perme- ability of unsaturated soil at various degree of saturation. Of the many permeability functions, to our knowledge, the model proposed by Fredlund et al. [5], shown in Equation (1) is commonly used in the finite element 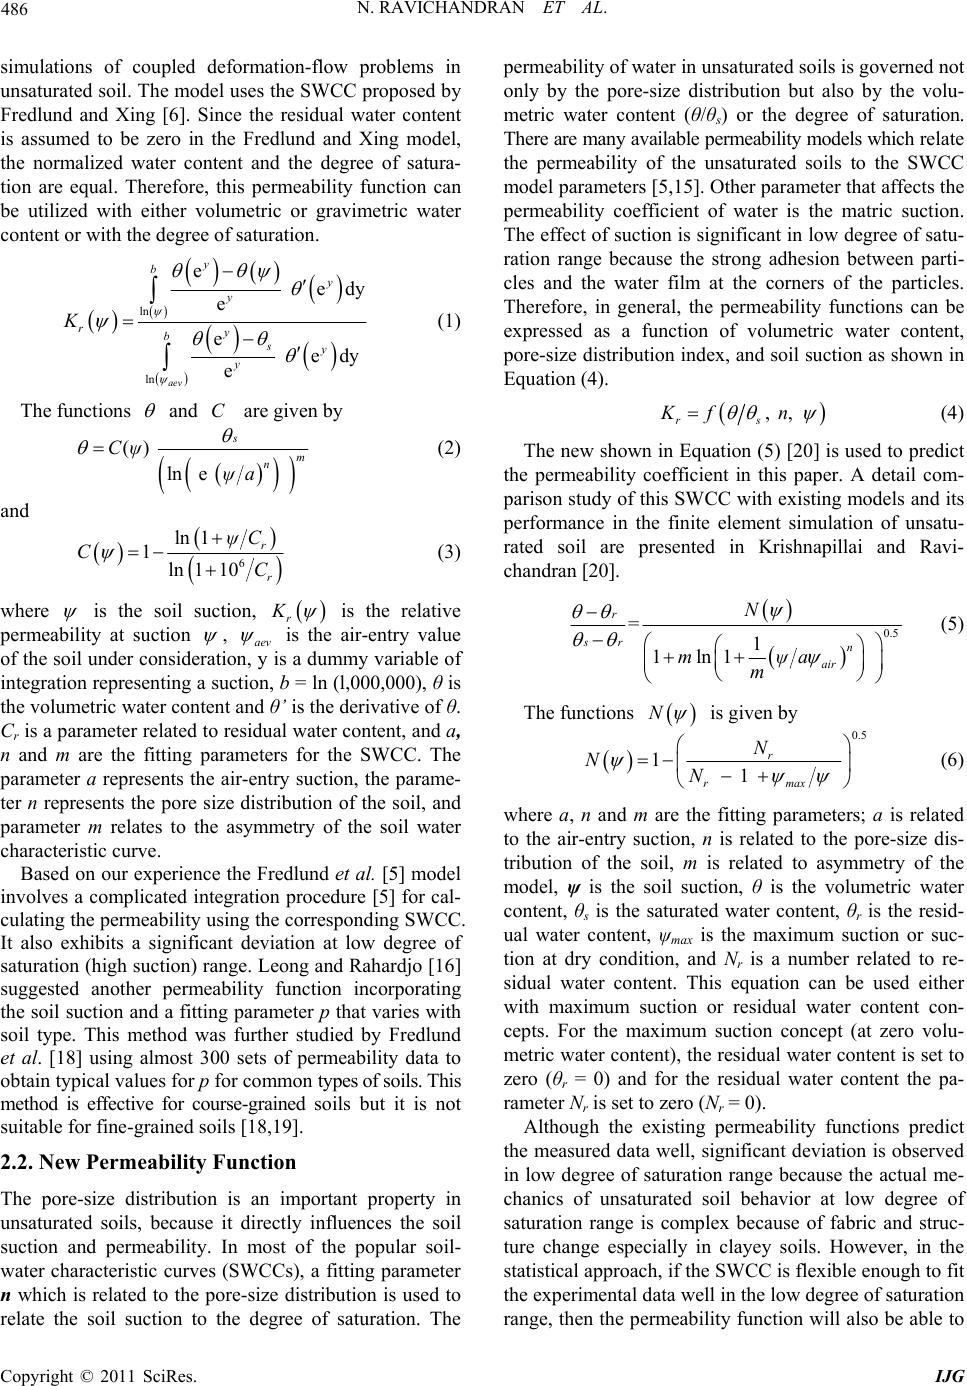 N. RAVICHANDRAN ET AL. Copyright © 2011 SciRes. IJG 486 simulations of coupled deformation-flow problems in unsaturated soil. The model uses the SWCC proposed by Fredlund and Xing [6]. Since the residual water content is assumed to be zero in the Fredlund and Xing model, the normalized water content and the degree of satura- tion are equal. Therefore, this permeability function can be utilized with either volumetric or gravimetric water content or with the degree of saturation. ln ln e edy e e edy e aev y b y y ry bsy y K (1) The functions and C are given by () ln e s m n Cψ ψa (2) and 6 ln 1 1ln 110 r r ψC C C (3) where is the soil suction, r K is the relative permeability at suction , aev is the air-entry value of the soil under consideration, y is a dummy variable of integration representing a su ction, b = ln (l,000,000), θ is the volumetric water content and θ’ is the d erivative of θ. Cr is a parameter related to residual water content, and a, n and m are the fitting parameters for the SWCC. The parameter a represents the air-entry suction, the parame- ter n represents the pore size distribution of the soil, and parameter m relates to the asymmetry of the soil water characteristic curve. Based on our experience the Fredlund et al. [5] model involves a complicated integration procedure [5] for cal- culating the permeability using the correspond ing SWCC. It also exhibits a significant deviation at low degree of saturation (high suction) range. Leong and Rahardjo [16] suggested another permeability function incorporating the soil suction and a fittin g parameter p that varies with soil type. This method was further studied by Fredlund et al. [18] using almost 300 sets of permeability data to obtain typical values fo r p for co mmon types of soils. This method is effective for course-grained soils but it is not suitable for fine-grained soils [18,19]. 2.2. New Permeability Function The pore-size distribution is an important property in unsaturated soils, because it directly influences the soil suction and permeability. In most of the popular soil- water characteristic curves (SWCCs), a fitting parameter n which is related to the pore-size distribution is used to relate the soil suction to the degree of saturation. The permeability of water in unsaturated soils is governed not only by the pore-size distribution but also by the volu- metric water content (θ/θs) or the degree of saturation. There are many available p ermeability models which re l a t e the permeability of the unsaturated soils to the SWCC model parameters [5,15]. Other parameter that affects the permeability coefficient of water is the matric suction. The effect of suction is significant in low degree of satu- ration range because the strong adhesion between parti- cles and the water film at the corners of the particles. Therefore, in general, the permeability functions can be expressed as a function of volumetric water content, pore-size distribution index, and soil suction as shown in Equation (4). , , rs Kf n (4) The new shown in Equation (5) [20] is used to predict the permeability coefficient in this paper. A detail com- parison study of this SWCC with existing models and its performance in the finite element simulation of unsatu- rated soil are presented in Krishnapillai and Ravi- chandran [20]. 0.5 =1 1ln1 r sr n air N m ψa m (5) The functions N is given by 0.5 1 1 r rmax N NN (6) where a, n and m are the fitting parameters; a is related to the air-entry suction, n is related to the pore-size dis- tribution of the soil, m is related to asymmetry of the model, ψ is the soil suction, θ is the volumetric water content, θs is the saturated water content, θr is the resid- ual water content, ψmax is the maximum suction or suc- tion at dry condition, and Nr is a number related to re- sidual water content. This equation can be used either with maximum suction or residual water content con- cepts. For the maximum suction concept (at zero volu- metric water content), the residual water content is set to zero (θr = 0) and for the residual water content the pa- rameter Nr is set to zero (Nr = 0). Although the existing permeability functions predict the measured data well, significant deviation is observed in low degree of saturation range because the actual me- chanics of unsaturated soil behavior at low degree of saturation range is complex because of fabric and struc- ture change especially in clayey soils. However, in the statistical approach, if the SWCC is flexible enough to fit the experimental data well in the low degree of saturation range, then the p ermeability function will also be able to 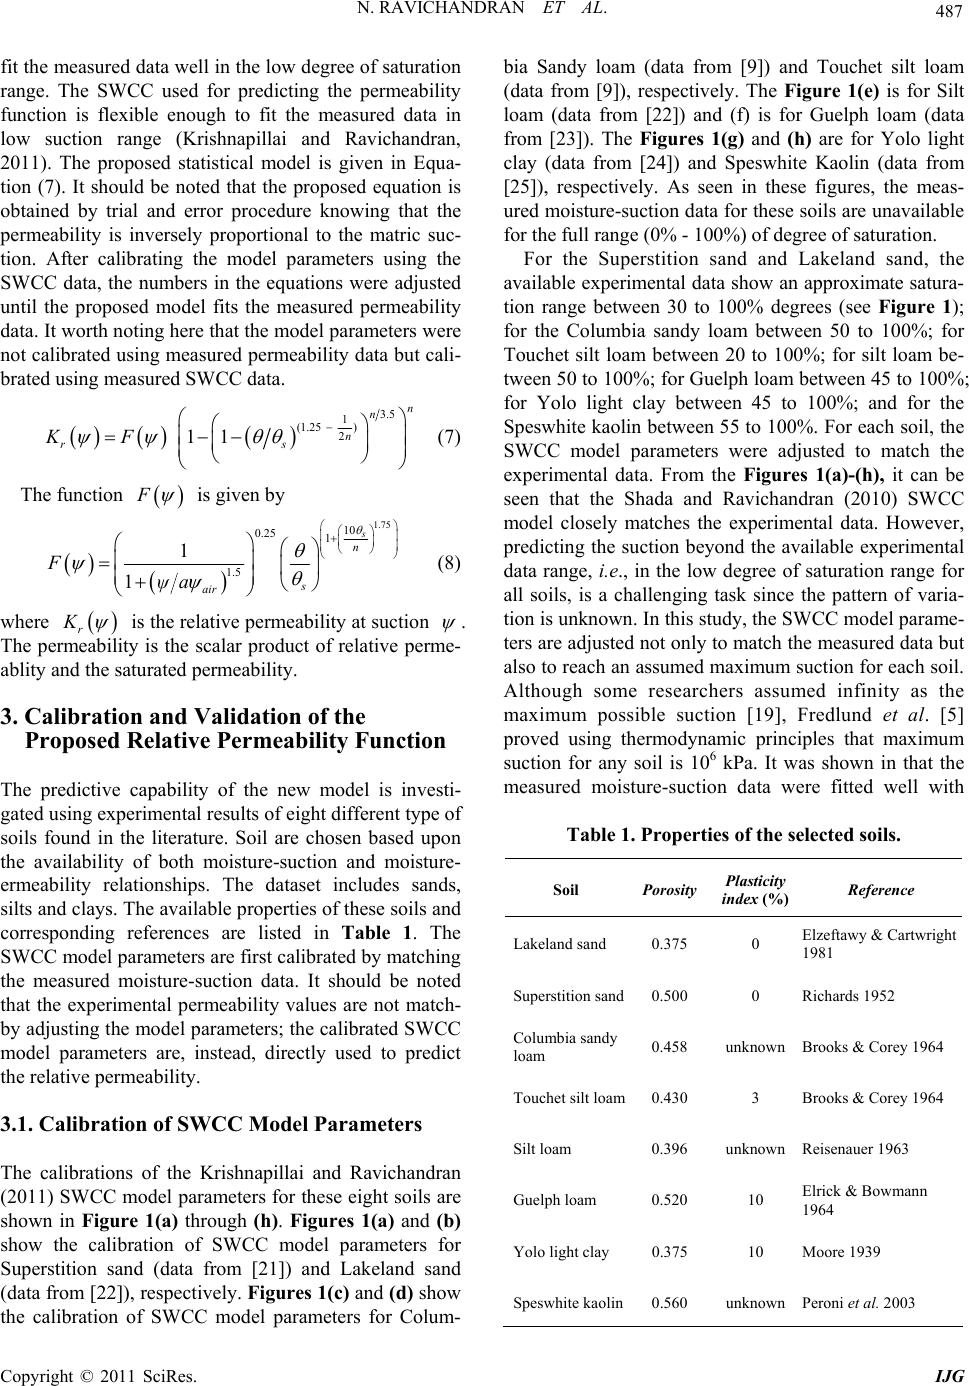 N. RAVICHANDRAN ET AL. Copyright © 2011 SciRes. IJG 487 fit the measured data well in the low d egree of saturation range. The SWCC used for predicting the permeability function is flexible enough to fit the measured data in low suction range (Krishnapillai and Ravichandran, 2011). The proposed statistical model is given in Equa- tion (7). It should be noted that the proposed equation is obtained by trial and error procedure knowing that the permeability is inversely proportional to the matric suc- tion. After calibrating the model parameters using the SWCC data, the numbers in the equations were adjusted until the proposed model fits the measured permeability data. It worth noting here that the model parameters were not calibrated using measured permeability data bu t cali- brated using measured SWCC data. 3.5 1 (1.25 ) 2 11 n n n rs KF (7) The function F is given by 1.75 10 0.25 1 1.5 1 1 s n s air F ψa (8) where r K is the relative permeability at suction . The permeability is the scalar product of relative perme- ablity and the saturated permeability. 3. Calibration and Validation of the Proposed Relative Permeability Function The predictive capability of the new model is investi- gated using experimental results of eight different type of soils found in the literature. Soil are chosen based upon the availability of both moisture-suction and moisture- ermeability relationships. The dataset includes sands, silts and clays. The available properties of these soils and corresponding references are listed in Table 1. The SWCC model parameters are first calibrated by matching the measured moisture-suction data. It should be noted that the experimental permeability values are not match- by adjusting the model parameters; the calibrated SW CC model parameters are, instead, directly used to predict the relative permeability. 3.1. Calibration of SWCC Model Parameters The calibrations of the Krishnapillai and Ravichandran (2011) SWCC model parameters for these eight soils are shown in Figure 1(a) through (h). Figures 1(a) and (b) show the calibration of SWCC model parameters for Superstition sand (data from [21]) and Lakeland sand (data from [22]), respectively. Figures 1(c) and (d) show the calibration of SWCC model parameters for Colum- bia Sandy loam (data from [9]) and Touchet silt loam (data from [9]), respectively. The Figure 1(e) is for Silt loam (data from [22]) and (f) is for Guelph loam (data from [23]). The Figures 1(g) and (h) are for Yolo light clay (data from [24]) and Speswhite Kaolin (data from [25]), respectively. As seen in these figures, the meas- ured moisture-suction d ata for these soils are unavailab le for the full range (0% - 100%) of degree of saturation. For the Superstition sand and Lakeland sand, the available experimental data show an approximate satura- tion range between 30 to 100% degrees (see Figure 1); for the Columbia sandy loam between 50 to 100%; for Touchet silt loam between 20 to 100%; for silt loam be- tween 50 to 100%; for Guelph loam between 45 to 100%; for Yolo light clay between 45 to 100%; and for the Speswhite kaolin between 55 to 100%. For each soil, the SWCC model parameters were adjusted to match the experimental data. From the Figures 1(a)-(h), it can be seen that the Shada and Ravichandran (2010) SWCC model closely matches the experimental data. However, predicting the suction beyond the available experimental data range, i.e., in the low degree of saturation range for all soils, is a challenging task since the pattern of varia- tion is unknown. In this study, the SWCC model parame- ters are adjusted not only to match the measur ed data but also to reach an assumed maximum suction for each soil. Although some researchers assumed infinity as the maximum possible suction [19], Fredlund et al. [5] proved using thermodynamic principles that maximum suction for any soil is 106 kPa. It was shown in that the measured moisture-suction data were fitted well with Table 1. Properties of the selected soils. Soil Porosity Plasticity index (%) Reference Lakeland sand 0.375 0 Elzeftawy & Cartwright 1981 Superstition sand0.500 0 Richards 1952 Columbia sandy loam 0.458 unknown Brooks & Corey 1964 Touchet silt loam0.430 3 Brooks & Corey 1964 Silt loam 0.396 unknown Reisenauer 1963 Guelph loam 0.520 10 Elrick & Bowmann 1964 Yolo light clay 0.375 10 Moore 1939 Speswhite kaolin0.560 unknown Peroni et al. 2003 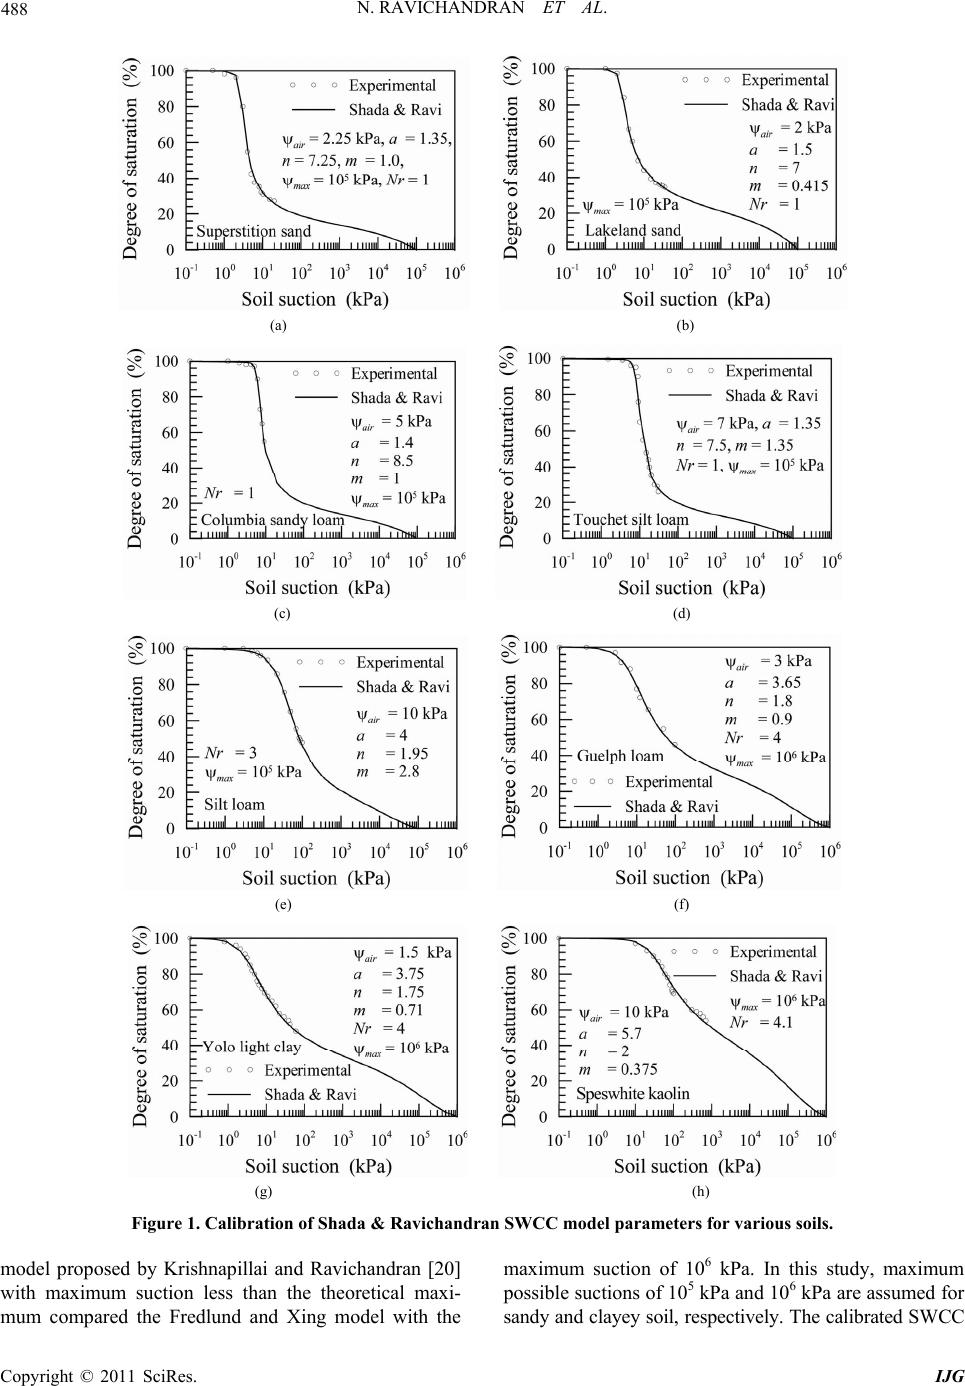 N. RAVICHANDRAN ET AL. Copyright © 2011 SciRes. IJG 488 (a) (b) (c) (d) (e) (f) (g) (h) Figure 1. Calibration of Shada & Ravichandran SWCC model parameters for various soils. model proposed by Krishnapillai and Ravichandran [20] with maximum suction less than the theoretical maxi- mum compared the Fredlund and Xing model with the maximum suction of 106 kPa. In this study, maximum possible suctions of 105 kPa and 1 06 kPa are assu med fo r sandy and clayey soil, respectively. The calibrated SWCC 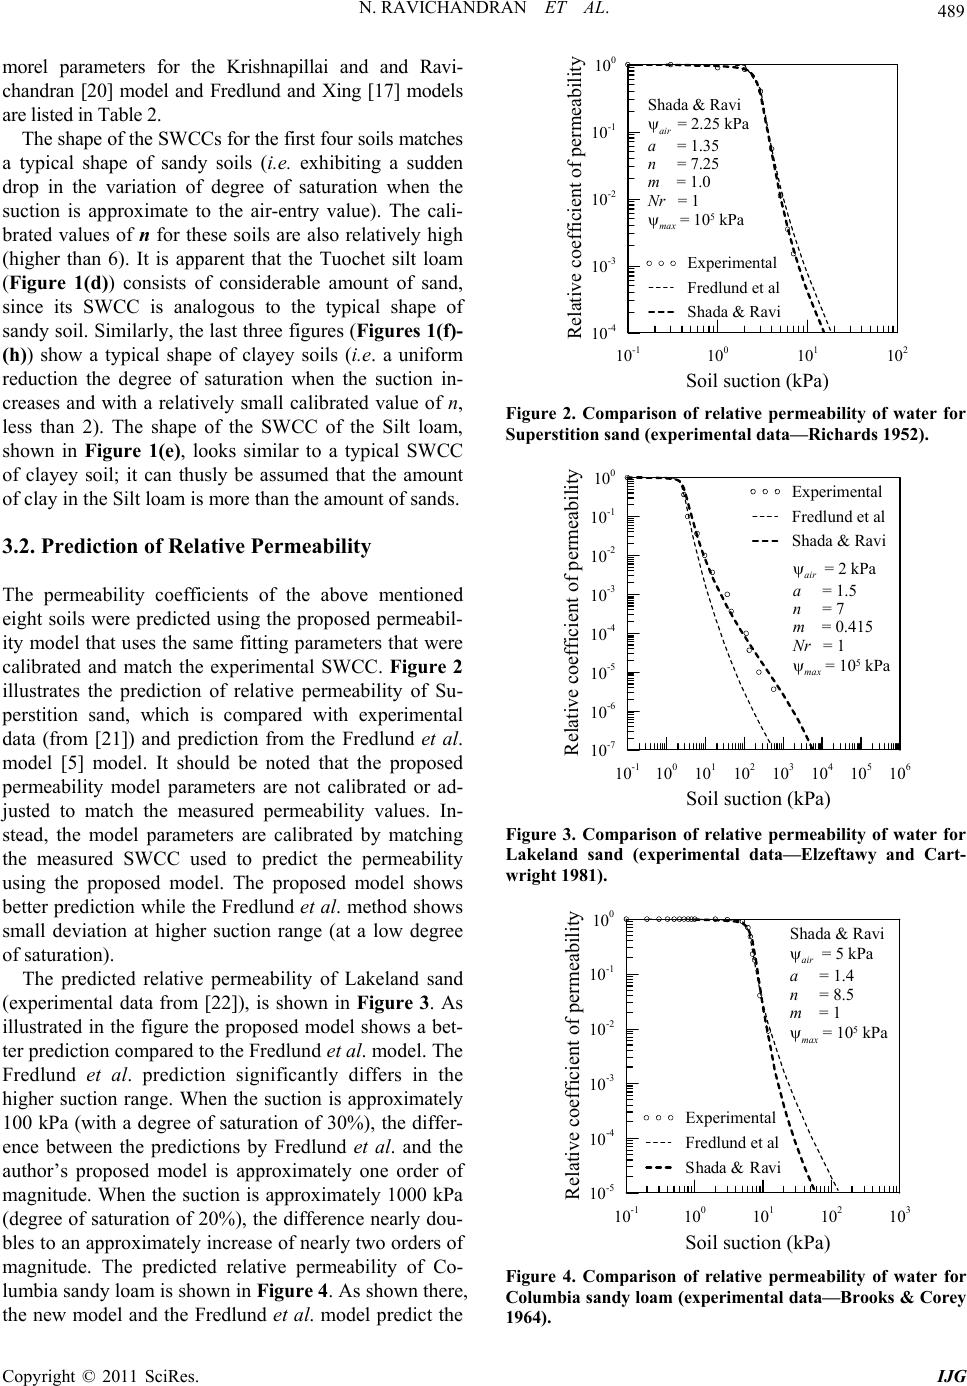 N. RAVICHANDRAN ET AL. Copyright © 2011 SciRes. IJG 489 morel parameters for the Krishnapillai and and Ravi- chandran [20] model and Fredlund and Xing [17] models are listed in Table 2. The shape of the SWCCs for the first four soils matches a typical shape of sandy soils (i.e. exhibiting a sudden drop in the variation of degree of saturation when the suction is approximate to the air-entry value). The cali- brated values of n for these soils are also relatively high (higher than 6). It is apparent that the Tuochet silt loam (Figure 1(d)) consists of considerable amount of sand, since its SWCC is analogous to the typical shape of sandy soil. Similarly, the last three figures (Figures 1(f)- (h)) show a typical shape of clayey soils (i.e. a uniform reduction the degree of saturation when the suction in- creases and with a relatively small calibrated value of n, less than 2). The shape of the SWCC of the Silt loam, shown in Figure 1(e), looks similar to a typical SWCC of clayey soil; it can thusly be assumed that the amount of clay in the Silt loam is more than the amount of sands. 3.2. Prediction of Relative Permeability The permeability coefficients of the above mentioned eight soils were predicted using the proposed permeabil- ity model that uses th e same fitting parameters that were calibrated and match the experimental SWCC. Figure 2 illustrates the prediction of relative permeability of Su- perstition sand, which is compared with experimental data (from [21]) and prediction from the Fredlund et al. model [5] model. It should be noted that the proposed permeability model parameters are not calibrated or ad- justed to match the measured permeability values. In- stead, the model parameters are calibrated by matching the measured SWCC used to predict the permeability using the proposed model. The proposed model shows better prediction while the Fred lund et al. method shows small deviation at higher suction range (at a low degree of saturation). The predicted relative permeability of Lakeland sand (experimental data from [22]), is shown in Figure 3. As illustrated in the figure the proposed model shows a bet- ter prediction co mpared to the Fred lund et al. model. The Fredlund et al. prediction significantly differs in the higher suction range. When the suction is approximately 100 kPa (with a degree of saturation of 30%), the differ- ence between the predictions by Fredlund et al. and the author’s proposed model is approximately one order of magnitude. When the suction is approximately 1000 kPa (degree of saturation of 20%), the difference nearly dou- bles to an approximately increase of nearly two orders of magnitude. The predicted relative permeability of Co- lumbia sandy loam is shown in Figure 4. As shown there, the new model and the Fredlund et al. model predict the 10 -1 10 0 10 1 10 2 Soilsuction ( k Pa ) 10 -4 10 -3 10 -2 10 -1 10 0 Relative coefficient of pe r meability Experimental Fredlu nd et al Shada & Ravi Shada & Ravi air = 2.25 kPa a = 1.35 n = 7.25 m = 1.0 Nr = 1 max = 10 5 kPa Figure 2. Comparison of relative permeability of water for Superstition sand (experimental data—Richards 1952). 10 -1 10 0 10 1 10 2 10 3 10 4 10 5 10 6 Soil suc tion (kPa) 10 -7 10 -6 10 -5 10 -4 10 -3 10 -2 10 -1 10 0 R elative coefficient of pe r meability Experimental Fredlund et al Shada & Ravi air = 2 kPa a = 1.5 n = 7 m = 0.415 Nr = 1 max = 10 5 kPa Figure 3. Comparison of relative permeability of water for Lakeland sand (experimental data—Elzeftawy and Cart- wright 1981). 10 -1 10 0 10 1 10 2 10 3 Soilsuction ( k Pa) 10 -5 10 -4 10 -3 10 -2 10 -1 10 0 R elative coefficient of pe r meability Experimental Fredlund et al Sh ad a & R av i Shada & Rav i air = 5 kPa a = 1.4 n = 8.5 m = 1 max = 10 5 kPa Figure 4. Comparison of relative permeability of water for Columbia sandy loam (experimental data—Brooks & Corey 1964). 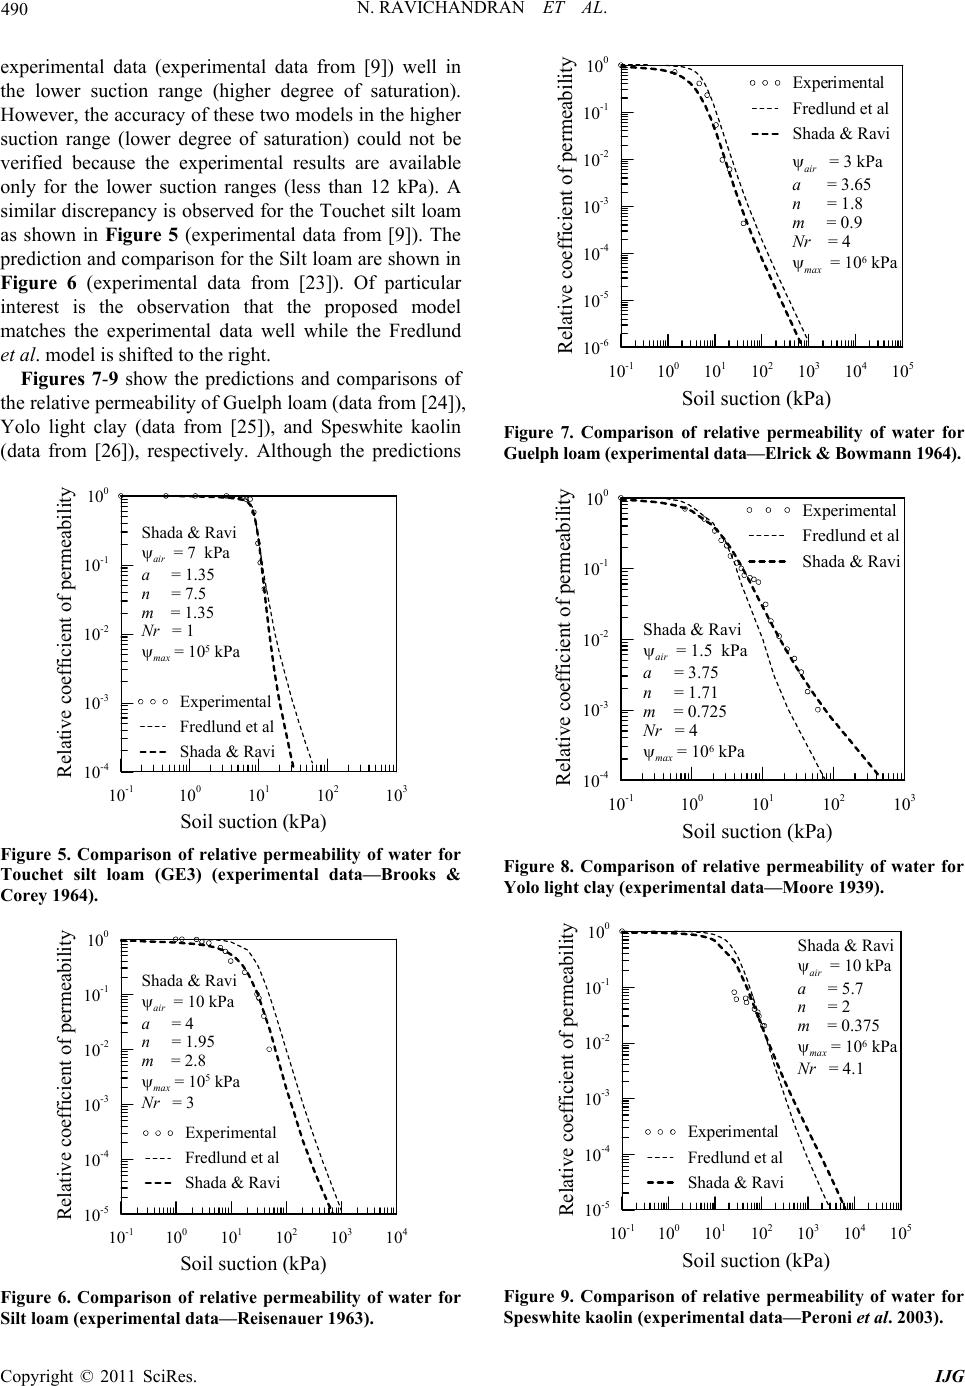 N. RAVICHANDRAN ET AL. Copyright © 2011 SciRes. IJG 490 experimental data (experimental data from [9]) well in the lower suction range (higher degree of saturation). However, the accuracy of these two models in the higher suction range (lower degree of saturation) could not be verified because the experimental results are available only for the lower suction ranges (less than 12 kPa). A similar discrepancy is observed for the To uchet silt loam as shown in Figure 5 (experimental data from [9]). The prediction and co mparison for the Silt loam are shown in Figure 6 (experimental data from [23]). Of particular interest is the observation that the proposed model matches the experimental data well while the Fredlund et al. model is shifted to the right. Figures 7-9 show the predictions and comparisons of the relative permeability of Gu elph loam (data from [24]), Yolo light clay (data from [25]), and Speswhite kaolin (data from [26]), respectively. Although the predictions 10 -1 10 0 10 1 10 2 10 3 Soil suction ( k P a ) 10 -4 10 -3 10 -2 10 -1 10 0 Relative coefficient of pe r meability Experimental Fredlund et al Shada & Ravi Shada & Ravi air = 7 kPa a = 1.35 n = 7.5 m = 1.35 Nr = 1 max = 10 5 kPa Figure 5. Comparison of relative permeability of water for Touchet silt loam (GE3) (experimental data—Brooks & Corey 1964). 10 -1 10 0 10 1 10 2 10 3 10 4 Soil suction ( k Pa ) 10 -5 10 -4 10 -3 10 -2 10 -1 10 0 Relative coefficient of pe r meability Experimental Fredlund et al Shada & Ravi Shada & Ravi air = 10 kPa a = 4 n = 1.95 m = 2.8 max = 10 5 kPa Nr = 3 Figure 6. Comparison of relative permeability of water for Silt loam (experimental data—Reisenauer 1963). 10 -1 10 0 10 1 10 2 10 3 10 4 10 5 Soilsuction ( kP a ) 10 -6 10 -5 10 -4 10 -3 10 -2 10 -1 10 0 Relative coefficient of pe r meability Experimental Fredlund et al Shad a & Ravi air = 3 kPa a = 3.65 n = 1.8 m = 0.9 Nr = 4 max = 10 6 kPa Figure 7. Comparison of relative permeability of water for Guelph loam (experimental data—Elrick & Bowmann 1964). 10 -1 10 0 10 1 10 2 10 3 Soil suction (kPa) 10 -4 10 -3 10 -2 10 -1 10 0 Rela t ive coefficien t of pe r meabili t y Experimental Fredlund et al Shada & Ravi Shada & Ravi air = 1.5 kPa a = 3.75 n = 1.71 m = 0.725 Nr = 4 max = 10 6 kPa Figure 8. Comparison of relative permeability of water for Yolo light clay (experimental data—Moore 1939). 10 -1 10 0 10 1 10 2 10 3 10 4 10 5 Soil suction (kPa) 10 -5 10 -4 10 -3 10 -2 10 -1 10 0 Relative coeff icient of pe r meability Experimental Fredlund et al Shada & Ravi Shada & Ravi air = 10 kPa a = 5.7 n = 2 m = 0.375 max = 10 6 kPa Nr = 4.1 Figure 9. Comparison of relative permeability of water for Speswhite kaolin (exper imental data—Peroni et al. 2003). 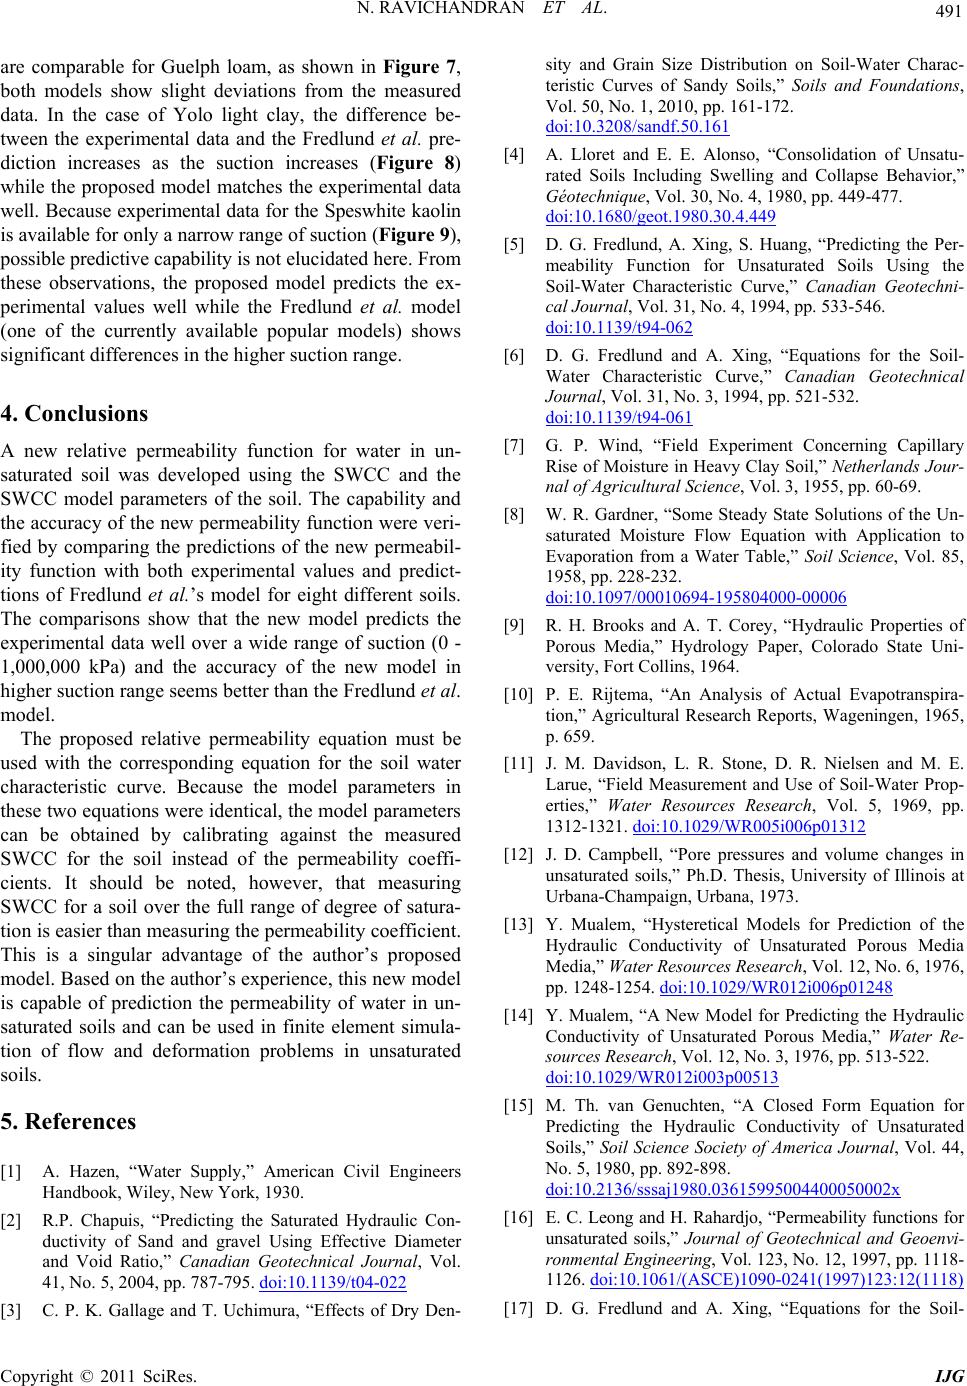 N. RAVICHANDRAN ET AL. Copyright © 2011 SciRes. IJG 491 are comparable for Guelph loam, as shown in Figure 7, both models show slight deviations from the measured data. In the case of Yolo light clay, the difference be- tween the experimental data and the Fredlund et al. pre- diction increases as the suction increases (Figure 8) while the proposed model matches the experimental data well. Because experimental data for the Speswhite kaolin is available for only a narrow range of suction (Figure 9), possible predictive capability is not elucidated here. From these observations, the proposed model predicts the ex- perimental values well while the Fredlund et al. model (one of the currently available popular models) shows significant differences in the higher suction range. 4. Conclusions A new relative permeability function for water in un- saturated soil was developed using the SWCC and the SWCC model parameters of the soil. The capability and the accuracy of the new permeability fun ction were veri- fied by comparing the predictions of the new permeabil- ity function with both experimental values and predict- tions of Fredlund et al.’s model for eight different soils. The comparisons show that the new model predicts the experimental data well over a wide range of suction (0 - 1,000,000 kPa) and the accuracy of the new model in higher suction range seems better than th e Fredlun d et al. model. The proposed relative permeability equation must be used with the corresponding equation for the soil water characteristic curve. Because the model parameters in these two equations were identical, the model parameters can be obtained by calibrating against the measured SWCC for the soil instead of the permeability coeffi- cients. It should be noted, however, that measuring SWCC for a soil over the full range of degree of satura- tion is easier than measuring the permeability coefficient. This is a singular advantage of the author’s proposed model. Based on the author’s experience, this new model is capable of prediction the permeability of water in un- saturated soils and can be used in finite element simula- tion of flow and deformation problems in unsaturated soils. 5. References [1] A. Hazen, “Water Supply,” American Civil Engineers Handbook, Wiley, New York, 1930. [2] R.P. Chapuis, “Predicting the Saturated Hydraulic Con- ductivity of Sand and gravel Using Effective Diameter and Void Ratio,” Canadian Geotechnical Journal, Vol. 41, No. 5, 2004, pp. 787-795. doi:10.1139/t04-022 [3] C. P. K. Gallage and T. Uchimura, “Effects of Dry Den- sity and Grain Size Distribution on Soil-Water Charac- teristic Curves of Sandy Soils,” Soils and Foundations, Vol. 50, No. 1, 2010, pp. 161-172. doi:10.3208/sandf.50.161 [4] A. Lloret and E. E. Alonso, “Consolidation of Unsatu- rated Soils Including Swelling and Collapse Behavior,” Géotechnique, Vol. 30, No. 4, 1980, pp. 449-477. doi:10.1680/geot.1980.30.4.449 [5] D. G. Fredlund, A. Xing, S. Huang, “Predicting the Per- meability Function for Unsaturated Soils Using the Soil-Water Characteristic Curve,” Canadian Geotechni- cal Journal, Vol. 31, No. 4, 1994, pp. 533-546. doi:10.1139/t94-062 [6] D. G. Fredlund and A. Xing, “Equations for the Soil- Water Characteristic Curve,” Canadian Geotechnical Journal, Vol. 31, No. 3, 1994, pp. 521-532. doi:10.1139/t94-061 [7] G. P. Wind, “Field Experiment Concerning Capillary Rise of Moisture in Heavy Clay Soil,” Netherlands Jour- nal of Agricultural Science, Vol. 3, 1955, pp. 60-69. [8] W. R. Gardner, “Some Steady State Solutions of the Un- saturated Moisture Flow Equation with Application to Evaporation from a Water Table,” Soil Science, Vol. 85, 1958, pp. 228-232. doi:10.1097/00010694-195804000-00006 [9] R. H. Brooks and A. T. Corey, “Hydraulic Properties of Porous Media,” Hydrology Paper, Colorado State Uni- versity, Fort Collins, 1964. [10] P. E. Rijtema, “An Analysis of Actual Evapotranspira- tion,” Agricultural Research Reports, Wageningen, 1965, p. 659. [11] J. M. Davidson, L. R. Stone, D. R. Nielsen and M. E. Larue, “Field Measurement and Use of Soil-Water Prop- erties,” Water Resources Research, Vol. 5, 1969, pp. 1312-1321. doi:10.1029/WR005i006p01312 [12] J. D. Campbell, “Pore pressures and volume changes in unsaturated soils,” Ph.D. Thesis, University of Illinois at Urbana-Champaign, Urbana, 1973. [13] Y. Mualem, “Hysteretical Models for Prediction of the Hydraulic Conductivity of Unsaturated Porous Media Media,” Water Resources Research, Vol. 12, No. 6, 1976, pp. 1248-1254. doi:10.1029/WR012i006p01248 [14] Y. Mualem, “A New Model for Predicting the Hydraulic Conductivity of Unsaturated Porous Media,” Water Re- sources Research, Vol. 12, No. 3, 1976, pp. 513-522. doi:10.1029/WR012i003p00513 [15] M. Th. van Genuchten, “A Closed Form Equation for Predicting the Hydraulic Conductivity of Unsaturated Soils,” Soil Science Society of America Journal, Vol. 44, No. 5, 1980, pp. 892-898. doi:10.2136/sssaj1980.03615995004400050002x [16] E. C. Leong and H. Rahardjo, “Permeability functions for unsaturated soils,” Journal of Geotechnical and Geoenvi- ronmental Engineering, Vol. 123, No. 12, 1997, pp. 1118- 1126. doi:10.1061/(ASCE)1090-0241(1997)123:12(1118) [17] D. G. Fredlund and A. Xing, “Equations for the Soil-  N. RAVICHANDRAN ET AL. Copyright © 2011 SciRes. IJG 492 Water Characteristic Curve,” Canadian Geotechnical Journal, Vol. 31, No. 4, 1994, pp. 533-546. doi:10.1139/t94-062 [18] D. G. Fredlund, M. D. Fredlund and N. Zakerzadeh, “Pre- dicting the Permeability Function for Unsaturated Soils,” International Conference on Clays and Clay Minerology, Shioukoza, 11-13 January 2001, pp. 215-222. [19] J. P. Lobbezoo and S. K. Vanapalli, “A Simple Tech- nique for Estimating the Coefficient of Permeability of Unsaturated Soils,” Proceedings of the 55th Canadian Geotechnical Conference, Niagra Falls, 2002. [20] H. K. Shada and N. Ravichandran, “New Soil-Water Characteristic Curve and Its Performance in Finite Ele- ment Simulation of Unsaturated Soils,” International Journal of Geomechanics, accepted with minor revision, October 2010. [21] L. A. Richards, “Water Conducting and Retaining Prop- erties of Soils in Relation to Irrigation,” Proceedings of International Symposium on Desert Research, Jerusalem. 1952, pp. 523-546. [22] A. Elzeftaw and K. Cartwright, “Evaluating the Saturated and Unsaturated Hydraulic Conductivity of Soils,” ASTM Standards and Engineering Digital Library, West Con- shohocken, 1981, pp. 168-181. doi:10.1520/STP28323S [23] A. E. Reisenaue, “Methods for Solving Problems of Multi-Dimensional Partially Saturated Steady Flow in Soils,” Journal of Geophysical Research, Vol. 68, No. 20, 1963, pp. 5725-5733. [24] D. E. Elrick and D. H. Bowman, “Note on an improved apparatus for soil moisture flow measurements,” Soil Sci- ence Society of America Proceedings, Vol. 28, 1964, pp. 450-453.doi:10.2136/sssaj1964.03615995002800 030045x [25] R. E. Moore, “Water Conduction from Shallow Water Tables,” University of California, Berkeley, 19377, pp. 383-426. [26] N. Peroni, E. Fratalocchi and A. Tarantino, “Water Per- meability of Unsaturated Compacted Kaolin,” Proceed- ings of the International Conference, Weimar, 18-19 Sep- tember 2003. |