Paper Menu >>
Journal Menu >>
 International Journal of Geosciences, 2011, 2, 562-572 doi:10.4236/ijg.2011.24059 Published Online November 2011 (http://www.SciRP.org/journal/ijg) Copyright © 2011 SciRes. IJG Assessment of the Moroccan Mediterranean Coasts Contamination by Hydrocarbons (Non Aromatic Hydrocarbons, Aromatic Hydrocarbons and Linear Alkylbenzenes) Saida Bouzid1*, Soumaya Khannous1, Ioanna Bouloubassi2, Alain Saliot2, Hassan Er Raioui1 1Equipe Géosciences et Environnement, Département des Sciences de la Terre, Faculté des Sciences et Techniques à Tanger, Ancienne route de l’aviation, Tanger, Maroc 2LOCEAN-IPSL, UMR 7159, CNRS/IRD/UPMC/MNHN, Université Pierre et Marie Curie, Paris, France E-mail: sur24@yahoo.fr Received April 6, 2011; revised August 16, 2011; accepted September 28, 2011 Abstract In order to evaluate the contamination of the Moroccan Mediterranean coasts by persistent organic pollutants we studied hydrocarbons and linear alkylbenzenes in bivalve tissues (cockles) collected seasonally from sev- eral points along the western Moroccan coasts in the Mediterranean Sea. Two fractions corresponding to non aromatic and aromatic hydrocarbons were analyzed by GC/FID and GC/MS. Non aromatic hydrocarbon concentrations vary in the range of 24.1 - 2731 μg/g dry weight (dw) while total n-alkanes vary from 2.2 to 68.2 μg/g. Few exceptions were noted with values up to 243 μg/g (dw), which is high compared to other Mediterranean sites. The presence of an important unresolved complex mixture (UCM) indicated a signifi- cant petroleum contamination, confirmed by the identification of 17α(H), 21β(H) hopanes. Biogenic contribu- tions were also detected within the n-alkane distribution (n-C17, n-C18, n-C27, n-C29, n-C17/Pr, n-C18/Ph) and by the presence of alkenes. C13 and C14 linear alkylbenzenes were found at concentrations of 478 - 1954 ng/g. and point to pollutant inputs from wastewaters. Polycyclic aromatic hydrocarbons were present in low con- centrations below the GC detection limit. The observed seasonal and spatial variations were linked to the magnitude of inputs from marine and land-based pollutant discharges. Keywords: Western Moroccan Mediterranean Coast, Bivalves Contamination, Gas Chromatography, Hydrocarbons, Biogeochemical Markers, Petrogenic and Biogenic Origins 1. Introduction Among persistent organic pollutants, hydrocarbons are the most ubiquitous organic contaminants in the marine environment, often at a high level in areas submitted to intense ship traffic and in semi-enclosed seas [1]. In the Mediterranean Sea, Burns and Saliot [2] estimated that over three quarters of a million tonnes of oil were intro- duced annually into the Mediterranean Sea from land- based and open-sea discharges. Compared with updated estimates of oil inputs to the world’s oceans [3], the Mediterranean would receive about 24% of the NAS “best reasonable estimate”, although representing about 1% of the world’s ocean surface. Many studies of petrogenic and pyrolytic hydrocarbon contamination have been carried out in the northwestern Mediterranean coasts, especially in sediment and biota samples [4-7]. But there is a tremendous lack of informa- tion regarding the southern Mediterranean, except for the Algerian [8], Tunisian [9,10] and Egyptian coasts [11]. The western Moroccan Mediterranean coasts have been investigated by a preliminary study [12], which remains very incomplete. These coasts are well known for tour- ism, fisheries and industrial activities. They receive high inputs of organic matter mostly anthropogenic, from ship traffic discharges, untreated sewage and wastewater dis- charges. But the level of contamination is still unknown. The MYTILOS project, initiated in 2003 (for a duration of 3 years), was focused on the realization of a surveil- lance network of onshore waters of the western Mediter- 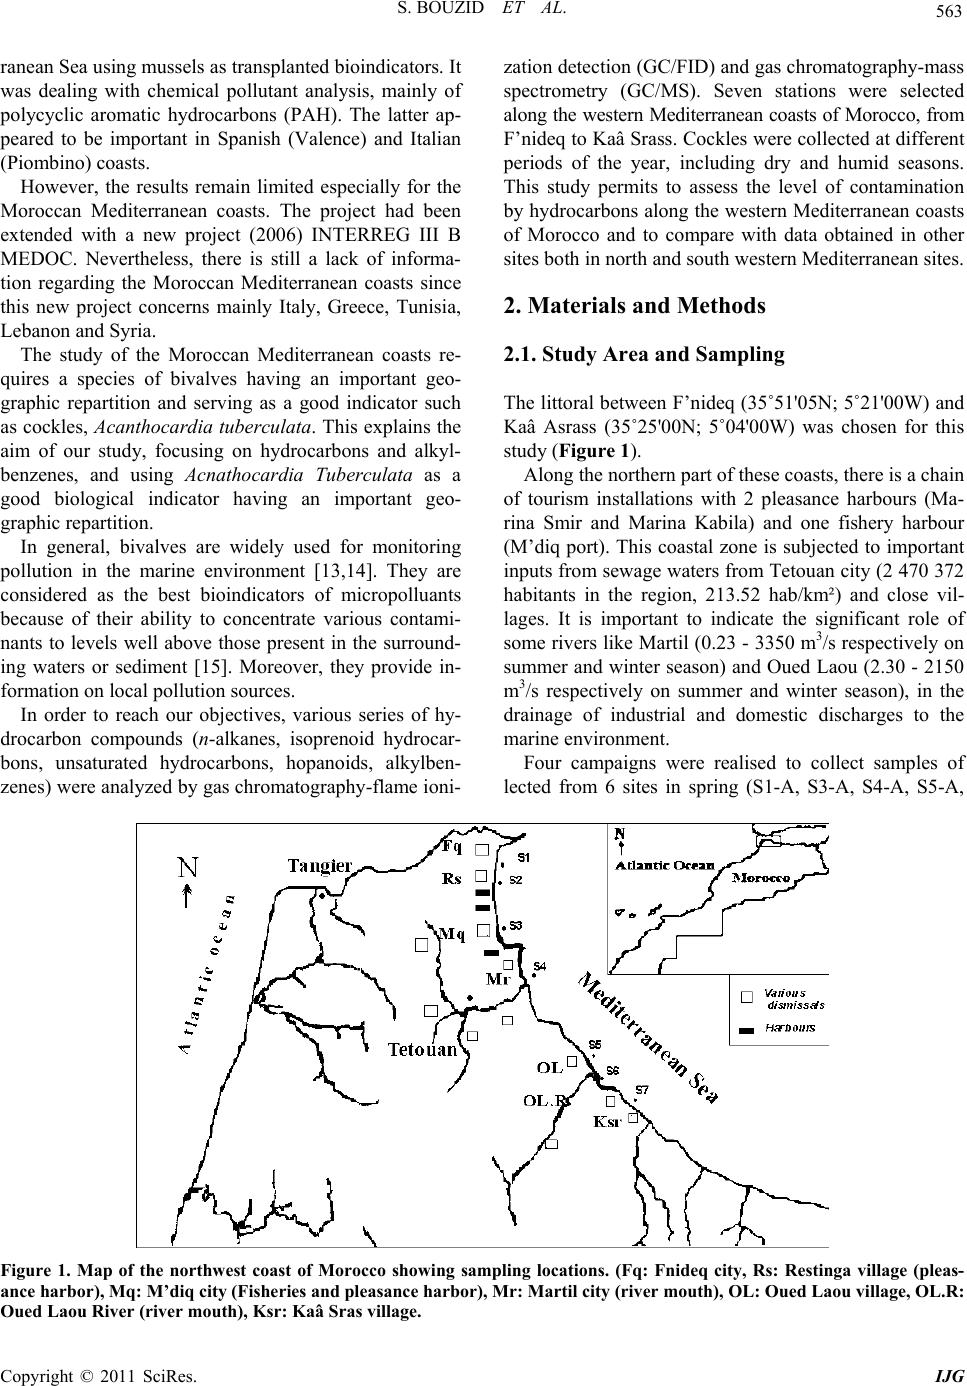 S. BOUZID ET AL. Copyright © 2011 SciRes. IJG 563 ranean Sea using mussels as transplanted bioindicators. It was dealing with chemical pollutant analysis, mainly of polycyclic aromatic hydrocarbons (PAH). The latter ap- peared to be important in Spanish (Valence) and Italian (Piombino) coasts. However, the results remain limited especially for the Moroccan Mediterranean coasts. The project had been extended with a new project (2006) INTERREG III B MEDOC. Nevertheless, there is still a lack of informa- tion regarding the Moroccan Mediterranean coasts since this new project concerns mainly Italy, Greece, Tunisia, Lebanon and Syria. The study of the Moroccan Mediterranean coasts re- quires a species of bivalves having an important geo- graphic repartition and serving as a good indicator such as cockles, Acanthocardia tuberculata. This explains the aim of our study, focusing on hydrocarbons and alkyl- benzenes, and using Acnathocardia Tuberculata as a good biological indicator having an important geo- graphic repartition. In general, bivalves are widely used for monitoring pollution in the marine environment [13,14]. They are considered as the best bioindicators of micropolluants because of their ability to concentrate various contami- nants to levels well above those present in the surround- ing waters or sediment [15]. Moreover, they provide in- formation on local pollution sources. In order to reach our objectives, various series of hy- drocarbon compounds (n-alkanes, isoprenoid hydrocar- bons, unsaturated hydrocarbons, hopanoids, alkylben- zenes) were analyzed by gas chromatography-flame ioni- zation detection (GC/FID) and gas chromatography-mass spectrometry (GC/MS). Seven stations were selected along the western Mediterranean coasts of Morocco, from F’nideq to Kaâ Srass. Cockles were collected at different periods of the year, including dry and humid seasons. This study permits to assess the level of contamination by hydrocarbons along the western Mediterranean coasts of Morocco and to compare with data obtained in other sites both in north and south western Mediterranean sites. 2. Materials and Methods 2.1. Study Area and Sampling The littoral between F’nideq (35˚51'05N; 5˚21'00W) and Kaâ Asrass (35˚25'00N; 5˚04'00W) was chosen for this study (Figure 1). Along the northern part of these coasts, there is a chain of tourism installations with 2 pleasance harbours (Ma- rina Smir and Marina Kabila) and one fishery harbour (M’diq port). This coastal zone is subjected to important inputs from sewage waters from Tetouan city (2 470 372 habitants in the region, 213.52 hab/km²) and close vil- lages. It is important to indicate the significant role of some rivers like Martil (0.23 - 3350 m3/s respectively on summer and winter season) and Oued Laou (2.30 - 2150 m3/s respectively on summer and winter season), in the drainage of industrial and domestic discharges to the marine environment. Four campaigns were realised to collect samples of lected from 6 sites in spring (S1-A, S3-A, S4-A, S5-A, Figure 1. Map of the northwest coast of Morocco showing sampling locations. (Fq: Fnideq city, Rs: Restinga village (pleas- ance harbor), Mq: M’diq city (Fisheries and pleasance harbor), Mr: Martil city (river mouth), OL: Oued Laou village, OL.R: Oued Laou River (river mouth), Ksr: Kaâ Sras village.  S. BOUZID ET AL. Copyright © 2011 SciRes. IJG 564 S6-A, S7-A), from 7 sites in summer (S1-B, S2-B, S3-B, S4-B, S5-B, S6-B, S7-B), from 6 sites in autumn (S1-C, S2-C, S4-C, S5-C, S6-C, S7-C), and from 5 sites in win- ter (S3-D, S4-D, S5-D, S6-D, S7-D) (Figure 1). 2.2. Extraction and Analysis of Hydrocarbons Entire organism tissues were crushed, freeze-dried and soxhlet extracted (5 g) with methanol for 10 h. Per- deuterated internal standards (n-C24D50 and p-terphenyl- D14) were added before the extraction. The saponification of the lipid extract was performed with KOH/distilled water (0.7N) for 2 h. Afterwards, liquid/liquid extraction was made with n-hexane 3 times. The lipid extract was concentrated and separated by column chromatography on neutral alumina/silica (v:v) (5% deactivated). Aliphatic hyrocarbons (F1) were eluted with 20 ml n-hexane and polycyclic aromatic hy- drocarbons (F2) with 20 ml (9:1, v/v) then 30 ml (7:3, v/v) hexane/dichloromethane. Both fractions were con- centrated under vacuum evaporation to dryness and then redissolved in 50 µl of n-hexane prior to the analysis by gas chromatography. 2.3. GC/FID and GC/MS The quantitative analysis of hydrocarbons was carried out using a HP6890 Agilent chromatograph equipped with a flame ionization detector. F1 fraction was injected on a fused silica capillary column DB-5MS (J&W, 30 m, 0.25 µm), using Helium as carrier gas. The oven tem- perature program used was: 60˚C, raised to 100°C at a rate of 25°C/min, and to 310°C at 2°C/min, with an iso- therm of 70 min at 310°C. Hydrocarbons were identified by comparison of reten- tion times with known standards. of n-alkanes, ranging from n-C15 to n-C32. To confirm the structure of hydro- carbon compounds, selected samples were also analysed by gas chromatography-mass spectrometry. The GC/MS analysis was carried out on a HP6890 GC coupled to a HP5973 Mass Selective Detector, equipped with a DB- 5MS fused-silica column (J&W, 30 m, 0.25 mm i.d., 0.25 µm film thickness). Helium was used as carrier gas. The oven temperature program employed was the same as in GC/ FID. 3. Results and Discussion 3.1. Fraction 1 This fraction corresponds to non aromatic hydrocarbons (NAH). They are composed of normal and isoprenoid alkanes, alkenes, hopanoids and an envelope of unre- solved complex mixture (UCM). They were present in all samples. The total NAH concentrations range from 24.1 to 2731 µg/g dry weight (dw) (Table 1), being maxi- mized at S4 station, which is located off the mouth of Martil river. This latter is well known for being a major source of pollution in the area. The comparison of our results with those obtained for bivalve organisms in other studies proves to be difficult for two major reasons: first, the species used in almost all studies dealing with hydrocarbon contamination are not the same and second, NAH concentrations have not been reported in any of these studies. Concentrations generally reported are the sum of total n-alkanes. This can facili- tate the comparison; nevertheless it can also underesti- mate the bulk amounts of NAH. 3.1.1. n-Alkanes Concentrations of total n-alkanes vary between 2.2 and 68.2 µg/g dw (Table 1), with few exceptions recorded for some sites such as S4 station (A: 169.8 µg/g and D: 97.4 µg/g) and S3 station (C: 243 µg/g). In comparison with other studies dealing with NAH contamination in bivalve organisms, these results remain within the range reported for areas considered as mildly polluted [16]. Concentrations for all seasons except summer are higher than those reported for mussels in Guanabara Bay [17], Southeast Florida [18], Galicia [7,16], southern Baltic sea [19] and Gulf of Naples [6] (Table 2). The levels in summer fall in the same range as those reported for Bay of Todos os Santos (Brazil) [20]. However, the total n-alkane concentration recorded in S4 and S3 are very high but similar to those found by Soler and al., [21] for mussels in Galicia (Table 2). The results obtained show a general distribution of n- alkanes ranged between n-C15 and n-C30; compounds lighter than n-C15 could be lost during the evaporation of extraction solvent. This distribution appears bimodal for most samples (Figure 2). The first mode, consisting in short chain n-alkanes, is predominant and constitutes more than 50% of total n-alkanes (% C < 25 vary from 22 to 100%) (Table 1). Bimodal n-alkane distribution has also been reported in oysters [22], winkles [23] and limpets [24] and has been proposed as originated from mixed contributions of terrestrial plant waxes and petro- leum sources [25]. The dominant peaks are mainly n-C17, n-C27, n-C29 and n-C31 in most samples. This feature is related to plank- tonic [26-28] and terrestrial plant wax sources [29]. Nevertheless, some samples show higher abundance of n-C18 and n-C19 over n-C17, which is often attributed to bacterial sources [28]. The biogenic source is also con- firmed by the presence of n-alkenes, identified in the range of C16 to C21. C15 to C19 n-alkenes are related to 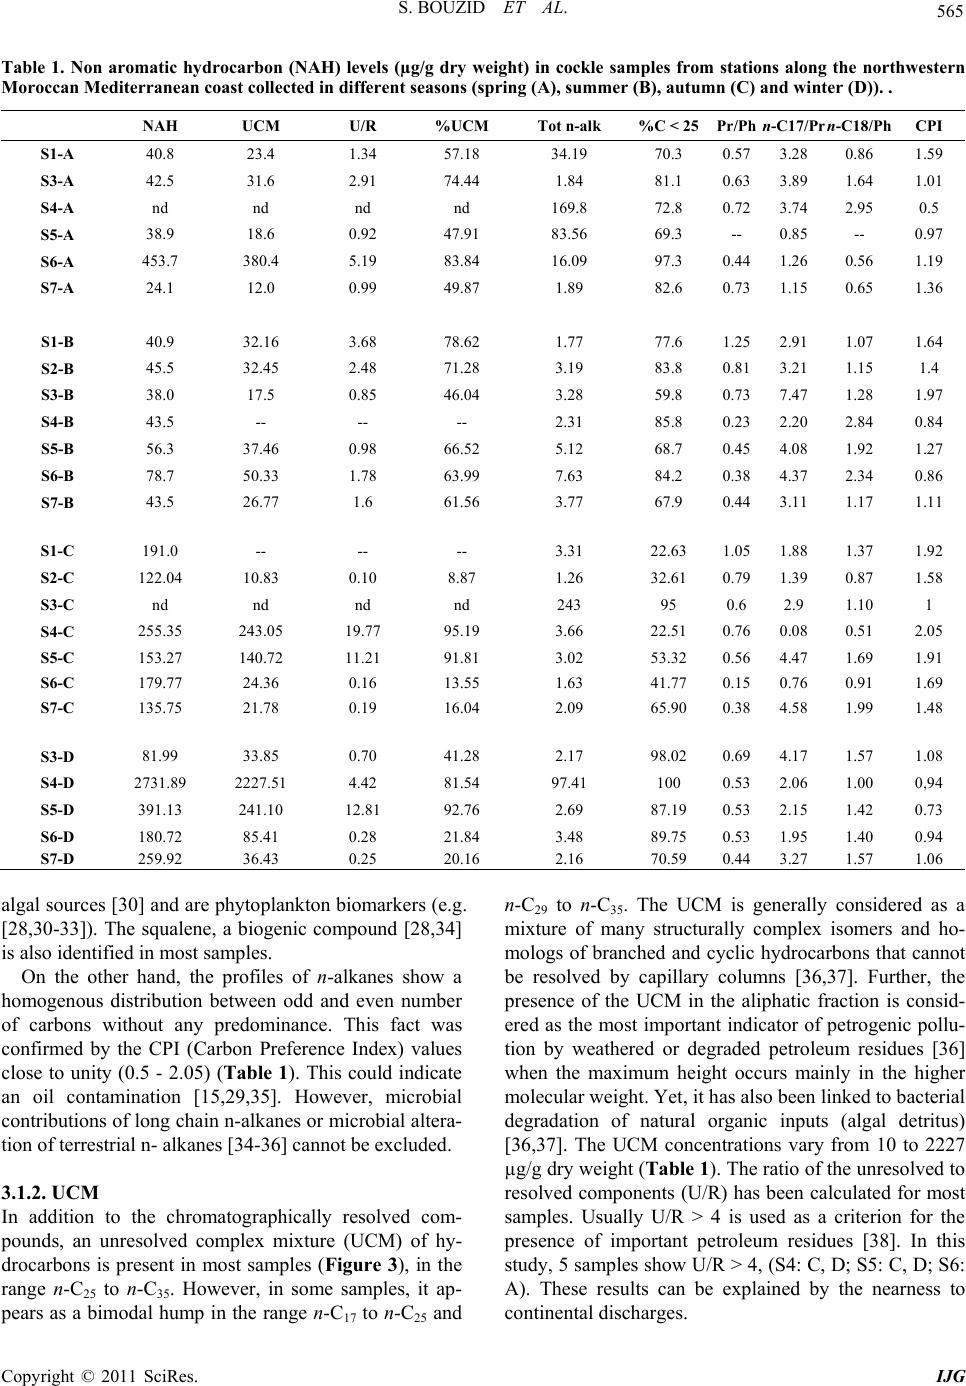 S. BOUZID ET AL. Copyright © 2011 SciRes. IJG 565 Table 1. Non aromatic hydrocarbon (NAH) levels (µg/g dry weight) in cockle samples from stations along the northwestern Moroccan Mediterranean coast collected in different seasons (spring (A), summer (B), autumn (C) and winter (D)). . NAH UCM U/R %UCM Tot n-alk %C < 25Pr/Ph n-C17/Pr n-C18/PhCPI S1-A 40.8 23.4 1.34 57.18 34.19 70.3 0.57 3.28 0.86 1.59 S3-A 42.5 31.6 2.91 74.44 1.84 81.1 0.63 3.89 1.64 1.01 S4-A nd nd nd nd 169.8 72.8 0.72 3.74 2.95 0.5 S5-A 38.9 18.6 0.92 47.91 83.56 69.3 -- 0.85 -- 0.97 S6-A 453.7 380.4 5.19 83.84 16.09 97.3 0.44 1.26 0.56 1.19 S7-A 24.1 12.0 0.99 49.87 1.89 82.6 0.73 1.15 0.65 1.36 S1-B 40.9 32.16 3.68 78.62 1.77 77.6 1.25 2.91 1.07 1.64 S2-B 45.5 32.45 2.48 71.28 3.19 83.8 0.81 3.21 1.15 1.4 S3-B 38.0 17.5 0.85 46.04 3.28 59.8 0.73 7.47 1.28 1.97 S4-B 43.5 -- -- -- 2.31 85.8 0.23 2.20 2.84 0.84 S5-B 56.3 37.46 0.98 66.52 5.12 68.7 0.45 4.08 1.92 1.27 S6-B 78.7 50.33 1.78 63.99 7.63 84.2 0.38 4.37 2.34 0.86 S7-B 43.5 26.77 1.6 61.56 3.77 67.9 0.44 3.11 1.17 1.11 S1-C 191.0 -- -- -- 3.31 22.63 1.05 1.88 1.37 1.92 S2-C 122.04 10.83 0.10 8.87 1.26 32.61 0.79 1.39 0.87 1.58 S3-C nd nd nd nd 243 95 0.6 2.9 1.10 1 S4-C 255.35 243.05 19.77 95.19 3.66 22.51 0.76 0.08 0.51 2.05 S5-C 153.27 140.72 11.21 91.81 3.02 53.32 0.56 4.47 1.69 1.91 S6-C 179.77 24.36 0.16 13.55 1.63 41.77 0.15 0.76 0.91 1.69 S7-C 135.75 21.78 0.19 16.04 2.09 65.90 0.38 4.58 1.99 1.48 S3-D 81.99 33.85 0.70 41.28 2.17 98.02 0.69 4.17 1.57 1.08 S4-D 2731.89 2227.51 4.42 81.54 97.41 100 0.53 2.06 1.00 0,94 S5-D 391.13 241.10 12.81 92.76 2.69 87.19 0.53 2.15 1.42 0.73 S6-D 180.72 85.41 0.28 21.84 3.48 89.75 0.53 1.95 1.40 0.94 S7-D 259.92 36.43 0.25 20.16 2.16 70.59 0.44 3.27 1.57 1.06 algal sources [30] and are phytoplankton biomarkers (e.g. [28,30-33]). The squalene, a biogenic compound [28,34] is also identified in most samples. On the other hand, the profiles of n-alkanes show a homogenous distribution between odd and even number of carbons without any predominance. This fact was confirmed by the CPI (Carbon Preference Index) values close to unity (0.5 - 2.05) (Table 1). This could indicate an oil contamination [15,29,35]. However, microbial contributions of long chain n-alkanes or microbial altera- tion of terrestrial n- alkanes [34-36] cannot be excluded. 3.1.2. UCM In addition to the chromatographically resolved com- pounds, an unresolved complex mixture (UCM) of hy- drocarbons is present in most samples (Figure 3), in the range n-C25 to n-C35. However, in some samples, it ap- pears as a bimodal hump in the range n-C17 to n-C25 and n-C29 to n-C35. The UCM is generally considered as a mixture of many structurally complex isomers and ho- mologs of branched and cyclic hydrocarbons that cannot be resolved by capillary columns [36,37]. Further, the presence of the UCM in the aliphatic fraction is consid- ered as the most important indicator of petrogenic pollu- tion by weathered or degraded petroleum residues [36] when the maximum height occurs mainly in the higher molecular weight. Yet, it has also been linked to bacterial degradation of natural organic inputs (algal detritus) [36,37]. The UCM concentrations vary from 10 to 2227 µg/g dry weight (Table 1). The ratio of the unresolved to resolved components (U/R) has been calculated for most samples. Usually U/R > 4 is used as a criterion for the presence of important petroleum residues [38]. In this study, 5 samples show U/R > 4, (S4: C, D; S5: C, D; S6: A). These results can be explained by the nearness to continental discharges.  S. BOUZID ET AL. Copyright © 2011 SciRes. IJG 566 Table 2. Aliphatic hydrocarbon levels (µg/g dry weight) in organism samples from the Mediterranean coast and other coasts in the world. Sites Organism Sampling Total aliph/alk UCM NAH Reference Galicia (Spain) Mussels (Mytilus galloprovincialis) Cockles (Cerastoderma edule) 2002-2003 89.46 - 5098.01 ng/g 317.49 - 17,579.37 ng/g (C8-C35) Not reported Not reported Carro et al., 2006 Guanabara bay (Brazil) Mussels (Perna perna) 1996 Winter: 520 - 1461 ng/g Summer: 309 - 829 ng/g (C10-C32) Not reported Not reported Azevedo et al., 2004 Gulf of Naples (Italy) Mussels (Mytilus galloprovincialis) Fish (Boops boops, Scorpaena scrofa, Trachinus araneus, Gobius paganellus, Coris julis, Merluccius, Boops salpa) 2000 771 - 33,202 ng/g 630 - 48,200 ng/g (C18,C20,C22,C24,C26 ,C28,C30,C32 ,C36) Not reported Not reported Amodio-Cocchieri et al., 2003 Southeast Florida Bivalves (Peria Columbus) 1990-1992 Mean value +/– 1; sd: 3156 +/– 1212 (C12-C30) Not reported Not reported Snedaker et al., 1995 Galicia (Spain) Mussels (Mytilus galloprovincialis) 1990-1991 Free-population: 0 - 6196 ng/g Raft-farmed population: 613 - 4690 ng/g (C18,C19,C20,C22,C24 ,C28,C32,C36 ) Not reported Not reported Hermida et al., 1994a Galicia (Spain) Mussels (Mytilus galloprovincialis) 1990-1991 Natural population Mean value (sd): 1430(717) - 2038(677) ng/g Raft-farmed population Mean value (sd): 1133(110) - 1845(867) (C18,C19,C20,C22,C24 ,C28,C32,C36 ) Not reported Not reported Hermida et al., 1994b Galicia (Spain) Mussels (Mytilus galloprovincialis) Not reported 4.6 - 220 µg/g (Resolved hydrocarbons)46 - 760 µg/g Not reported Soler et al., 1989 Bay of Todos os Santos (Brazil) Mussels (Mytilus sp.) Oysters (Crassostrea sp.) 1985-1986 3.2 µg/g 1.5µg/g (C15-C35) 2.4 µg/g 5.8 µg/g Not reported Tavares et al., 1988 Southern Baltica Sea Mussels (Mytilus edulis) 1981 250 - 7900 ng/g (C13-C30, Prystane, Phytane) Not reported Not reported Law and Andrulewicz, 1983 NW Moroccan coast Cockles (Acanthocardia Tuberculata) 2003 Spring: 1.7 - 169.8 µg/g(C17-C28) Summer: 1.6 - 7.6µg/g (C16-C30) Autumn: 1 - 236 µg/g (C17-C34) Winter: 1.5 - 96.2 µg/g (C17-C25) 10 - 2227 µg/g 24 - 2731 µg/g This study 3.1.3. Isoprenoids Pristane (Pr) and phytane (Ph) are the most common iso- prenoids detected in marine organisms, sediments and waters [24]. They are present in most of our samples. The ratio of pristane vs. phytane (Pr/Ph) has been used as an indicator of the redox conditions in sediments and/or as an indicator of oil slicks [24,39]. In uncontaminated sediment the Pr/Ph ratio is higher than one (usually be- tween 3 and 5) [40]. The ratio Pr/Ph in all our samples is lower than 1 confirming a petrogenic contamination. On the other hand, the ratios n-C17/Pr and n-C18/Ph, usually used as indicators of hydrocarbon degradation [41], indicate, for most samples, degraded material of biogenic inputs. However, most samples show high val- ues of n-C17/Pr ratio which could be related to the rela- tively high contents of n-C17 in several stations. 3.1.4. Hopanes Hopanes are ubiquitous compounds in crude oils, and resistant to weathering processes and bacterial degrada- tion [36]. Their composition is usually characteristic of pollution sources; therefore they have been used as an identifier of petroleum pollution [42,43]. In this study, hopane series have been identified in all samples by mo- nitoring m/z 191 in GC/MS analysis. The identified compounds have the thermodynamically stable 17α(H), 21β(H) configuration. Such isomeric configuration occurs in crude oil and mature rocks [42]. The hopane distribu- tion is characterized by the presence of C30 with subordi- nate amounts of 18α(H)-22,29,30-trisnorneohopane (Ts), 17α(H)-22,29,30-trisnorhopane (Tm), 17α(H),21β(H) 29- norhopane and the extended C31-C35 α-hopanes series.  S. BOUZID ET AL. Copyright © 2011 SciRes. IJG 567 Figure 2. n-Alkane distribution from C15 to C35 of cockle samples collected from KSr station during the 4 seasons corre- sponding to S7-A, S7-B, S7-C, and S7-D. Figure 3. Chromatogram of Non Aromatic Hydrocarbons obtained by GC/FID for cockle samples in stations S3 (spring) and S6 (summer). These latter occur as 22S and 22R epimers, characteris- tics of oil derived hydrocarbons [44], which confirms a fossil origin as already suggested by the CPI values, the presence of UCM and the Pr/Ph ratio (Figure 4). 3.2. Fraction 2 Inversely to what expected, polycyclic aromatic hydro- carbons (PAH) are present in very low concentrations, below the limit of GC detection in all organism samples. However, the analysis showed the presence of com- pounds known as Long Chain Alkylbenzenes (LAB). These compounds were reported, for the first time, by Grimalt et al., [45] in sediments from the Catalane coast. 3.2.1. Long Ch ain Al kylbenzenes (LAB s) Long chain alkylbenzenes are important intermediates in the manufacture of the detergent surfactants [46]. They are the raw material for the industrial production of the linear alkylbenzenesulfonates (LAS) [43,47,48], which are the anionic surfactants commonly used in domestic synthetic detergents [43,47]. 1% to 3% of LABs are unsulfonated during the syn- thesis of LAS-detergents [43,47,48], and can be carried into the aquatic environment in association with domestic wastes [43,47-50]. Since LABs are more resistant to mi- crobial attack in the environment than LAS [47,48,51,52], they have been widely utilized for monitoring sewage inputs [48,51]. They have been detected in river waters [48,53], marine sediments [52,54] and marine organisms [47,55]. In this study, linear alkylbenzenes containing alkyl chains ranging from 13 to 14 carbon atoms were detected in most samples analyzed by monitoring m/z 91 and m/z 105 in the GC/MS analysis (Figure 5). Total concentra- tions of LABs vary from 478 to 1954 ng/g dw (Table 3). The absence of the lighter homologs could be related to the selective metabolism by the organism as observed in fishes [56]. It can also be related to the mode of nutrition of cockles. These organisms are known to have an active suspension feeding mode; they feed on the particulate phase. Indeed, it has been demonstrated that this phase  S. BOUZID ET AL. Copyright © 2011 SciRes. IJG 568 Figure 4. Characteristic GC/MS mass fragmentogram for m/z 191. Ts: 18α(H)-22,29,30-trinorneohopane; Tm: 17α (H)-22,29,30-trinorhopane, C29: 17α(H), 21β(H) 29-norhopane, Hopanes; (C31-C35): hopane series with 22S and 22R epi- mers. Table 3. Linear alkylbenzenes concentrations (ng/g dw) in cockles from sampling sites of North-Western Moroccan Mediterranean coasts. S1 S3 S4 S5 S6 S7 13-LAB 6 20.92 44.39 17.91 32.79 22.2226.04 13-LAB 5 24.67 17.39 23.01 33.18 16.5312.42 13-LAB 4 0.89 24.11 31.90 48.33 26.9220.09 13-LAB 3 35.57 65.19 67.65 139.79 72.6362.00 13-LAB 2 346.04 463.33 523.46 1081.44 501.67510.11 14-LAB 6 579.37 16.61 29.56 66.46 26.7416.62 14-LAB 5 17.46 14.77 36.39 69.86 168.4621.09 14-LAB 4 31.56 35.31 38.55 64.88 36.4937.88 14-LAB 3 20.72 37.26 57.66 142.74 71.9330.08 14-LAB 2 103.57 92.32 113.62 285.48 134.19125.95 LAB 1166.80 788.47 935.31 1954.42 1076.50847.66 concentrates the higher homologs of LABs [57]. 4. Seasonal and Spatial Variations This monitoring study points out the important amounts of hydrocarbons accumulated in bivalve organism’s tis- sues. The concentrations of non aromatic hydrocarbons vary from 24.1 to 2731.89 µg/g. Maximum values were observed in S4 and S6 sites corresponding to stations located near the mouths of Marltil and Oued Laou rivers, respectively. Moreover, site S2, located near the pleas- ance harbor of Kabila, shows sometimes high values of NAH. On the other hand, minimum values were found at stations located far from any sources of pollution. The distribution of NAH shows both seasonal and spa- tial variations. The spatial variation was also revealed by the results of the MYTILOS project, which underlines the urban and industrial poles and the mouths of the main streams as the most polluted sectors, with a distinct dilu- tion effect noted for the organic compounds [58]. Indeed, the coastal fringe from F’nideq (S1) to Kaâ Srass (S7) receives pollutant inputs from various point  S. BOUZID ET AL. Copyright © 2011 SciRes. IJG 569 Figure 5. Characteristic GC/MS mass fragmentogram for m/z 91 showing the distribution of linear alkylbenzenes (13 and 14 indicate the alkyl chain length, and n refers to the position of the phenyl group on the alkyl chain). sources. The spatial variation is strongly influenced by the proximity to the sources, marine ones as harbors and shipping activities, and continental ones as urban dis- missals. The latter is strongly marked by the presence of LABs compounds. In fact, this zone receives an impor- tant amount of mineral and organic pollutants emanating from coastal agglomerations. Therefore, Martil and Oued Laou rivers mouths would be the most exposed sites to anthropogenic effluents. However, LABs are also present in sites far enough from the zone of pollution emissions (e.g., station S6). This can be attributed to the transport of pollutants by currents, and to the resistance of hydrocarbon pollutants. Our results also reveal significant seasonal variations. Concentrations in winter and autumn are much higher than those in warm seasons, with maximum values re- corded in winter. This is likely due to the higher river flow in humid seasons (winter and autumn) when rivers expel important discharges and associated pollutants seawards. In dry seasons highest concentrations are re- corded in stations close to marine sources, such as har- bors (Kabila site) and shipping activities. Seasonal and spatial distributions of NAH, illustrated in Figure 6, show that the accumulation of NAH is strongly controlled by the proximity to marine pollution sources as well as to land-based ones. The latter are con- firmed by the presence of the long chain alkylbenzenes reflecting domestic wastewater inputs. 5. Conclusions This investigation provided important information on the contamination of western Mediterranean coasts of Mo- rocco by hydrocarbons. Concentrations of total non aro- matic hydrocarbons are important but still not alarming. In comparison with other sites, our results fall within the Figure 6. Seasonal and spatial distribution of total non aromatic hydrocarbon concentration in the study area (Fnideq-Kaâ Srass) (spring (A), summer (B), autumn (C) and winter (D). range reported for areas considered to be mildly polluted. The qualitative and quantitative analysis points out two major sources of hydrocarbons: natural sources linked to phytoplankton, bacteria and continental plants and anth- ropogenic sources related to petrogenic inputs from shipping activities and harbors as well as to urban wastes from nearby agglomerations transported by rivers. The distinct anthropogenic sources strongly control the sea- sonal and spatial variations observed. 6. References [1] National Research Council, (U.S.), “Oil in the Sea: Inputs, Fates and Effects,” National Academy of Science, Wash- ington D.C., 2003. [2] K. A. Burns and A. Saliot, “Petroleum Hydrocarbons in the Mediterranean Sea: A Mass Balance,” Marine Chem-  S. BOUZID ET AL. Copyright © 2011 SciRes. IJG 570 istry, Vol. 20, No. 2, 1986, pp. 141-157. doi:10.1016/0304-4203(86)90036-8 [3] National Academy of Science, “Petroleum in Marine Environment,” Workshop on Inputs, Fates and Effect of Petroleum in Marine Environment. Academic Press, Cambridge, 1985. [4] A. Saliot, M. Bigot, I. Bouloubassi, E. Lipiatou, Y. J. Qiu and P. Scribe, “Transport and Fate of Hydrocarbons in Rivers and Their Estuaries. Partitioning between Dis- solved and Particulate Phases: Case Studies of the Rhône, France, and The Huanghe and the Changjiang, China,” Science of the Total Environment, Vol. 97/98, November 1990, pp. 55-68. doi:10.1016/0048-9697(90)90230-R [5] J. R. Albaigés, B. Morales-Nin and F. Vilas, “Prestige Oil Spill: A Scientific Response,” The Marine Pollution Bul- letin, Vol. 53, No. 5-7, 2006, pp. 205-207. doi:10.1016/j.marpolbul.2006.03.012 [6] R. Amodio-Cocchieri and T. Cirillo, “Aliphatic Hydro- carbons in Biota from the Gulf of Naples (Italy),” Marine Pollution Bulletin, Vol. 46, No. 3, 2003, pp. 362-377. doi:10.1016/S0025-326X(02)00485-X [7] A. Hermida-Ameijeiras, J. Simal-Gandara, J. Lopez-Her- nandez and J. Simal-Lozano, “Aliphatic Hydrocarbons Levels in Farmed and Free-Living Mussels from Galicia (N.W. Spain),” Marine Pollution Bulletin, Vol. 28, No. 3, 1994, pp. 178-181. doi:10.1016/0025-326X(94)90395-6 [8] N. Sellali, Amarouche, S. Debiche, A. Chouikiri and B. Boudjellal, “Hydrocarbures Polyaromatiques dans le Sédiment Superficiel des Côtes ouest d’Algérie,” Rapport des Communications Internationales sur la Mer Méditer- ranée, Vol. 33, 1992, p.184. [9] A. Louati, B. Elleuch, M. Kallel and A. Saliot, J. Dagaut and J. Oudot, “Hydrocarbon Contamination of Coastal Sediments from the Sfax Area (Tunisia), Mediterranean Sea,” Marine Pollution Bulletin, Vol. 42, No. 6, 2001, pp. 445-452. doi:10.1016/S0025-326X(00)00179-X [10] H. Zaghden, M. Kallel, B. Elleuch, J. Oudot and A. Saliot, “Sources and Distribution of Aliphatic and Polyaromatic Hydrocarbons in Sediments of Sfax, Tunisia, Mediterra- nean Sea,” Marine Chemistry, Vol. 105, No. 1-2, 2007, pp. 70-89. doi:10.1016/j.marchem.2006.12.016 [11] T. A. T. Aboul-Kassim and B. R. T. Simoneit, “Lipid Geochemistry of Surficial Sediments from the Coastal Environment of Egypt I. Aliphatic hydrocarbons- charac- terisation and Sources,” Marine Chemistry, Vol. 54, No. 1-2, 1996, pp. 135-158. doi:10.1016/0304-4203(95)00098-4 [12] H. Er-Raioui, S. Bouzid , M. Marhraoui and A. Saliot, “Hydrocarbon Pollution of the Mediterranean Coastline of Morocco,” Ocean & Coastal Management, Vol. , No. 52, 2009, pp. 124-129. [13] E. D. Goldberg, V. T. Bowen, J. W. Farrigton, G. Harvey, J. H. Martin, P. L. Parker, R. W. Risebrough, W. Robert- son, E. Scheneider and E. Gamble, “The Mussel Watch,” Environmental Conservative, Vol. 5, No. 2, 1978, pp. 101-125. doi:10.1017/S0376892900005555 [14] C. H. Walker and D. R. Livingstone, “Persistents Pollut- ants in Marine Ecosystems,” Pergamon Press, Oxford, 1992. [15] N. Carro, J. Cobas, and J. Maneiro, “Distribution of Ali- phatic Compounds in Bivalve Mollusks from Galicia af- ter the Prestige Oil Spill: Spatial and Temporal Trends,” Environmental Research, Vol. 100, No. 3, 2005, pp. 399- 348. [16] A. Hermida-Ameijeiras, J. Simal-Gandara, J. Lopez-Her- nandez and J. Simal-Lozano, “Classification of the Coastal Waters of Galicia (N.W. Spain) on the Basis of Total Aliphatic Hydrocarbon Concentration in Mussels (Mytilus Galloprovincialis),” Marine Pollution Bulletin, Vol. 28, No. 6, 1994, pp. 396-398. doi:10.1016/0025-326X(94)90280-1 [17] L. A. Azevedo, I. M. R. De Andrade Brüning and I. Mo- reira, “Hydrocarbon Contamination in Mussels from Gu- anabara Bay,” Marine Pollution Bulletin, Vol. 49, No. 11-12, 2004, pp. 1109-1126. doi:10.1016/j.marpolbul.2004.10.003 [18] S. C. Snedaker, P. W. Glynn, D. G. Rumbold and E. F. Corcoran, “Distribution of n-Alkanes in Marine Samples from Southeast Florida,” Marine Pollution Bulletin, Vol. 30, No. 1, 1995, pp. 83-89. doi:10.1016/0025-326X(94)00147-2 [19] R. Law and E., Andrulewicz, “Hydrocarbons in Water, Sediment and Mussels from the Southern Baltic Sea,” Marine Pollution Bulletin, Vol. 14, No. 8, 1983, pp. 289- 293. doi:10.1016/0025-326X(83)90537-4 [20] T. M. Tavares, V. C. Rocha, C. Porte, D. Barcelo and J. Albaiges, “Application of the Mussel Watch Concept in Studies of Hydrocarbons, PCBs and DDT in the Brazilian Bay of Todos os Santos (Bahia),” Marine Pollution Bul- letin, Vol. 19, No. 11, 1988, pp. 575-578. doi:10.1016/0025-326X(88)90022-7 [21] M. Soler, J. O. Grimalt, J. Albaiges, J. Mendez and M. Mariño, “Distribution of Aliphatic, Aromatic and Chlo- rinated Hydrocarbons in Mussels from the Spanish Atlan- tic Coasts (Galicia). An Assessment of Pollution Parame- ters,” Chemosphere, Vol. 19, No. 10-11, 1989, pp. 1489- 1498. doi:10.1016/0045-6535(89)90493-1 [22] J. M. Neff and W. A. Burns, “Estimation of Polycyclic Aromatic Hydrocarbon Concentrations in the Water Column Based on Tissues Residues in Mussels and Sal- mon: An Equilibrium Partitioning Approach,” Environ- mental Toxicology and Chemistry, Vol. 15, No. 12, 1996, pp. 2240-2253. doi:10.1002/etc.5620151218 [23] E. Peña, J. E., Conde and G. Montelongo, “Evaluation of Osilinus Attratus as a Bioindicator Organism to Monitor Oil Pollution in the Canary Islands,” Archives of Envi- ronmental Contamination and Toxicology, Vol. 31, No. 4, 1996, pp. 444-452. doi:10.1007/BF00212426 [24] E. Peña, Ma.S. Astroga-España and G. Montelongo, “Chemical Fingerpringting Applied to the Evaluation of Marine Oil Pollution in the Coasts of the Canary Islands (Spain),” Environmental Pollution, Vol. 111, No. 2, 2001, pp. 117-187. [25] J. W. Farrington, A. C. Davis, N. M. Frew and K. S. Ra-  S. BOUZID ET AL. Copyright © 2011 SciRes. IJG 571 bins, “No. 2 Fuel Oil Compounds in Mytilus Edulis: Re- tention and Release after Oil Spill,” Marine Biology, Vol. 66, No. 1, 1982, pp. 15-26. doi:10.1007/BF00397250 [26] Y. Le Dréau, F. Jacquot, P. Doumenenq, M. Guiliano, J. C. Bertrand and G. Mille, “Hydrocarbon Balance of a Site Which Had Been Highly And Chronically Contami- nated by Petroleum Wastes of a Refinery (from 1956 to 1992),” Marine Pollution Bulletin, Vol. 34, No. 6, 1997, pp. 456-468. doi:10.1016/S0025-326X(96)00139-7 [27] J. Dachs, J. M. Bayona, J. Fillaux, A. Saliot and J. Al- baiges, “Evaluation of Anthropogenic and Biogenic In- puts into the Western Mediterranean Using Molecular Markers,” Marine Chemistry, Vol. 65, No. 3-4, 1999, pp. 195-210. doi:10.1016/S0304-4203(99)00002-X [28] W. L. Jeng and C. A. Huh, “Lipids in Suspended Matter and Sediments from the East China Sea Shelf,” Organic Geochemistry, Vol. 35, No. 5, 2004, pp. 647-660. doi:10.1016/j.orggeochem.2003.12.002 [29] P. M. Medeiros and M. C. Bicego, “Investigation of Nat- ural and Anthropogenic Hydrocarbon Inputs in Sediments Using Geochemical Markers. I. Santos, SP–– Brazil,” Marine Pollution Bulletin, Vol. 49, No. 9-10, 2004, pp. 761-769. doi:10.1016/j.marpolbul.2004.06.001 [30] M. Blumer, R. R. L. Guillard and T. Chase, “Hydrocar- bons of Marine Phytoplankton,” Marine Biology, Vol. 8, No. 3, 1971, pp. 183-189. doi:10.1007/BF00355214 [31] M. Blumer, M. M. Mullin and R. R. L. Guillard, “A Po- lyunsaturated Hydrocarbon (3,6,9,12,15,18-Heneicosahexaene) in the Marine Food Web,” Marine Biology, Vol. 6, No. 3, 1970, pp. 226-235. doi:10.1007/BF00347230 [32] J. S. Sinninghe Damste, W. I. C Rijpstra, S. Schouten, H. Peletier, M. J. E. C. Van Der Maarel and W. W. C. Gies- kes, “A C25 Highly Branched Isoprenoid Alkene and C25 and C27 n-polyenes in the Marine Diatom Rhizoso- lenia Setigera,” Organic Geochemistry, Vol. 30, No. 1, 1999, pp. 95-100. doi:10.1016/S0146-6380(98)00141-7 [33] K. A. Burns, P. Greenwood, R. Benner, D. Brinkman, G. Brunskill, S. Codi and I. Zagorskis, “Organic Biomarkers for Tracing Carbon Cycling in the Gulf of Papua (Papua New Guinea),” Continental Shelf Research, Vol. 24, No. 19, 2004, pp. 2373-2394. doi:10.1016/j.csr.2004.07.014 [34] I. Bouloubassi and A. Saliot, “Investigation of Anthro- pogenic and Natural Organic Inputs in Estuarine Sedi- ments Using Hydrocarbon Markers (NAH, LAB, PAH),” Oceanologica Acta, Vol. 16, No. 2, 1993, pp. 145-161. [35] J. M. Moreda, A. Arranz, S. Fdez De Betoño, A. Cid and J. F. Arranzu, “Chromatographic Determination of Ali- phatic Hydrocarbons and Polyaromatic Hydrocarbons_ PAHs in a Sewage Sludge,” Science of the Total Envi- ronment, Vol. 220, No. 1, 1998, pp. 33-43. doi:10.1016/S0048-9697(98)00238-1 [36] I. Bouloubassi, J. Fillaux, A. Saliot, “Hydrocarbons in Surface Sediment from the Changjiang (Yangtze River) Estuary, East China Sea,” Marine Pollution Bulletin, Vol. 42, No. 12, 2001, pp. 1335-1346. doi:10.1016/S0025-326X(01)00149-7 [37] M. A. Gough and S. J. Rowland, “Characterization of Unresolved Complex Mixture of Hydrocarbons in Petro- leum,” Nature, Vol. 344, No. 12, 1990, pp. 648-650. doi:10.1038/344648a0 [38] M. A. Mazurek and B. R. T. Simoneit, “Characterization of Biogenic and Petroleum-Derived Organic Matter in Aerosols over Remote, Rural and Urban Areas” In: L. H. Keith, Ed., Identification and Analysis of Organic Pol- lutants in Air, Ann Arbor Science/ Butterworth, Boston, 1984, pp. 353-370. [39] J. E. Conde, E. Peña and G. Montelongo, “Sources of Tar Balls and Oil Slicks on the Coasts of the Canary Islands,” International Journal of Environment and Analytical Chemistry, Vol. 62, No. 1, 1996, pp. 77-84. doi:10.1080/03067319608027054 [40] M. S. Steinhauer and P. D. Boehm, “The Composition and Distribution of Saturated and Aromatic Hydrocar- bons in Nearshore Sediments, River Sediments and Coastal Peat of Alaskan Beaufort Sea: Implication for Detecting Anthropogenic Hydrocarbon Inputs,” Marine Environmental Research, Vol. 33, No. 4, 1992, pp. 223- 253. doi:10.1016/0141-1136(92)90140-H [41] R. M. Atlas, P. D. Boehm and J. A. Calder, “Chemical and Biological Weathering of Oil from the Amoco Cadiz Oil Spillage, within the Littoral Zone,” Estuarine Coastal and Marine Science, Vol. 12, 1981, pp. 589-608. [42] K. E. Peters and J. M., Moldowan, “The Biomarker Guide. Interpreting Molecular Fossils in Petroleum and Ancient Sediments,” Prentice Hall, Upper Saddle River, 1993. [43] P. M., Medeiros, M. C., Bicego, R. M., Castelao, C. Del Rosso, G. Fillmann, and A. J. Zamboni, “Natural and An- thropogenic Hydrocarbon Inputs to Sediments of Patos Lagoon Estuary, Brazil,” Environment International, Vol. 31, No. 1, 2005, pp. 77-87. doi:10.1016/j.envint.2004.07.001 [44] A. Gogou, I. Bouloubassi and E. G. Stephanou, “Marine Organic Geochemistry of the Eastern Mediterranean: 1. Aliphatic and Polyaromatic Hydrocarbons in Cretan Sea Surficial Sediments,” Marine Chemistry, Vol. 68, No. 4, 2000, pp. 265-282. doi:10.1016/S0304-4203(99)00082-1 [45] J. Grimalt, J. M. Bayona and J. Albaigés, “Chemical Markers for the Characterization of Pollutant Inputs in the Coastal Zones,” VII Journées Etudes Pollutions, Lu- cerne, CIESM, 1984, pp. 533-543. [46] A. R. A. S. Desmukh, V. K. Gumaste and B. M. Bhawal, “Alkylation of Benzene with Long Chain (C8-C18) Lin- ear Primary Alcohols over Zeolite-Y,” Catalysis Letters, Vol. 64, No. 2-4, 2000, pp. 247-250. doi:10.1023/A:1019055507996 [47] S. Tsutsumi, Y. Yamaguchi, I. Nishida, K. Akiyam, M. P. Zakaria and H. Takada, “Alkylbenzenes in Mussels from South and South East Asian Coasts as a Molecular Tool to Asses Sewage Impact,” Marine Pollution Bulletin, Vol. 45, No. 1-12, 2002, pp. 325-331. [48] K. O. Isobe, M. P. Zakaria, N. H. Chiem, L. Y. Minh, M. Prudente, R. Boonyatumanond, M. Saha, S. Sarkar and H.  S. BOUZID ET AL. Copyright © 2011 SciRes. IJG 572 Takada, “Distribution of Linear Alkylbenzenes (LABs) in Riverine and Coastal Environments in South and South- east Asia,” Water Research, Vol. 38, No. 9, 2004, pp. 2449-2459. doi:10.1016/j.watres.2004.02.009 [49] R. P. Eganhouse, E. C. Ruth and I. R. Kaplan, “Determi- nation of Long-Chain Alkylbenzenes in Environmental Samples by Argentation Thin-Layer Chromatogra- phy/High Resolution Gas-Chromatography and Gas Ch- romatography/mass Spectrometry,” Analytical Chemistry, Vol. 55, No. 13, 1983, pp. 2120-2126. doi:10.1021/ac00263a028 [50] C. C. Raymundo and M. R. Preston, “The Distribution of Linear Alkylbenzenes in Coastal and Estuarine Sediments of the Western North Sea,” Marine Pollution Bulletin, Vol. 24, No. 3, 1992, pp. 138-146. doi:10.1016/0025-326X(92)90241-W [51] H. Takada and R. Ishiwatari, “Linear alkylbenzenes in Urban Riverine Environments in Tokyo: Distribution, Source, and Behaviour,” Environmental Science and Technology, Vol. 21, No. 9, 1987, pp. 875-883. doi:10.1021/es00163a005 [52] H. Takada, N. Ogura and R. Ishiwatari, “Distribution of Linear Alkylbenzenes (LABs) and Linear Alkylbenzene Sulfonates (LAS) in Tokyo Bay Sediments,” Estuarine Coast Shelf Science, Vol. 35, No. 2, 1992, pp. 141-156. doi:10.1016/S0272-7714(05)80109-X [53] P. T. Crisp, S. Brenner, M. I. Venkatesan, E. Ruth and I. R. Kaplan, “Organic Chemical Characterization of Sedi- menttrap Particles from San Nicolas, Santa Barbara, San- ta Monica and San Pedro Basins, California,” Geo- chimica et Cosmochimica Acta, Vol. 43, No. 11, 1979, pp. 1791-1801. doi:10.1016/0016-7037(79)90027-9 [54] N. Chalaux, H. Takada and J. M. Bayona, “Molecular markers in Tokyo Bay sediments: sources and Distribu- tion,” Marine Environmental Research, Vol. 40, No. 1, 1995, pp. 77-92. doi:10.1016/0141-1136(95)90001-8 [55] G. P. Serrazanetti, C. Pagnucco, L. S. Conte and R. Ar- tusi, “Aliphatic Hydrocarbons and Linear Alkylbenzenes in Zooplankton from the Gulf of Trieste,” Chemosphere, Vol. 28, No. 6, 1994, pp. 1119-1126. doi:10.1016/0045-6535(94)90330-1 [56] M. I. Venkatesan, T. Northrup and C. R. Phillip, “Deter- mination of Linear Alkylbenzenes in Fish Tissue by Gel Permeation Chromatography and Gas Chromatography- Mass Spectrometry,” Journal of Chromatography A, Vol. 942, No. 1-2, 2002, pp. 223-230. doi:10.1016/S0021-9673(01)01400-5 [57] A. P. Murray, B. J. Richardson and C. F. Gibbs, “Bio- concentration Factors for Petroleum Hydrocarbons, PAHs, LABs and Biogenic Hydrocarbons in the Blue Mussel,” Marine Pollution Bulletin, Vol. 22, No. 12, 1991, pp. 595-603. doi:10.1016/0025-326X(91)90247-P [58] B. Andral, F. Galgani, C. Tomasino and C. Blottiere, “Evaluation de la Contamination Chimique de la Médi- terranée Occidentale par la Méthode des Transplants de Moules,” Rapport IFREMER Project INTERREG III B– MYTILOS, June2007. |

