 Applied Mathematics, 2011, 2, 1346-1355 doi:10.4236/am.2011.211188 Published Online November 2011 (http://www.SciRP.org/journal/am) Copyright © 2011 SciRes. AM Fuzzy Fault Tree Analysis for Fault Diagnosis of Cannula Fault in Power Transformer Sanjay Kumar Tyagi1, Diwakar Pandey2, Vinesh Kumar2 1Department of Applied Mathematics, Amity Institute of Applied Sciences, Amity University, Noida, India 2Department of Mat hem at i cs, Chaudhary Chara n Singh Universit y, Meerut, India E-mail: sanjay_tyagi94@rediffmail.com Received April 17, 2011; revised July 12, 2011; accepted July 19, 2011 Abstract Being one of the most expensive components of an electrical power plant, the failures of a power transformer can result in serious power system issues. So fault diagnosis for power transformer is highly important to ensure an uninterrupted power supply. Due to information transmission mistakes as well as arisen errors while processing data in surveying and monitoring state information of transformer, uncertain and incom- plete information may be produced. Based on these points, this paper presents an intelligent fault diagnosis method of power transformer using fuzzy fault tree analysis (FTA) and beta distribution for failure possibil- ity estimation. By using the technique we proposed herein, the continuous attribute values are transformed into the fuzzy numbers to give a realistic estimate of failure possibility of a basic event in FTA. Further, it explains a new approach based on Euclidean distance between fuzzy numbers, to rank the basic events in accordance with their Fuzzy Importance Index. Keywords: Fault Tree, Power Transformer, Fuzzy Sets, Expert Systems, Fuzzy Importance Index 1. Introduction The involvement of a very larg e number of variables and their multiple interrelations make the design of a power transformer very complicated. This complicacy in design of a power system and variation in operating conditions causes the occurrence of a fault to be uncertain and ran- dom. In present paper we introduce a new approach to the fault detection and analysis of a power transformer. Fault tree analysis (FTA) is proved to be a very effec- tive tool to predict probability of hazard caused by a se- quence and combinations of faults and failure events. A fault tree is a pictorial representation of various combi- nations of faults leading to hazard. In fault tree analysis, we first explore a hazard and then look for events caus- ing this hazard. In conventional FTA the basic events are assigned a crisp number. But there are various crucial and complex systems of great importance, which imparts vague characteristics. Due to the complexity of systems and their vague nature, it is very difficult to obtain an adequate inference about the failure of these systems. In 1965, L. A. Zadeh [1] suggested a paradigm shift from a theory of total denial and affirmation to a theory of grading to give the concept of fuzzy set. H. Tanaka, L. T. Fan, F. S. Lai and K. Toguchi [2] used fuzzy set the- ory to replace a crisp number by fuzzy number for better estimation of failure possibility of top even t. D. Singer [3] presented fuzzy set theoretic approach to fault tree ana- lysis. S. Chen [4] used arithmetic of fuzzy numbers to evaluate system reliability. Zong-Xiao Yang, Kazuhiko Suzuki, Yukiyasu Shimada and Hayatoshi Sayama [5] constructed a fuzzy fault diagnostic system, which uses the fuzzy fault tree analysis to represent knowledge of the causal relationships in process operation and control system. Method proposed by him is applied successfully to a nitric acid cooler process plant. Fuzzy set theoretic approach for estimating failure rate parameters devel- oped by D. Pandey and Sanjay Kumar Tyagi [6] provides comprehensive results in estimation of variety of pa- rameters involving human judgment, unreported times, vague operating conditions, etc. D. Pandey and Sanjay Kumar Tyagi [7] developed a technique that has proven successful in other areas of knowledge, fuzzy reasoning, in the evaluation and assessment of equipment failure modes. In this paper probabilistic consideration of basic events is replaced with possibilities, thereby leading to  S. K. TYAGI ET AL.1347 fuzzy fault tree analysis. The failure of power may interrupt various important operations and make a huge damage to the economy of any nation. Power transformer is one of the important electricity equipment used in power networks. Thus the fault diagnosis and its maintenance in a power transfor- mer is the utmost priority of power supply enterprises. Fu Ying-Shun, Liu Fa-Zhan, Zhang Wei-Zheng, Zhang Quing and Zhang Gui-Xin [8] used rough set theory to diagnose faults in a power transformer. Chen Yuliang and Zhang Tiejun [9] also investigated the fuzzy fault tree method in the machinery equipment fault diagnosis. In his theory they used fuzzy mathematics to deal with the uncertainty incurred in the failure pro bability of basic events. Tong Wu, Guangyu Tu, Z. Q. Bo and A. Klimek [10] also introduced a method of fault diagnosis of power transformer. In their work, they used the analysis method to process the probability of faults withou t statistical data and developed the methods for the different mode pro- bability data conversion to triangle fuzzy numbers. Accurate failure statistics is crucial requirement for re- liability estimation in power transformer failure. In a si- tuation, wherein failure data may not be corrected accu- rately due to various reasons, it is more practical to em- ploy linguistic terms to express d ata valu e for failure of a particular event. Since a power transformer may be in- stalled under different operating conditions. It seems to be impractical to assign a single fuzzy number to the fai- lure possibility of the basic events in a fault tree analysis. To overcome this problem, in present paper we have categorized the operating condition of a power trans- former as “Worst Case Condition”, “Condu cive Environ- ment” and “Highly Conducive Environment” for a power transformer to work. By “Worst Case Condition” we mean a situation that rarely occurs i.e. in a state of emergency. “Conducive Environment” is a normal state where most of the transformers are installed. Highly Conducive en- vironment is a very special and conducive environment created artificially to keep transformer cool and working for a very long time. Using statistics of failure of power transformer working under different operating conditions each basic event is assigned three fuzzy numbers by Ex- perts A, B and C. But a single fuzzy number is needed for each basic event to evaluate the failure possibility of top event. Sanjay Kumar Tyagi, D. Pandey and Reena Tyagi [11] developed a technique to get a single fuzzy number for each basic event by taking a fuzzy number having least variance with all fuzzy number. But in a natural way, most of the transformers are installed at the places having “Conducive Environmental Conditions”. So it is impractical to give equal weightage to the fuzzy numbers assigned by Expert A, B and C to each basic event, which may result in the underestimation/over- estimation of failure possibility of the basic events. Beta distribution is widely used to model probability distributions of variables or project parameters in many areas of operations research like risk analysis for strate- gic planning, finance and marketing and in decision ana- lysis [12]. Based on beta distribution, here we proposed a very precise and pragmatic approach to estimate the fail- ure possibility of each basic event in fault tree analysis. Three estimates w, c and h suggested by three experts A, B and C are taken into consideratio n. It is ob- served that the median (a crisp number) of the triangular fuzzy numbers assigned to three estimates w, c and h are statistically independent. And, since beta distri- bution is extremely versatile to model variety of uncer- tainties. So, it is quite usefu l to apply beta distribution to estimate the parameter “failur e possibility” of basic events. In our analysis, we generalize this parameter estimation method by replacing the crisp numbers with fuzzy num- bers to obtain the failure possib ility of basic events. So it will enable us to give more realistic estimates for failure possibility of basic events. p p p p p p In FTA the basic events have different importance and improving failure possibility of a basic event having highest importance will improve the reliab ility of system. H. Furuta and N. Shiraishi [13] proposed the concept of fuzzy importance using max-min fuzzy operator and fuzzy integral. Monte-Carlo simulation is generally used in the determination of importance measure, even though computing process is time consuming. Thus for a very complex system having large number of components, the whole procedure has to be repeated again and again, thus not suitable for the fuzzy approach. P. V. Suresh, A. K. Baber and V. Venkat Raj [14] proposed another method to evaluate an importance measure called fuzzy impor- tance measure (FIM). For effective evaluation of the im- portance index of each basic events, we have introduced a comparatively easier method to calculate fuzzy impor- tance index (FII), based Euclidean distance between two fuzzy numbers. The FII of different basic events leading Cannula Fault are obtained from the proposed method. 2. Triangular Fuzzy Numbers and Their Arithmetic (a) Triangular Fuzzy Number: A fuzzy number is termed as triangular fuzzy number if the membership function of fuzzy number A is shown as follows 112 21 32 32 if () if 0otherwise A xa axa aa ax 3 axa aa (1) Copyright © 2011 SciRes. AM  S. K. TYAGI ET AL. 1348 In our study, we will use a triplet () to denote a triangular fuzzy number. 123 ,,aaa (b) Operations on triangular fuzzy numbers: The addition of triangular fu zzy number 123 (, , ) aaa and is defined as: 123 (, , )Bbbb 112 23 3 ,, Bababab (2) Thus the addition of two triangular fuzzy numbers is again a triangular fuzzy number. Similarly subtraction of two triangular fuzzy numbers is also a triangular fuzzy number and it can be given by the following expression: 132231 ,, Bababab (3) The multiplication of two fuzzy numbers 123 (, , ) aaa and denoted as A*B can be defi ne d as: 123 (, , )Bbbb 1/2 2 11 1 1/2 2 12 1 () ()( ) 0 AB DDxPTPxQ o therwise DDxRU QxR (4) where 12121 Taabb 12121 Uaabb 2121 221 Taaabbb , , , 2321 32 Ubaaabb 1 , 2 11 2 T DT , 2 21 2 U DU , , , 11 Pab22 Qab3 Ra 3 b . It is evident that the resulting fuzzy number * B is not a triangular fuzzy number. But in most of the cases, computation with resulting fuzzy numbers becomes very tedious. Thus it is necessary to avoid the second and higher degree terms to make them computationally easy and therefore the product of two fuzzy numbers is re- duced to a triangular fuzzy number (P, Q, R) or (a1b1, a2b2, a3b3). 3. Basics of Possibility Theory Using fuzzy set theory, L. A. Zadeh [15] formulated pos- sibility theory in term of fuzzy set. This was an attempt to give a mathematical representation of linguistic un- certainty, i.e. the uncertainty associated with imprecise and vague information. In contrast to the objective char- acter of the probability theory, the possibility theory pro- vides tools for the modeling of subjective probabilities [16]. It is based upon the concept of the possibility dis- tribution. There is a direct connection between possibil- ity and fuzzy sets. This connection can be explained as follows: Let X deno te a variable, taking values from a un iversal set R and let us consider the equation x, where R be used to describe the fact that the value of X is x. Now, we consider a fuzzy set F on R that expresses an elastic constraint on values to be assigned to X. Then f or a particular value R , F(x) gives the degree of com- patibility of x with the concept described by F. Also for a given proposition X is F based upon fuzzy set F, it will be more realistic to interpret F(x) as the degree of possi- bility that x . So for a given fuzzy set F on R and the proposition “X is F” the possibility of () F rx x for each R is numerically equal to the de- gree F(x) to which x belongs to F i.e. () () F rx Fx for all R. The function defined by the equation given above is clearly a possibility distribution function on R. For a givenF, the associated possibility measure (PosF) is defined fo r all :[0, F rX r 1] () PX by the equation () sup () FF xA PosAr x . 4. Fuzzy Operators Now using algebraic operations on fuzzy numbers (tri- angular or trapezoidal), we can obtain fuzzy operators corresponding to Boolean operators “AND”, “OR” etc. Let 1 2n are the possibility functions of the basic events i = . Then fuzzy “AND” and “OR” operators denoted by ANF and ORF respectively, can be defined a s: ,p pp 1, 2,, n 12 1 (, ,, )n yn i pANFpp pp i where denotes the fuzzy multiplication. Now let ’s are represented by triangular fuzzy numbers i.e. i p 123 (,, ) iiii paaa , where i = 1, 2,,n. Then 121 2 3 11 1 123 (, ,,),, (, , ),say nn n ynii ii i yyy pANFpppa aa aaa i 3i a (5) 12 123 11 12 11 1 123 (, ,,) 111 1(,,) 1(1),1(1),1(1) (, , ),say. yn nn iiii ii nn n ii ii i yyyy pORFpp p paaa aa paaa (6) 5. Proposed Algorithm to Evaluate Failure Possibility of Bas ic Events In this proposed algorithm, fuzzy numbers are used in- stead of crisp numbers to represent failure probability of Copyright © 2011 SciRes. AM  S. K. TYAGI ET AL.1349 occurrence of each basic event in fault tree analysis. For the sake of simplicity, triangular fuzzy numbers are used to define the failure possibilit y of the basic events. Also a triangular fuzzy number is capable to capture the impre- cision of experts’ assessments, the vagueness of unreli- able data and easy to compute. Step 1: First identify an undesirable top event (Haz- ard), intermediate events and the basic events leading to top event by exploring history concerned with the failure of that event. And connect these events using logical gates “AND” and “OR” to find the pictorial representa- tion of occurrence of top event. Step 2: We observe that the basic events are follow- ing different statistical property of sampled data collec- ted for a particular event. So the data for the occurrence of the basic events are collected by three experts A, B and C taking observations under prescribed conditions classified as “Worst Case Condition”, “Conducive Envi- ronment and “Highly Conducive Environment” respec- tively. Step 3: Using sampled data collected by the experts A, B and C the possibility of occurren ce of basic events are assigned dif ferent fuzzy numbers. Step 4: It is a well known fact that mostly a system is operated under “Conducive Environment”. So it is as- sumed that the data collected for the failure of a basic event follows a skewed Beta distribution. Thus a tech- nique based on beta distribution is used to find a single fuzzy number to the failure possibility of a basic event. If , and are fuzzy numbers as- signed to a basic event i by Expert A, B and C taking observations in “Worst Case Condition”, “Conducive Environment” and “Highly Conducive Environment” re- spectively. Then the failu re possibility of the b asic event may be given as () wi pE i E () ci pE () hi pE E ()4pE () () () 6 wici hi i pE pE pE . (7) Step 5: The fuzzy number thus obtained for different basic events are used to compute failure possibility of top event. 6. Fuzzy Importance Index (FII) In fault tree analysis, ranking of basic events as per their importance play a vital role. To improve reliability of a system, it is better to improve the reliability of a basic event, having greater importance instead of the events with less importance. Let T be the failure possibility of top event and i T denote the failure possibility of occurrence of top event, if the basic event i does not happen. In other words we can say i T be the failure possibility of top event, when failure possibility of basic event is a crisp number (0 0 0). The distance of from will determine the importan ce of a basic event . p p E p i ET p i T p i EA basic event i will be of greater importance than the other basic event E E, if the distance between T and i T is greater than that of T and p p p T. The dis- tance between two fuzzy numbers may be obtained by using Hamming or Euclidean distance. The fuzzy impor- tance of each basic event may be quantified as Fuzzy Importance I nd e x (FII). p FII( ) = Distance of from i ET p i T p If the failure possibilities of the basic events are trian- gular fuzzy numbers, then the failure possibility of top event will also be a triangular fuzzy numbers. Here we denote and i T by the triplets and respectively. Thus the FII() for a basic event may be defined as follows. T p , iii u i E p (,, )lmu i E(, )lm 222 II( )ED(,) ()()( ) i iTT iii Epp llmmuu F (8) Thus for basic events Ei and Ej, if then the precipitation of basic event iwill be more sensitive than that of event FII( )FII() ij EE E E to improve system reli- ability. Using this method we can rank the basic events in accordance with their importance index. And improve the reliability of the system by prev enting the failure of a component of greater importance. 7. Case Study: Failure Possibility of Cannula Fault in Power Transformer 7.1. Fault Tree Analysis of Cannula Fault The fault tree of Cannula Fault in power transformer is taken as an analytical example to explain the proposed algorithm of fault diagnosis process. The fault tree of Cannula fault in power transformer is shown in Figure 1. Codes’ meaning of basic and intermediate events of Cannula Fault are as follows: Top event T: Cannula Fault; Intermediate Events: 1 : Cannula Overheating; 2 : Inside Discharging; 3 : Outer Insulated Flashover; 4 : Deterioration of Insulation; 5 : High Contact Resistance; 6 : Abnormal Overvoltage. Basic Events: 1 E E: Over loading ; 2 E: Natural Aging; 3 E: Insulated Damping; 4 E: Connector Loosening; 5: Interface Oxygenating; Copyright © 2011 SciRes. AM 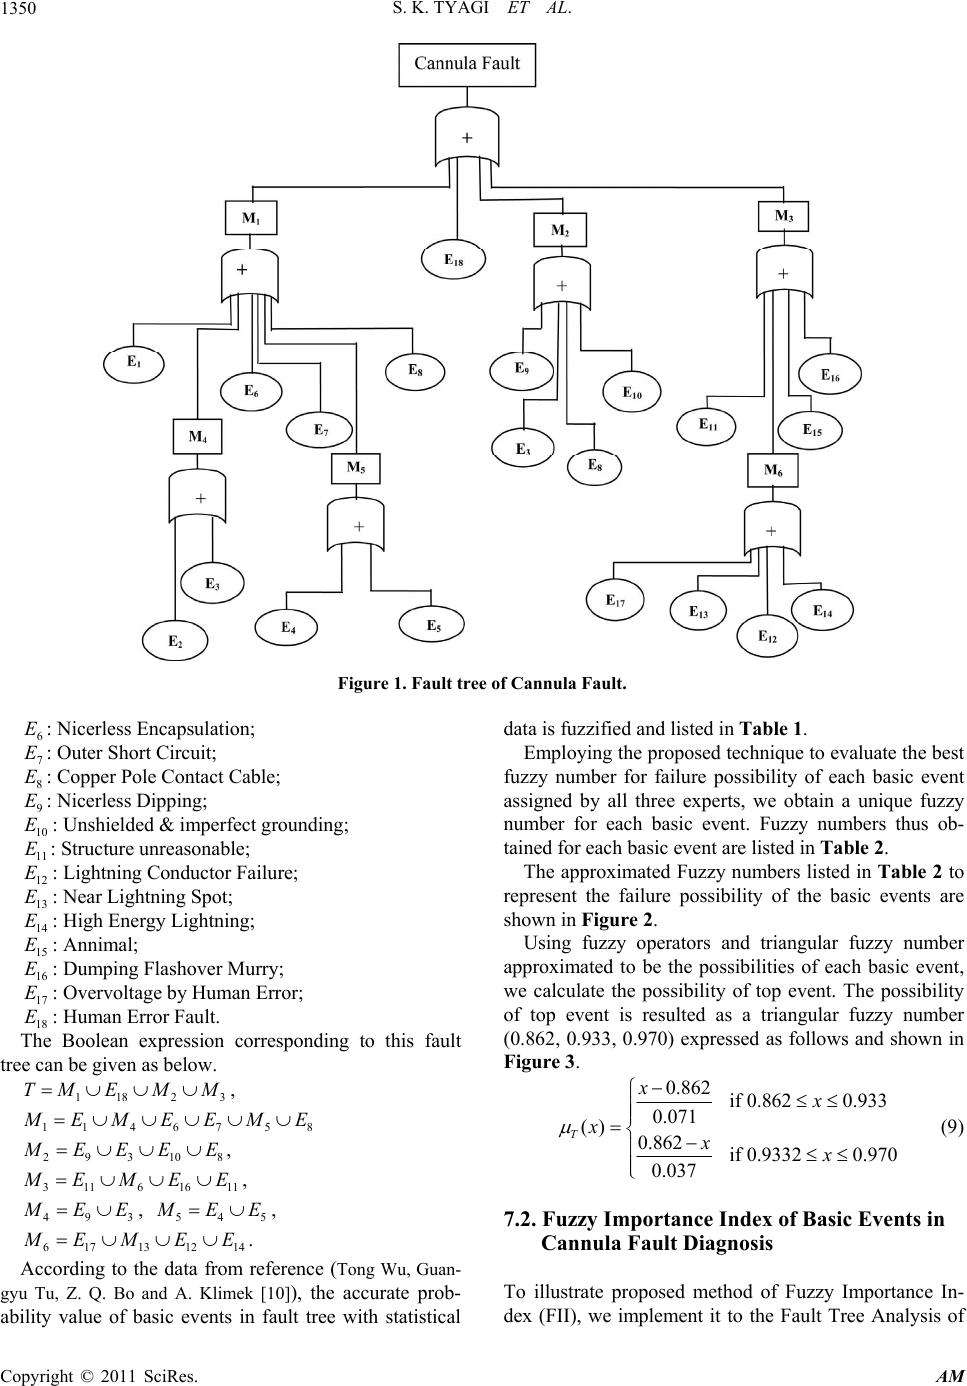 S. K. TYAGI ET AL. Copyright © 2011 SciRes. AM 1350 Figure 1. Fault tree of Cannula Fault. 6 E E: Nicerless Encapsulation; 7 E: Outer Short Circuit; 8 E: Copper Pole Contact Cable; 9 E: Nicerless Dipping; 10 E: Unshielded & imperfect grounding; 11 E: Structure unreasonable; 12 E: Lightning Conductor Failure; 13 E: Near Lightning Spot; 14 E: High Energy Lightning; 15 E: Annimal; 16 E: Dumping Flashover Murry; 17 E: Overvoltage by Human Error; 18 The Boolean expression corresponding to this fault tree can be given as below. : Human Error Fault. 118 2 TM EMM 3 8 , 1146 75 EM EEME 293108 EEE E , 3116 16 11 EMEE, 493 EE, 545 EE, 617 131214 EMEE . According to the data from reference (Tong Wu, Guan- gyu Tu, Z. Q. Bo and A. Klimek [10]), the accurate prob- ability value of basic events in fault tree with statistical data is fuzzified and listed in Table 1. Employing the propo sed technique to evaluate th e best fuzzy number for failure possibility of each basic event assigned by all three experts, we obtain a unique fuzzy number for each basic event. Fuzzy numbers thus ob- tained for each basic event are listed in Table 2. The approximated Fuzzy numbers listed in Table 2 to represent the failure possibility of the basic events are shown in Figure 2. Using fuzzy operators and triangular fuzzy number approximated to be the possibilities of each basic event, we calculate the possibility of top event. The possibility of top event is resulted as a triangular fuzzy number (0.862, 0.933, 0.970) expressed as follows and shown in Figure 3. 0.862 if0.8620.933 0.071 () 0.862 if 0.93320.970 0.037 T xx xxx (9) 7.2. Fuzzy Importance Index of Basic Events in Cannula Fault Diagnosis To illustrate proposed method of Fuzzy Importance In- dex (FII), we implement it to the Fault Tree Analysis of 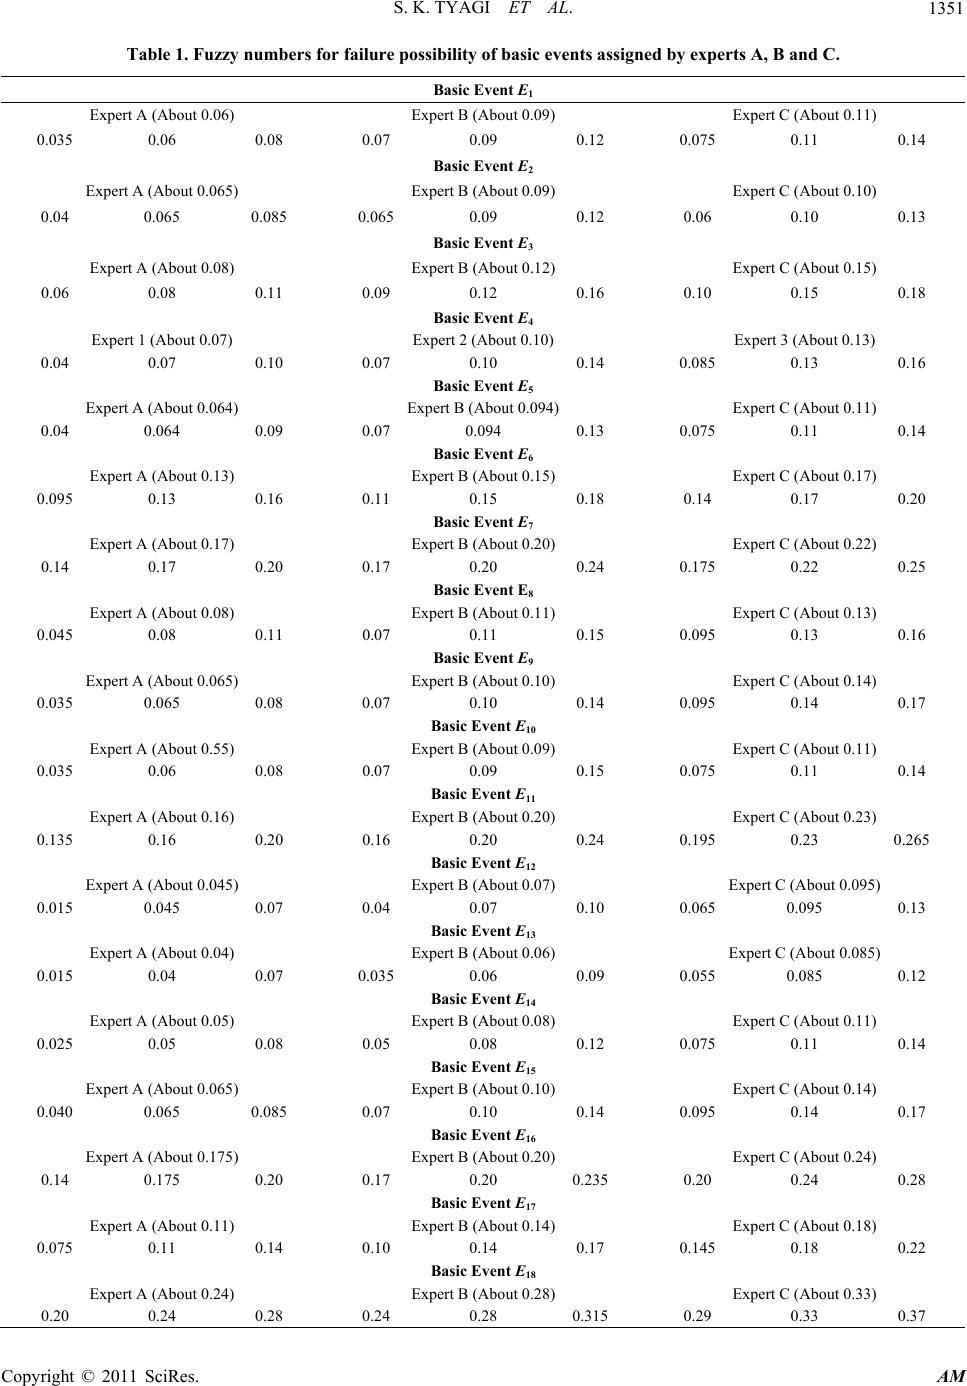 S. K. TYAGI ET AL. Copyright © 2011 SciRes. AM 1351 Table 1. Fuzzy numbers for failure possibility of basic events assigned by experts A, B and C. Basic Event E1 Expert A (About 0.06) Expert B (About 0.09) Expert C (About 0.11) 0.035 0.06 0.08 0.07 0.09 0.12 0.075 0.11 0.14 Basic Event E2 Expert A (About 0.065) Expert B (About 0.09) Expert C (About 0.10) 0.04 0.065 0.085 0.065 0.09 0.12 0.06 0.10 0.13 Basic Event E3 Expert A (About 0.08) Expert B (About 0.12) Expert C (About 0.15) 0.06 0.08 0.11 0.09 0.12 0.16 0.10 0.15 0.18 Basic Event E4 Expert 1 (About 0.07) Expert 2 (About 0.10) Expert 3 (About 0.13) 0.04 0.07 0.10 0.07 0.10 0.14 0.085 0.13 0.16 Basic Event E5 Expert A (About 0.064) Expert B (About 0.094) Expert C (About 0.11) 0.04 0.064 0.09 0.07 0.094 0.13 0.075 0.11 0.14 Basic Event E6 Expert A (About 0.13) Expert B (About 0.15) Expert C (About 0.17) 0.095 0.13 0.16 0.11 0.15 0.18 0.14 0.17 0.20 Basic Event E7 Expert A (About 0.17) Expert B (About 0.20) Expert C (About 0.22) 0.14 0.17 0.20 0.17 0.20 0.24 0.175 0.22 0.25 Basic Event E8 Expert A (About 0.08) Expert B (About 0.11) Expert C (About 0.13) 0.045 0.08 0.11 0.07 0.11 0.15 0.095 0.13 0.16 Basic Event E9 Expert A (About 0.065) Expert B (About 0.10) Expert C (About 0.14) 0.035 0.065 0.08 0.07 0.10 0.14 0.095 0.14 0.17 Basic Event E10 Expert A (About 0.55) Expert B (About 0.09) Expert C (About 0.11) 0.035 0.06 0.08 0.07 0.09 0.15 0.075 0.11 0.14 Basic Event E11 Expert A (About 0.16) Expert B (About 0.20) Expert C (About 0.23) 0.135 0.16 0.20 0.16 0.20 0.24 0.195 0.23 0.265 Basic Event E12 Expert A (About 0.045) Expert B (About 0.07) Expert C (About 0.095) 0.015 0.045 0.07 0.04 0.07 0.10 0.065 0.095 0.13 Basic Event E13 Expert A (About 0.04) Expert B (About 0.06) Expert C (About 0.085) 0.015 0.04 0.07 0.035 0.06 0.09 0.055 0.085 0.12 Basic Event E14 Expert A (About 0.05) Expert B (About 0.08) Expert C (About 0.11) 0.025 0.05 0.08 0.05 0.08 0.12 0.075 0.11 0.14 Basic Event E15 Expert A (About 0.065) Expert B (About 0.10) Expert C (About 0.14) 0.040 0.065 0.085 0.07 0.10 0.14 0.095 0.14 0.17 Basic Event E16 Expert A (About 0.175) Expert B (About 0.20) Expert C (About 0.24) 0.14 0.175 0.20 0.17 0.20 0.235 0.20 0.24 0.28 Basic Event E17 Expert A (About 0.11) Expert B (About 0.14) Expert C (About 0.18) 0.075 0.11 0.14 0.10 0.14 0.17 0.145 0.18 0.22 Basic Event E18 Expert A (About 0.24) Expert B (About 0.28) Expert C (About 0.33) 0.20 0.24 0.28 0.24 0.28 0.315 0.29 0.33 0.37 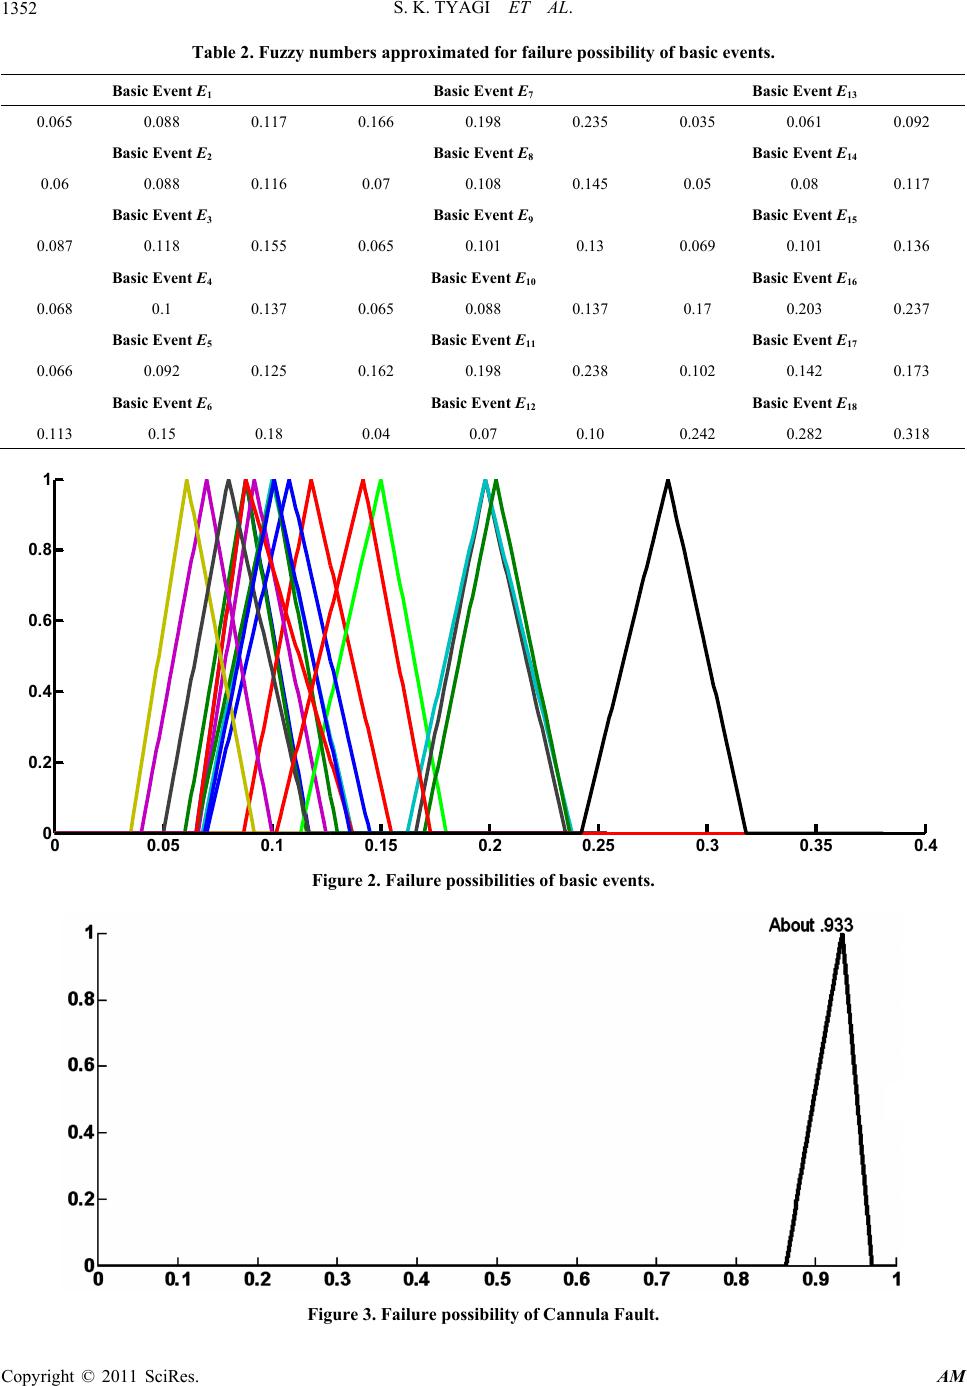 S. K. TYAGI ET AL. 1352 Table 2. Fuzzy numbers approximated for failure possibility of basic events. Basic Event E1 Basic Event E7 Basic Event E13 0.065 0.088 0.117 0.166 0.198 0.235 0.035 0.061 0.092 Basic Event E2 Basic Event E8 Basic Event E14 0.06 0.088 0.116 0.07 0.108 0.145 0.05 0.08 0.117 Basic Event E3 Basic Event E9 Basic Event E15 0.087 0.118 0.155 0.065 0.101 0.13 0.069 0.101 0.136 Basic Event E4 Basic Event E10 Basic Event E16 0.068 0.1 0.137 0.065 0.088 0.137 0.17 0.203 0.237 Basic Event E5 Basic Event E11 Basic Event E17 0.066 0.092 0.125 0.162 0.198 0.238 0.102 0.142 0.173 Basic Event E6 Basic Event E12 Basic Event E18 0.113 0.15 0.18 0.04 0.07 0.10 0.242 0.282 0.318 00.050.1 0.150.2 0.250.3 0.350.4 0 0. 2 0. 4 0. 6 0. 8 1 Figure 2. Failure possibilities of basic events. Figure 3. Failure possibility of Cannula Fault. Copyright © 2011 SciRes. AM 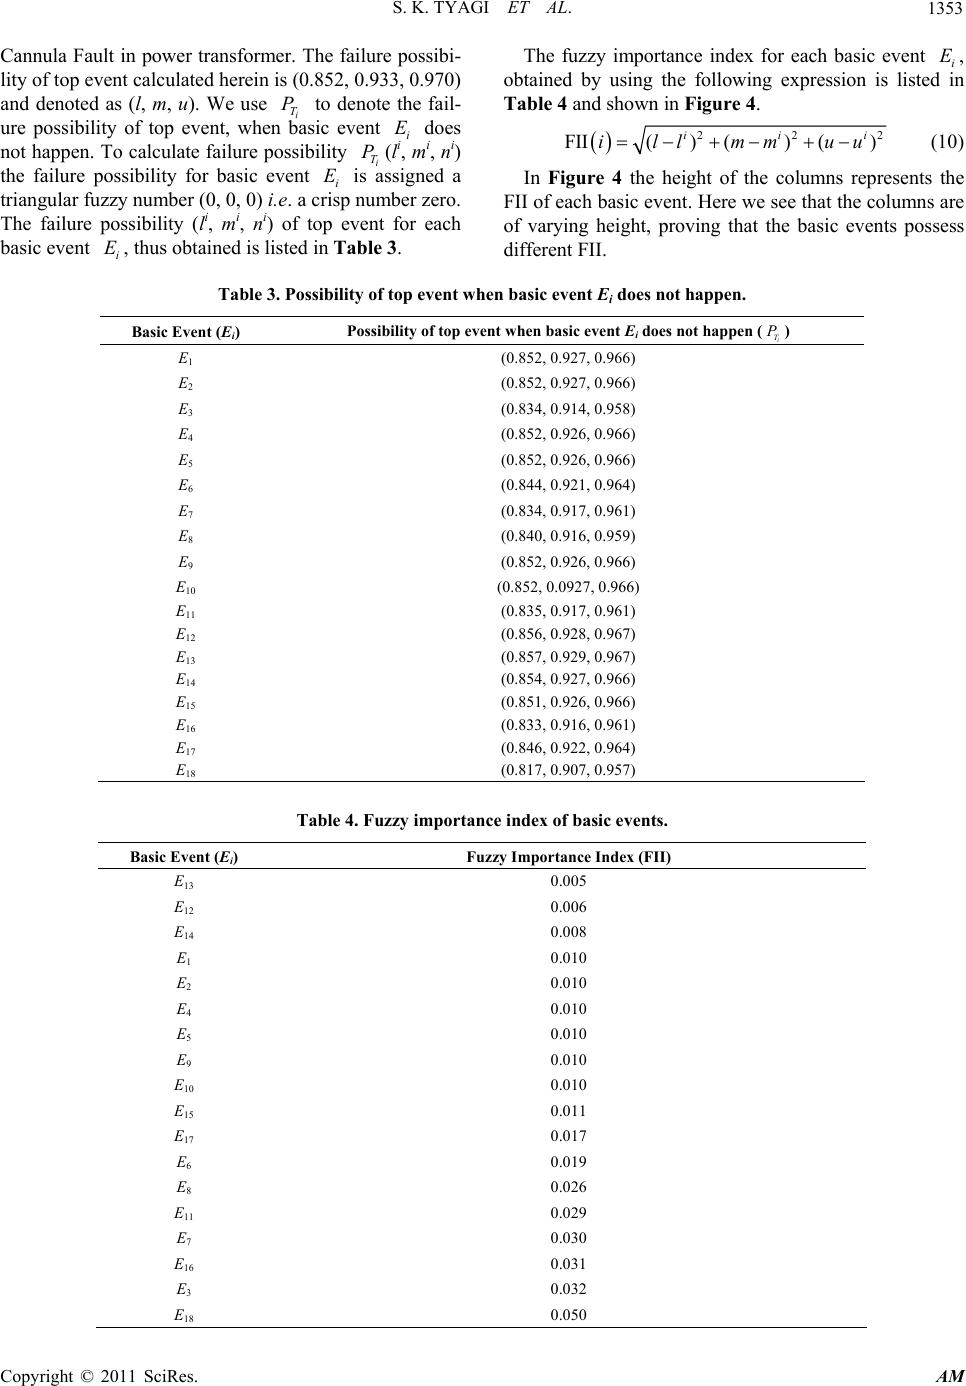 S. K. TYAGI ET AL. Copyright © 2011 SciRes. AM 1353 The fuzzy importance index for each basic event i, obtained by using the following expression is listed in Table 4 and shown in Figure 4. ECannula Fault in power transformer. The failure possibi- lity of top event calculated herein is (0.852, 0.933, 0.970) and denoted as (l, m, u). We use i T to denote the fail- ure possibility of top event, when basic event i does not happen. To calculate failure possibility i T(li, mi, ni) the failure possibility for basic event i is assigned a triangular fuzzy number (0, 0, 0) i.e. a crisp number zero. The failure possibility (li, m i, ni) of top event for each basic event , thus obtained is listed in Table 3. PE P E i E 22 FII()()() ii illmmuu 2i (10) In Figure 4 the height of the columns represents the FII of each basic event. Here we see that the columns are of varying height, proving that the basic events possess different FII. Table 3. Possibility of top event when basic event Ei does not happen. Basic Event (Ei) Possibility of top event when basic event Ei does not happen () i T P E1 (0.852, 0.927, 0.966) E2 (0.852, 0.927, 0.966) E3 (0.834, 0.914, 0.958) E4 (0.852, 0.926, 0.966) E5 (0.852, 0.926, 0.966) E6 (0.844, 0.921, 0.964) E7 (0.834, 0.917, 0.961) E8 (0.840, 0.916, 0.959) E9 (0.852, 0.926, 0.966) E10 (0.852, 0.0927, 0.966) E11 (0.835, 0.917, 0.961) E12 (0.856, 0.928, 0.967) E13 (0.857, 0.929, 0.967) E14 (0.854, 0.927, 0.966) E15 (0.851, 0.926, 0.966) E16 (0.833, 0.916, 0.961) E17 (0.846, 0.922, 0.964) E18 (0.817, 0.907, 0.957) Table 4. Fuzzy importance index of basic events. Basic Event (Ei) Fuzzy Importance Index (FII) E13 0.005 E12 0.006 E14 0.008 E1 0.010 E2 0.010 E4 0.010 E5 0.010 E9 0.010 E10 0.010 E15 0.011 E17 0.017 E6 0.019 E8 0.026 E11 0.029 E7 0.030 E16 0.031 E3 0.032 E18 0.050 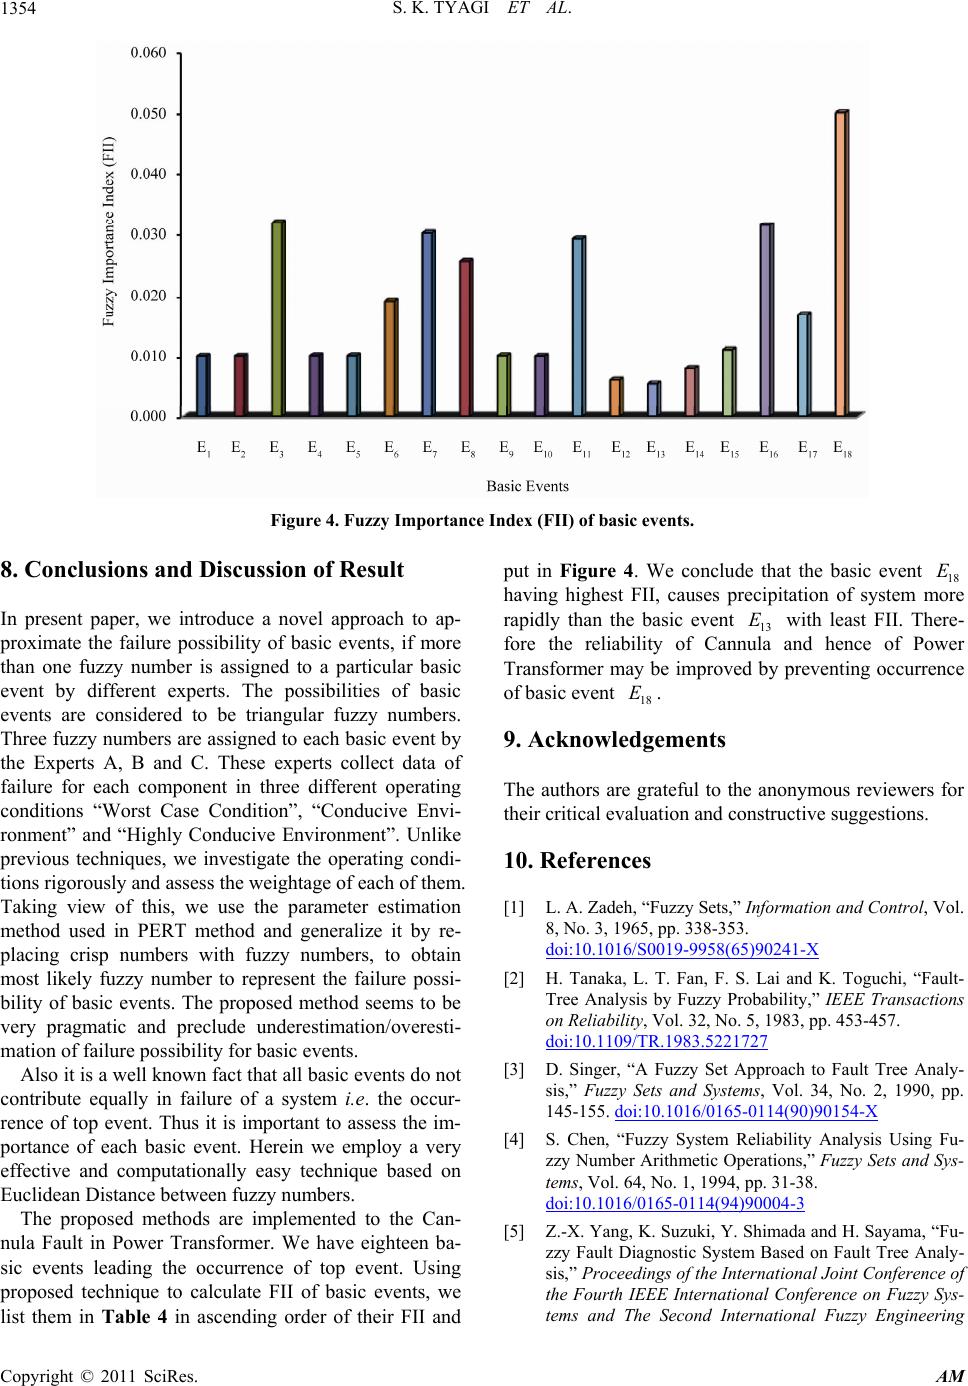 S. K. TYAGI ET AL. 1354 Figure 4. Fuzzy Importance Index (FII) of basic events. 8. Conclusions and Discussion of Result In present paper, we introduce a novel approach to ap- proximate the failure possibility of basic events, if more than one fuzzy number is assigned to a particular basic event by different experts. The possibilities of basic events are considered to be triangular fuzzy numbers. Three fuzzy numbers are assigned to each basic event by the Experts A, B and C. These experts collect data of failure for each component in three different operating conditions “Worst Case Condition”, “Conducive Envi- ronment” and “Highly Conducive Environment”. Unlike previous techniques, we investigate the operating condi- tions rigorously and assess the weightage of each of them. Taking view of this, we use the parameter estimation method used in PERT method and generalize it by re- placing crisp numbers with fuzzy numbers, to obtain most likely fuzzy number to represent the failure possi- bility of basic events. The proposed method seems to be very pragmatic and preclude underestimation/overesti- mation of failure possibility for basic events. Also it is a well known fact that all basic events do not contribute equally in failure of a system i.e. the occur- rence of top event. Thus it is important to assess the im- portance of each basic event. Herein we employ a very effective and computationally easy technique based on Euclidean Distance between fuzzy numbers. The proposed methods are implemented to the Can- nula Fault in Power Transformer. We have eighteen ba- sic events leading the occurrence of top event. Using proposed technique to calculate FII of basic events, we list them in Table 4 in ascending order of their FII and put in Figure 4. We conclude that the basic event 18 having highest FII, causes precipitation of system more rapidly than the basic event 13 with least FII. There- fore the reliability of Cannula and hence of Power Transformer may be improved by preventing occurrence of basic event . E E 18 E 9. Acknowledgements The authors are grateful to the anonymous reviewers for their critical evaluation and constructive suggestions. 10. References [1] L. A. Zadeh, “Fuzzy Sets,” Information and Control, Vol. 8, No. 3, 1965, pp. 338-353. doi:10.1016/S0019-9958(65)90241-X [2] H. Tanaka, L. T. Fan, F. S. Lai and K. Toguchi, “Fault- Tree Analysis by Fuzzy Probability,” IEEE Transactions on Reliability, Vol. 32, No. 5, 1983, pp. 453-457. doi:10.1109/TR.1983.5221727 [3] D. Singer, “A Fuzzy Set Approach to Fault Tree Analy- sis,” Fuzzy Sets and Systems, Vol. 34, No. 2, 1990, pp. 145-155. doi:10.1016/0165-0114(90)90154-X [4] S. Chen, “Fuzzy System Reliability Analysis Using Fu- zzy Number Arithmetic Operations,” Fuzzy Sets and Sys- tems, Vol. 64, No. 1, 1994, pp. 31-38. doi:10.1016/0165-0114(94)90004-3 [5] Z.-X. Yang, K. Suzuki, Y. Shimada and H. Sayama, “Fu- zzy Fault Diagnostic System Based on Fault Tree Analy- sis,” Proceedings of the International Joint Conference of the Fourth IEEE International Conference on Fuzzy Sys- tems and The Second International Fuzzy Engineering Copyright © 2011 SciRes. AM  S. K. TYAGI ET AL.1355 Symposium, Yakohama, 20-24 March 1995, Vol. 1, pp. 165-170. doi:10.1109/FUZZY.1995.409676 [6] D. Pandey and S. K. Tyagi, “Profust Reliability of a Gracefully Degradable System,” Fuzzy Sets and Systems, Vol. 158, No. 7, 2007, pp. 794-803. doi:10.1016/j.fss.2006.10.022 [7] D. Pandey, S. K. Tyagi and V. Kumar, “Failure Mode Screening Using Fuzzy Set Theory,” International Ma- thematical Forum, Vol. 4, No. 16, 2009, pp. 779-794 [8] Y.-S. Fu, F.-Z. Liu, W.-Z. Zhang, Q.-I. Zhang and G.-X. Zhang, “The Fault Diagnosis of Power Transformer Based on Rough Set Theory,” Proceedings of the China Interna- tional Conference on Electricity Distribution, Guangzhou, 10-13 December 2008, pp. 1-5. [9] Y. L. Chen and T. J. Zhang, “Research on Application of Fuzzy Fault Tree Analysis Method in the Machinery Equipment Fault Diagnosis,” Proceedings of 2nd Inter- national Conference on Informatics in Control, Automa- tion and Robotics, Wuhan, 6-7 March 2010, pp. 84-87. [10] T. Wu, G. Y. Tu, Z. Q. Bo and A. Klimek “Fuzzy Set Theory and Fault Tree Analysis Based Method Suitable for Fault Diagnosis of Power Transformer,” Proceedings of the 14th International Conference on the Intelligent System Applications to Power Systems, Kaohsiung, 5-8 November 2007, pp. 487-491. doi:10.1109/ISAP.2007.4441664 [11] S. K. Tyagi, D. Pandey and R. Tyagi, “Fuzzy Set Theoretic Approach to Fault Tree Analysis,” International Journal of Engineering, Science and Technology, Vol. 2, No. 5, 2010, pp. 276-283. [12] S. D. Moitra, “Skewness a nd the Beta Distribution,” Jour- nal of Operational Research Society, Vol. 41, No. 10, 1990, pp. 953-961. [13] H. Furuta and N. Shiraishi, “Fuzzy Importance in Fault Tree Analysis,” Fuzzy Sets and Systems, Vol. 12, No. 3, 1984, pp. 205-213. doi:10.1016/0165-0114(84)90068-X [14] P. V. Suresh, A. K. Babar and V. V. Raj, “Uncertainty in Fault Tree Analysis: A Fuzzy Approach,” Fuzzy Sets and Systems, Vol. 83, No. 2, 1996, pp. 135-141. doi:10.1016/0165-0114(95)00386-X [15] L. A. Zadeh “Fuzzy Sets as the Basis for a Theory of Po- ssibility,” Fuzzy Sets and Systems, Vol. 1, No. 1, 1978, pp. 3-28. doi:10.1016/0165-0114(78)90029-5 [16] G. J. Klir and B. Yuan, “Fuzzy Sets and Fuzzy Logic: Theory and Applications,” Prentice-Hall, Upper Saddle River, 1995. Copyright © 2011 SciRes. AM
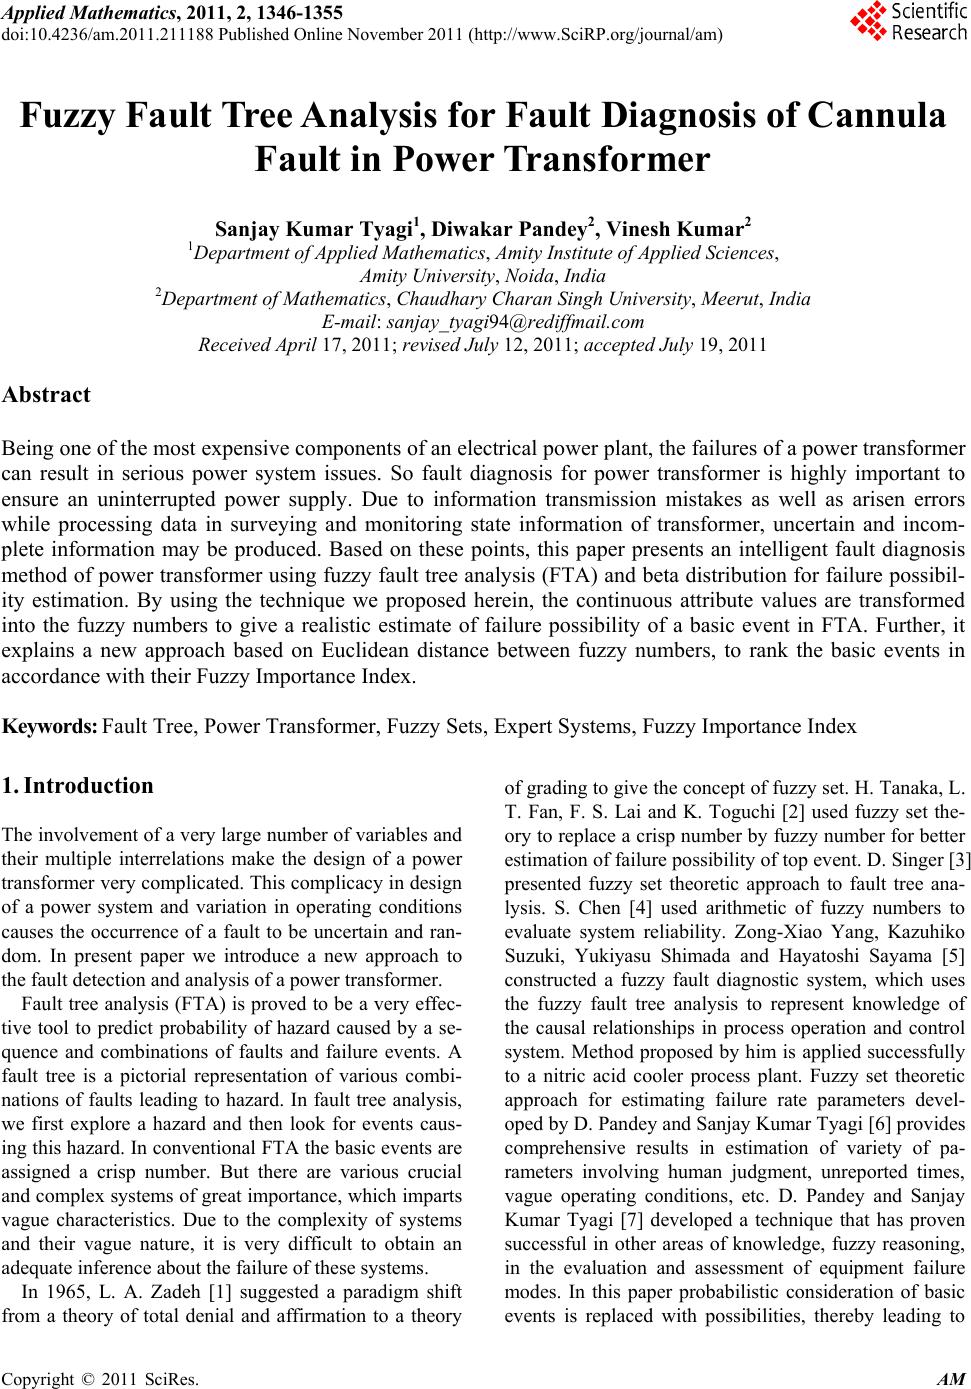
|