Paper Menu >>
Journal Menu >>
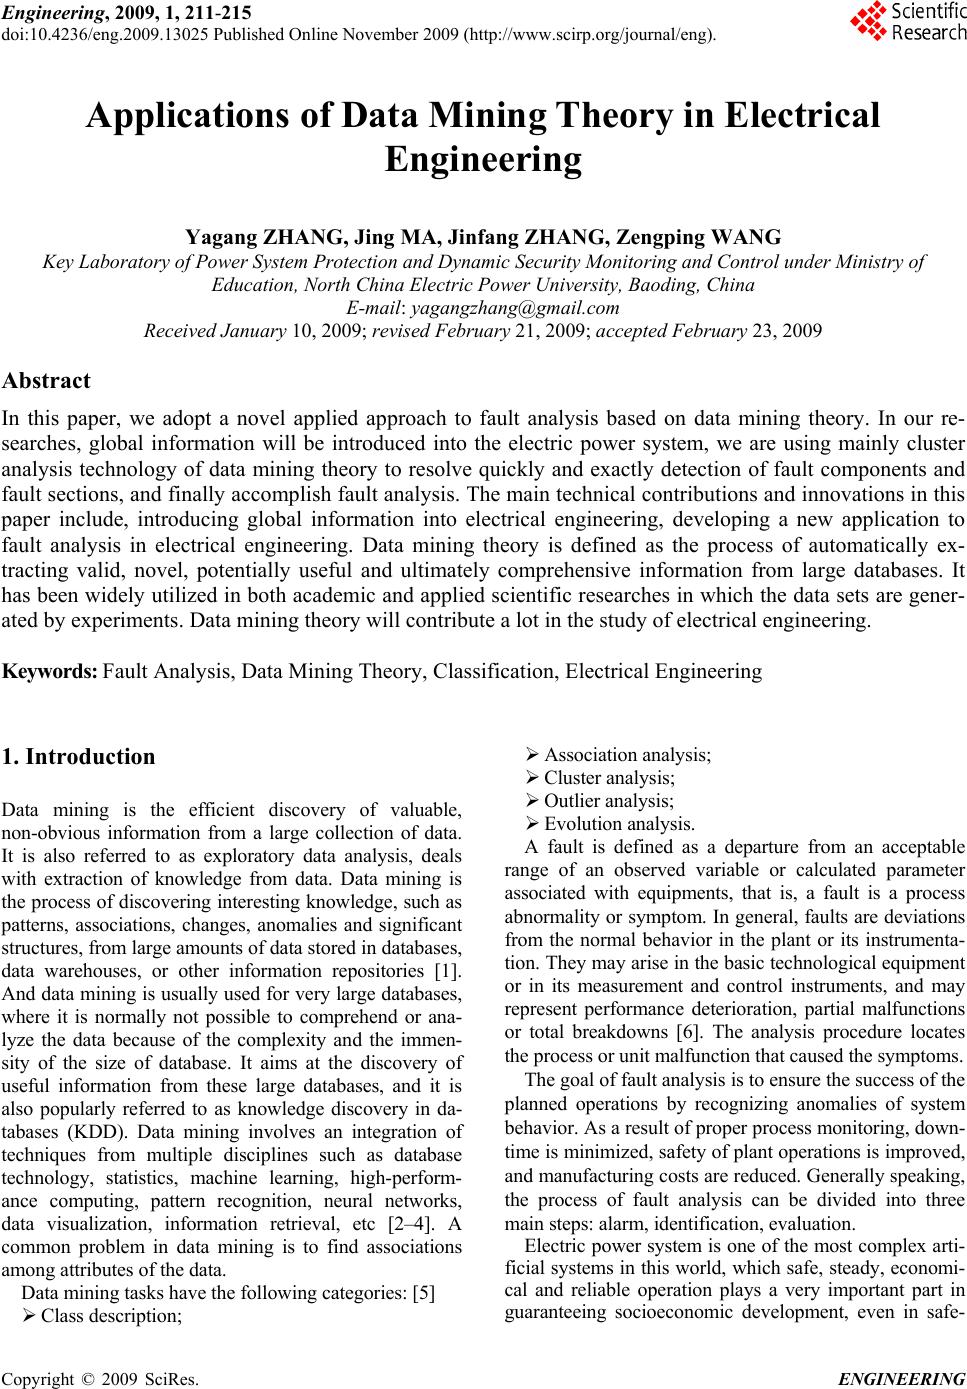 Engineering, 2009, 1, 211-215 doi:10.4236/eng.2009.13025 Published Online November 2009 (http://www.scirp.org/journal/eng). Copyright © 2009 SciRes. ENGINEERING Applications of Data Mining Theory in Electrical Engineering Yagang ZHANG, Jing MA, Jinfang ZHANG, Zengping WANG Key Laboratory of Power System Protection and Dynamic Security Monitoring and Control under Ministry of Education, North China Electric Power University, Baoding, China E-mail: yagangzhang@gmail.com Received January 10, 2009; revised February 21, 2009; accepted February 23, 2009 Abstract In this paper, we adopt a novel applied approach to fault analysis based on data mining theory. In our re- searches, global information will be introduced into the electric power system, we are using mainly cluster analysis technology of data mining theory to resolve quickly and exactly detection of fault components and fault sections, and finally accomplish fault analysis. The main technical contributions and innovations in this paper include, introducing global information into electrical engineering, developing a new application to fault analysis in electrical engineering. Data mining theory is defined as the process of automatically ex- tracting valid, novel, potentially useful and ultimately comprehensive information from large databases. It has been widely utilized in both academic and applied scientific researches in which the data sets are gener- ated by experiments. Data mining theory will contribute a lot in the study of electrical engineering. Keywords: Fault Analysis, Data Mining Theory, Classification, Electrical Engineering 1. Introduction Data mining is the efficient discovery of valuable, non-obvious information from a large collection of data. It is also referred to as exploratory data analysis, deals with extraction of knowledge from data. Data mining is the process of discovering interesting knowledge, such as patterns, associations, changes, anomalies and significant structures, from large amounts of data stored in databases, data warehouses, or other information repositories [1]. And data mining is usually used for very large databases, where it is normally not possible to comprehend or ana- lyze the data because of the complexity and the immen- sity of the size of database. It aims at the discovery of useful information from these large databases, and it is also popularly referred to as knowledge discovery in da- tabases (KDD). Data mining involves an integration of techniques from multiple disciplines such as database technology, statistics, machine learning, high-perform- ance computing, pattern recognition, neural networks, data visualization, information retrieval, etc [2–4]. A common problem in data mining is to find associations among attributes of the data. Data mining tasks have the following categories: [5] Class description; Association analysis; Cluster analysis; Outlier analysis; Evolution analysis. A fault is defined as a departure from an acceptable range of an observed variable or calculated parameter associated with equipments, that is, a fault is a process abnormality or symptom. In general, faults are deviations from the normal behavior in the plant or its instrumenta- tion. They may arise in the basic technological equipment or in its measurement and control instruments, and may represent performance deterioration, partial malfunctions or total breakdowns [6]. The analysis procedure locates the process or unit malfunction that caused the symptoms. The goal of fault analysis is to ensure the success of the planned operations by recognizing anomalies of system behavior. As a result of proper process monitoring, down- time is minimized, safety of plant operations is improved, and manufacturing costs are reduced. Generally speaking, the process of fault analysis can be divided into three main steps: alarm, identification, evaluation. Electric power system is one of the most complex arti- ficial systems in this world, which safe, steady, economi- cal and reliable operation plays a very important part in guaranteeing socioeconomic development, even in safe-  Y. G. ZHANG ET AL. Copyright © 2009 SciRes. ENGINEERING 212 guarding social stability. In order to resolve this difficult problem, some methods and technologies that can reflect modern science and technology level have been intro- duced into this domain. Of course, no matter what kind of new analytical method or technical means we adopt, we must have a distinct recognition of electric power system itself and its complexity, and increase continuously analysis, operation and control level [7–11]. When electric power system operates from normal state to failure or abnormal operates, its electric quantities may change significantly. Relay protection is just using the sudden changes of electric to distinguish whether the power system is failure or abnormal operation. After con- trasting the electric variational measurements with the electric parameters of normal system, we can detect fault types and fault locations. Furthermore, we can implement selective failure removal. In our researches, global infor- mation will be introduced into the backup protection sys- tem. After some accidents, utilizing real-time measure- ments of phasor measurement unit (PMU), we will seek after for characters of electrical quantities’ marked chan- ges. Then we can carry out quickly and exactly analysis of fault components and fault sections, finally, we can accomplish fault isolation. Basing on statistical theory, we have carried out large numbers of basic researches in nonlinear complex systems [12–14]. In this paper, we are using mainly cluster analysis technology of data mining theory to resolve fault detection problem in electrical en- gineering. 2. Electric Circuit Principle We consider a circuit with resistors(R), inductors (L), and capacitors(C) [15]. The simplest circuit has one element of each connected in a loop. The part of the circuit containing one element is called a branch. The points where the branches connect are called nodes. In this simplest exam- ple, there are three branches and nodes. See Figure 1. We let R i,and be the current in the resistor, indu- ctor and capacitor respectively. Similarly let , and be the voltage drop across the three branches of the circuit. If we think of water flowing through pipes, then the current is like the rate of flow of water, and the voltage is like water pressure. Kirchhoff’s current law states that the total current flowing into a node must equal the current flowing out of that node. In the circuit L iC i R vL v C v Figure 1. RLC electric circuit. being discussed, this means that R LC iiiwith the correct choice of signs. We orient the branches in the direction given in Figure.1, so, R LC iii i . Kirchhoff’s voltage law states that the sum of the voltage drops around any loop is zero. For the present example, this just means that, 0 RLC vvv Next, we need to describe the properties of the ele- ments and the laws that determine how the variables change. A resistor is determined by a relationship betw- een the current and voltage. In the present sec- tion, we consider only a linear resistor given by R iR v R R vRi where is a constant. This is Ohm’s law. In further discussions, we consider as a nonlinear function of or as a nonlinear function of. 0R R i R v R iR v An inductor is characterized by giving the time deriva- tive of the current L di dt , in terms of the voltage : Fara- day’s law has proved that C v L L di Lv dt where the constant is called the inductance. Classically, an inductor was constructed by making a coil of wire. Then, the magnetic field induced by the change of current in the coil creates a voltage drop across the coil. 0L A capacitor is characterized by giving the time deriva- tive of the voltageC dv dt , in terms of the current , C i C C dv Ci dt where the constant is called the capacitance. 0C 3. Classification in the Data Mining Classification is one of the classical topics in the data mining field. Clustering is the process of grouping data objects into a set of disjoint classes, called clusters, so that objects within a class have high similarity to each other, while objects in separate classes are more dissimi- lar. Clustering is an example of unsupervised classifica- tion. “Classification” refers to a procedure that assigns data objects to a set of classes. “Unsupervised” means that clustering does not rely on predefined classes and training examples while classifying the data objects. Theories of classification come from philosophy, 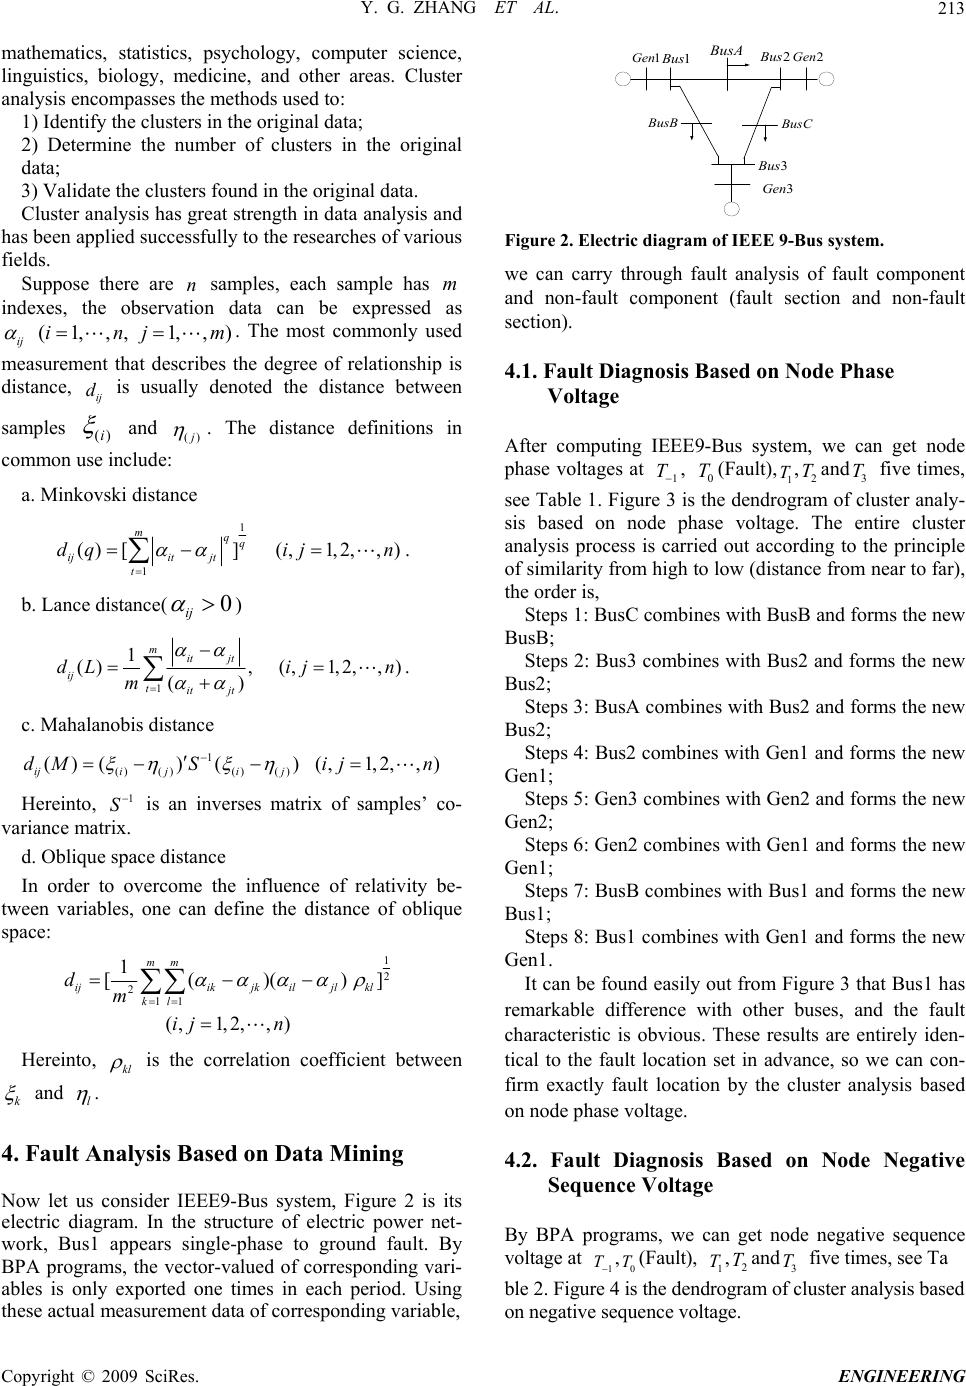 Y. G. ZHANG ET AL.213 )m mathematics, statistics, psychology, computer science, linguistics, biology, medicine, and other areas. Cluster analysis encompasses the methods used to: 1) Identify the clusters in the original data; 2) Determine the number of clusters in the original data; 3) Validate the clusters found in the original data. Cluster analysis has great strength in data analysis and has been applied successfully to the researches of various fields. Suppose there are samples, each sample has indexes, the observation data can be expressed as n 1, m (1,,, , ij inj ij d ()i . The most commonly used measurement that describes the degree of relationship is distance, is usually denoted the distance between samples and ()j . The distance definitions in common use include: a. Minkovski distance 1 1 ()[] (,1,2,,) mqq ijit jt t dqij n . b. Lance distance(0 ij ) 1 1 (), (,1,2,,) () mitjt ij titjt dLijn m . c. Mahalanobis distance 1 ()()()( ) ()()() (,1,2,,) ijij ij dMSij n Hereinto, is an inverses matrix of samples’ co- variance matrix. 1 S d. Oblique space distance In order to overcome the influence of relativity be- tween variables, one can define the distance of oblique space: 1 2 2 11 1 [()() ] (,1,2,,) mm ijikjkiljl kl kl dm ij n Hereinto, kl is the correlation coefficient between k and l . 4. Fault Analysis Based on Data Mining Now let us consider IEEE9-Bus system, Figure 2 is its electric diagram. In the structure of electric power net- work, Bus1 appears single-phase to ground fault. By BPA programs, the vector-valued of corresponding vari- ables is only exported one times in each period. Using these actual measurement data of corresponding variable, 1Gen 2Gen 3Gen 1 B us 2 B us 3Bus BusA BusB BusC Figure 2. Electric diagram of IEEE 9-Bus system. we can carry through fault analysis of fault component and non-fault component (fault section and non-fault section). 4.1. Fault Diagnosis Based on Node Phase Voltage After computing IEEE9-Bus system, we can get node phase voltages at 1 T , (Fault), ,and five times, see Table 1. Figure 3 is the dendrogram of cluster analy- sis based on node phase voltage. The entire cluster analysis process is carried out according to the principle of similarity from high to low (distance from near to far), the order is, 0 T1 T2 T3 T Steps 1: BusC combines with BusB and forms the new BusB; Steps 2: Bus3 combines with Bus2 and forms the new Bus2; Steps 3: BusA combines with Bus2 and forms the new Bus2; Steps 4: Bus2 combines with Gen1 and forms the new Gen1; Steps 5: Gen3 combines with Gen2 and forms the new Gen2; Steps 6: Gen2 combines with Gen1 and forms the new Gen1; Steps 7: BusB combines with Bus1 and forms the new Bus1; Steps 8: Bus1 combines with Gen1 and forms the new Gen1. It can be found easily out from Figure 3 that Bus1 has remarkable difference with other buses, and the fault characteristic is obvious. These results are entirely iden- tical to the fault location set in advance, so we can con- firm exactly fault location by the cluster analysis based on node phase voltage. 4.2. Fault Diagnosis Based on Node Negative Sequence Voltage By BPA programs, we can get node negative sequence voltage at 1 T ,(Fault), ,and five times, see Ta 0 T1 T2 T3 T ble 2. Figure 4 is the dendrogram of cluster analysis based on negative sequence voltage. Copyright © 2009 SciRes. ENGINEERING 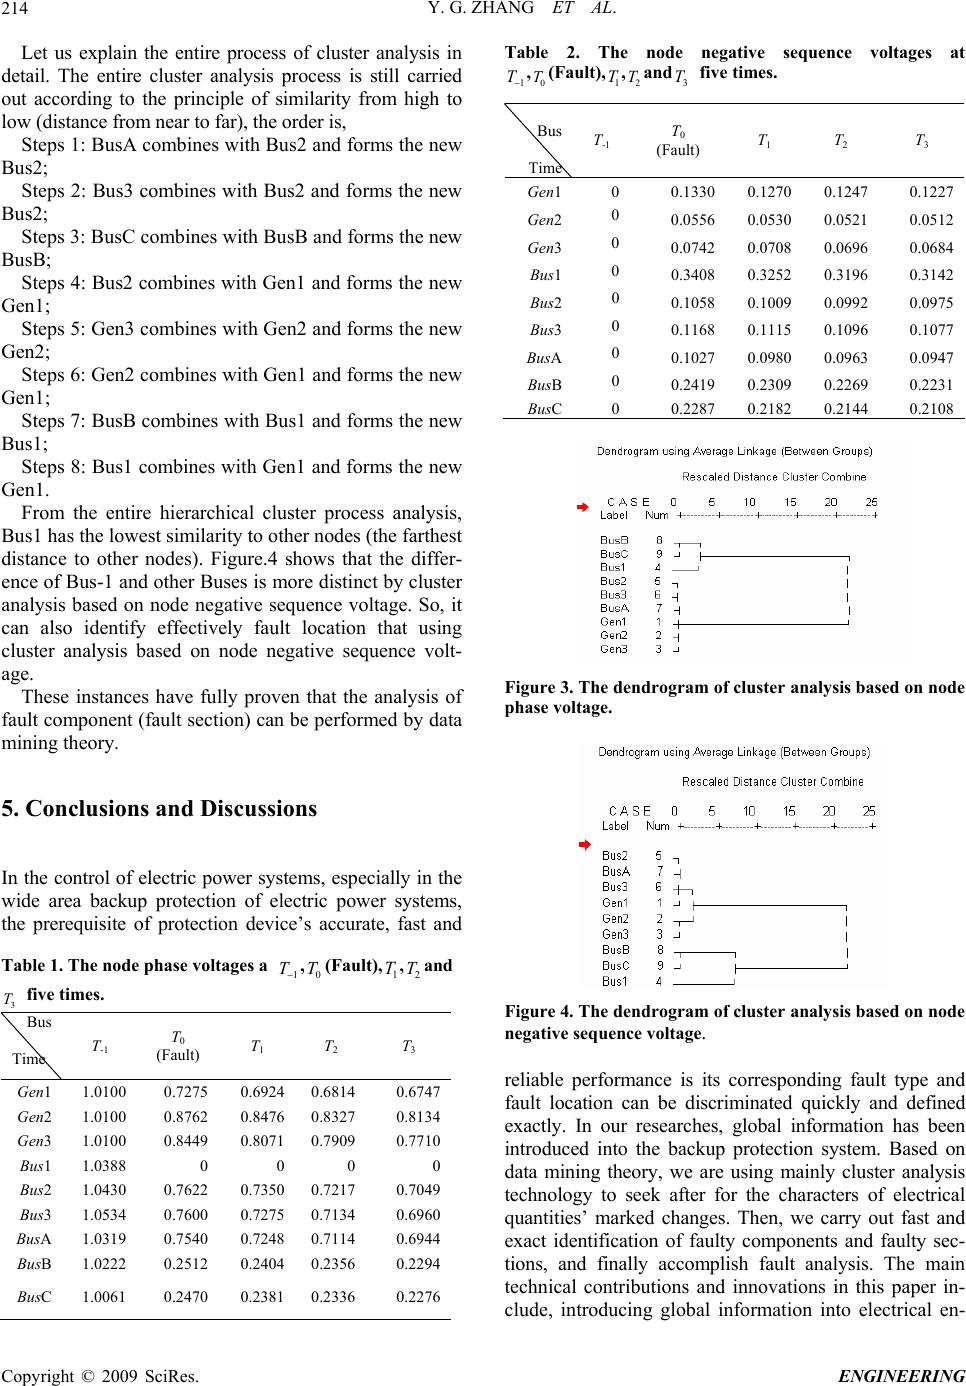 Y. G. ZHANG ET AL. Copyright © 2009 SciRes. ENGINEERING 214 Let us explain the entire process of cluster analysis in detail. The entire cluster analysis process is still carried out according to the principle of similarity from high to low (distance from near to far), the order is, Steps 1: BusA combines with Bus2 and forms the new Bus2; Steps 2: Bus3 combines with Bus2 and forms the new Bus2; Steps 3: BusC combines with BusB and forms the new BusB; Steps 4: Bus2 combines with Gen1 and forms the new Gen1; Steps 5: Gen3 combines with Gen2 and forms the new Gen2; Steps 6: Gen2 combines with Gen1 and forms the new Gen1; Steps 7: BusB combines with Bus1 and forms the new Bus1; Steps 8: Bus1 combines with Gen1 and forms the new Gen1. From the entire hierarchical cluster process analysis, Bus1 has the lowest similarity to other nodes (the farthest distance to other nodes). Figure.4 shows that the differ- ence of Bus-1 and other Buses is more distinct by cluster analysis based on node negative sequence voltage. So, it can also identify effectively fault location that using cluster analysis based on node negative sequence volt- age. These instances have fully proven that the analysis of fault component (fault section) can be performed by data mining theory. 5. Conclusions and Discussions In the control of electric power systems, especially in the wide area backup protection of electric power systems, the prerequisite of protection device’s accurate, fast and Table 1. The node phase voltages a ,(Fault),1 T,and 1 T0 T2 T 3 five times. T Bus Time T-1 T0 (Fault) T1 T2 T3 Gen1 1.0100 0.7275 0.6924 0.6814 0.6747 Gen2 1.0100 0.8762 0.8476 0.8327 0.8134 Gen3 1.0100 0.8449 0.8071 0.7909 0.7710 Bus1 1.0388 0 0 0 0 Bus2 1.0430 0.7622 0.7350 0.7217 0.7049 Bus3 1.0534 0.7600 0.7275 0.7134 0.6960 BusA 1.0319 0.7540 0.7248 0.7114 0.6944 BusB 1.0222 0.2512 0.2404 0.2356 0.2294 BusC 1.0061 0.2470 0.2381 0.2336 0.2276 Table 2. The node negative sequence voltages at 1 T ,(Fault),1 T,and five times. 0 T2 T3 T Bus Time T-1 T0 (Fault) T1 T2 T3 Gen1 0 0.1330 0.1270 0.1247 0.1227 Gen2 0 0.0556 0.0530 0.0521 0.0512 Gen3 0 0.0742 0.0708 0.0696 0.0684 Bus1 0 0.3408 0.3252 0.3196 0.3142 Bus2 0 0.1058 0.1009 0.0992 0.0975 Bus3 0 0.1168 0.1115 0.1096 0.1077 BusA 0 0.1027 0.0980 0.0963 0.0947 BusB 0 0.2419 0.2309 0.2269 0.2231 BusC 0 0.2287 0.2182 0.2144 0.2108 Figure 3. The dendrogram of cluster analysis based on node phase voltage. Figure 4. The dendrogram of cluster analysis based on node negative sequence voltage. reliable performance is its corresponding fault type and fault location can be discriminated quickly and defined exactly. In our researches, global information has been introduced into the backup protection system. Based on data mining theory, we are using mainly cluster analysis technology to seek after for the characters of electrical quantities’ marked changes. Then, we carry out fast and exact identification of faulty components and faulty sec- tions, and finally accomplish fault analysis. The main technical contributions and innovations in this paper in- clude, introducing global information into electrical en-  Y. G. ZHANG ET AL. Copyright © 2009 SciRes. ENGINEERING 215 gineering, developing a new application to fault analysis in electrical engineering. Data mining is defined as the process of automatically extracting valid, novel, potentially useful and ultimately comprehensive information from large databases. It has been widely utilized in both academic and applied scien- tific researches in which the data sets are generated by experiments. The most important characteristic of data mining theory is its interdisciplinarity and universality. Data mining is largely connected with machine learning in which scientists develop algorithms and techniques to find and describe potential laws in data. Generally speak- ing, data mining adds useful techniques to many other fields such as information processing, pattern recognition and artificial intelligence etc. 6. Acknowledgment This research was supported partly by Key Program of National Natural Science Foundation of China (50837002, 50907021) and the Science Foundation for the Doctors of NCEPU. 7. References [1] Y. Shi, “Dynamic data mining on multi-dimensional data,” Ph. D. thesis of State University of New York at Buffalo, 2006. [2] J. W. Han and M. Kamber, “Data mining: Concepts and techniques,” Second Edition, Morgan Kaufmann, Elsevier, San Francisco, 2006. [3] D. Dursun, F. Christie, M. Charles and R. Deepa, “Analysis of healthcare coverage: A data mining approach,” Expert Systems with Applications, Vol. 36, No. 2, pp. 995–1003, 2009. [4] Y. J. Kwon, O. A. Omitaomu, and G. N. Wang, “Data mining approaches for modeling complex electronic circuit design activities,” Computers & Industrial Engineering, Vol. 54, No. 2, pp. 229–241, 2008. [5] K. G. Srinivasa, K. R. Venugopal, and L. M. Patnaik, “A self–adaptive migration model genetic algorithm for data mining applications,” Information Sciences, Vol. 177, No. 20, pp. 4295–4313, 2007. [6] J. Cao, “Principal component analysis based fault dection and isolation”, Ph. D. thesis of George Mason University of Virginia, 2004. [7] J. X. Yuan, “Wide area protection and emergency control to prevent large scale blackout,” China Electric Power Press, Beijing, 2007. [8] L. Ye, “Study on sustainable development strategy of electric power in China in 2020,” Electric Power, Vol. 36, No. 10, pp. 1–7, 2003. [9] Y. S. Xue, “Interactions between power market stability and power system stability,” Automation of Electric Power Systems, Vol. 26, No. 21–22, pp. 1–6, pp. 1–4, 2002. [10] Q. X. Yang, “A review of the application of WAMS information in electric power system protective relaying,” Modern Electric Power, No. 3, pp. 1, 2006. [11] J. Yi and X. X. Zhou, “A survey on power system wide-area protection and control,” Power System Technology, Vol. 30, pp. 7–13, 2006. [12] Y. G. Zhang, P. Zhang, and H.F. Shi, “Statistic character in nonlinear systems,” Proceedings of the Sixth International Conference on Machine Learning and Cybernetics (ICMLC), Hong Kong, Vol. 5, pp. 2598– 2602, August 2007. [13] Y. G. Zhang, C. J. Wang, and Z. Zhou, “Inherent randomicity in 4-symbolic dynamics,” Chaos, Solitons and Fractals, Vol. 28, No. 1, pp. 236–243, 2006. [14] Y. G. Zhang and C. J. Wang, “Multiformity of inherent randomicity and visitation density in n-symbolic dynamics,” Chaos, Solitons and Fractals, Vol. 33, No. 2, pp. 685–694, 2007. [15] R. C. Robinson, “An introduction to dynamical systems: Continuous and discrete,” Pearson Education, New Jersey, 2004. |