Open Journal of Physical Chemistry, 2011, 1, 124-130
doi:10.4236/ojpc.2011.13017 Published Online November 2011 (http://www.SciRP.org/journal/ojpc)
Copyright © 2011 SciRes. OJPC
A Study on Catalysis by Ferrospinels for Preventing
Atmospheric Pollution from Carbon Monoxide
Chennampilly Ummer Aniz, Thengumthanam Damodaran Radhakrishnan Nair*
School of Chemical Sciences, Payyanur Campus, Kannur University, Kerala, India.
*E-mail: tdrnair@rediffmail.com
Received July 19, 2011; revised August 22, 2011; accepted October 9, 2011
Abstract
Ferrospinel catalyst samples containing Nickel, Cobalt and Copper have been synthesized by room tempera-
ture co-precipitation route and have been found to be effective for the oxidative removal of carbon monoxide
from automobile exhaust gases even at relatively lower temperatures (cold-start). These catalyst materials
have been characterized by modern physico-chemical techniques such as XRD, TG, BET-BJH and SEM etc.
Nitrogen adsorption studies shows the samples are mesoporous in nature with pore diameter of 5 - 10 nm.
The catalytic efficiencies of these materials of having various compositions have been tested in a series of
temperature programmed oxidation reactions involving carbon monoxide and the results discussed.
Keywords: Catalysis, Ferrospinels, Mesoporous, Atmospheric Pollution, Carbon Monoxide Oxidation
1. Introduction
Protection of the environment and prevention of atmos-
pheric pollution from gaseous pollutants continues to be
a challenging task for chemists. The present study is
aimed at providing measures to ensure protection of the
atmosphere from automobile exhaust pollution due to
carbon monoxide, using some ferrospinel preparations as
green catalysts for oxidative purification. These catalysts
are ferrite spinels containing varying proportions of Ni,
Co and Cu which have been synthesized by room tem-
perature co-precipitation [1] and characterized before use.
The catalytic efficiencies of these materials have been
tested at various temperatures for the oxidative removal
of carbon monoxide (CO), from automobile exhaust
gases, which constitute the major polluting factor in at-
mospheric pollution. The catalyst materials prepared
have been characterized by methods like BET-BJH, TG,
XRD, Ammonia TPD etc. The fact that these catalyst
materials are cheaper compared to the platinum group
metals being used in a big way in the field make the pre-
sent study quite significant.
Spinel ferrites containing Ni, Co, and Cu have tech-
nological significance as catalysts due to their special
electronic and magnetic properties [2]. It has earlier been
observed that the presence of these metals in ferrite
spinel lattices strongly modify their stability and redox
properties [3].
2. Experimental
2.1. Synthesis of the Spinel Catalysts
Three samples of simple spinel ferrites, AFe2O4 (A = Ni,
Co & Cu) and three samples of mixed ternary spinel fer-
rites, NixCoyCuzFe2O4 (x = 0.6; y = z, y = 0.6; x = z, z =
0.6; x = y, where x + y + z = 1) have been prepared.
Metal hydroxides were co precipitated from an aqueous
homogenous mixture containing 0.17 moles of ferric
nitrate and its half the moles of Cu/Ni/Co nitrate mix-
tures depends on the sample composition. The precipi-
tating alkali, aqueous NaOH of 5.3 M, was added drop
wise from a micro burette with continuous stirring to a
final pH of 10. These precipitates were aged for 12 hrs,
filtered, washed off nitrates and alkali and dried at 110˚C
for 10 hrs. These powders were calcined at 300˚C for 4
hrs in air muffle to allow spinel phase formation. The
mixed ternary ferrites are given the code “xyz” where
xyz refer to the mole ratio x:y:z in the formula, NixCoy-
CuzFe2O4. All the samples were calcined at 500˚C also
separately for specific use.
2.2. Characterization of Samples
The samples of ferrospinels have been characterized by
different physico-chemical methods like XRD, BET sur-
face area, Ammonia-Temperature Programmed Desorp-
125
C. U. ANIZ ET AL.
tion (TPD), ICP-AES, TG/DTG, etc. The results of the
BET surface area and ammonia-TPD data are given in
Tables 1 and 2 respectively. TPD studies were done us-
ing Pulse Chemisorb 2705 from Micromeritics. Samples
were degassed in helium in a quartz reactor, at 200˚C,
and then cooled to ambient temperature. 5% NH3 in he-
lium gas (from Bheruka gases, Bangalore) is admitted to
the sample for 15 min to saturate the sample. Physi-
sorbed ammonia was purged away, keeping the sample at
100˚C. Sample temperature was raised to 700˚C at a rate
of 10˚C/min measuring the outlet desorbed ammonia
using a calibrated TCD.
Nitrogen adsorption-desorption measurements were
done on a volumetric Micromeritics Tristar apparatus at
Liquid N2 temperature, 77.35 K. On an average 33
points were taken for each sample. The average mass of
the sample was 0.3 g. Pore size distributions were calcu-
lated using BJH method and surface areas were taken
from BET isotherms.
The temperature-programmed reduction studies (TPR)
were performed in Micromeritics PulseChemisorb-2705,
which incorporates a thermal conductivity detector
(TCD). Samples were activated/surface-cleaned in he-
lium at 200˚C for 30 minutes, then cooled to ambient
temperatures. The reactive gas composition was 10%
balance N2, its consumption was measured while heating
the sample up to 750˚C at a rate of 10˚C/min.
2.3. Kinetic and Catalytic Studies
Kinetic and catalytic reaction studies of carbon monox-
ide oxidation have been done with all the catalyst sam-
ples, granulated to 16 × 20 mesh sizes after shaping to
cylindrical tablets. 0.5 g of the activated catalyst samples
were supported between glass wool plugs and flanked by
inert porcelain beads in the middle of a specially de-
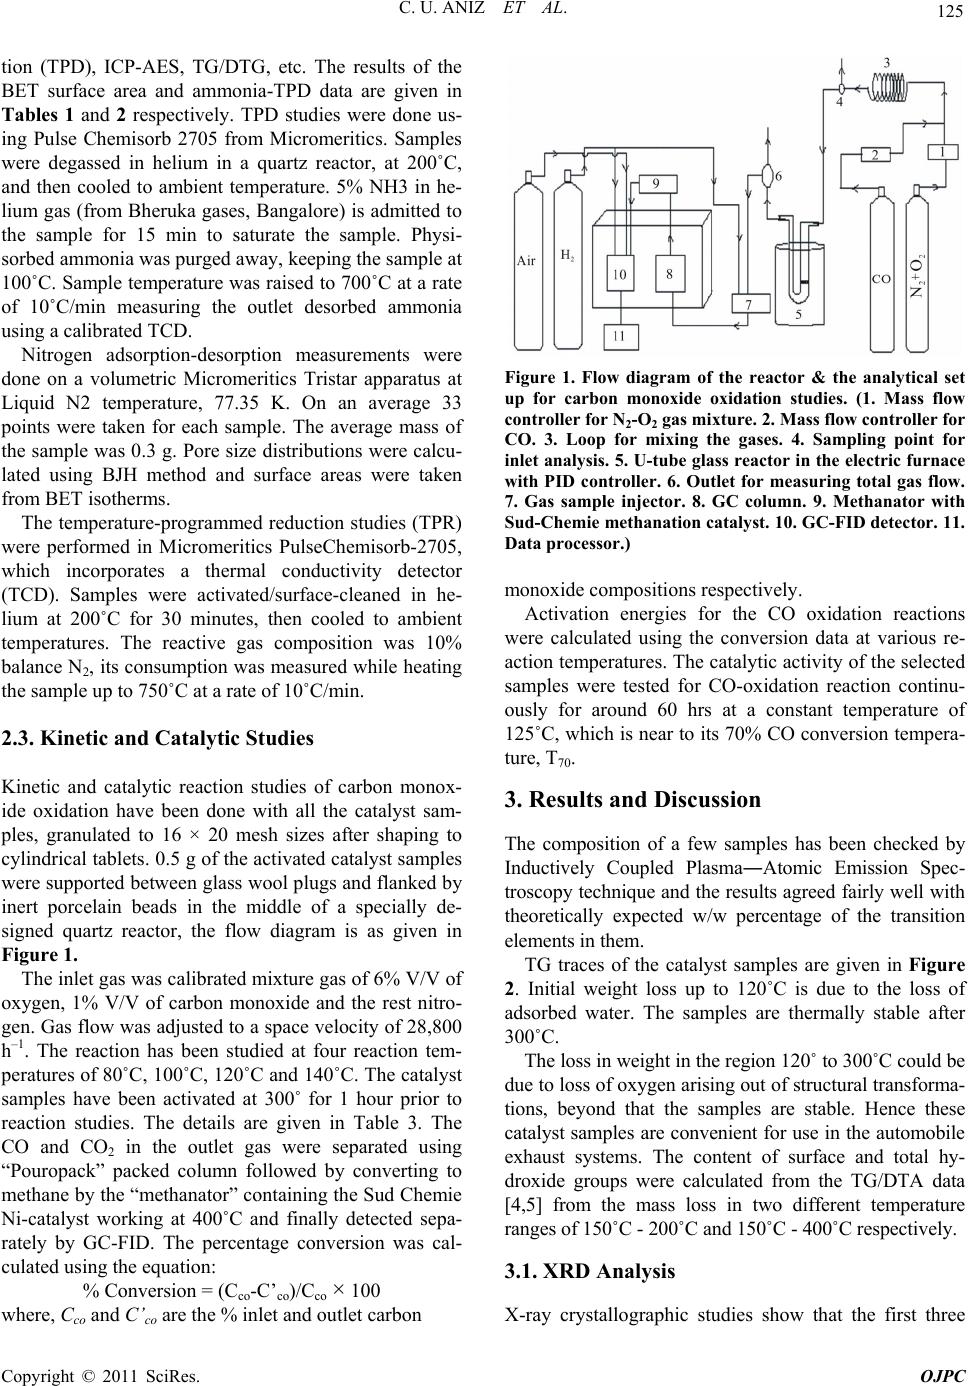
signed quartz reactor, the flow diagram is as given in
Figure 1.
The inlet gas was calibrated mixture gas of 6% V/V of
oxygen, 1% V/V of carbon monoxide and the rest nitro-
gen. Gas flow was adjusted to a space velocity of 28,800
h–1. The reaction has been studied at four reaction tem-
peratures of 80˚C, 100˚C, 120˚C and 140˚C. The catalyst
samples have been activated at 300˚ for 1 hour prior to
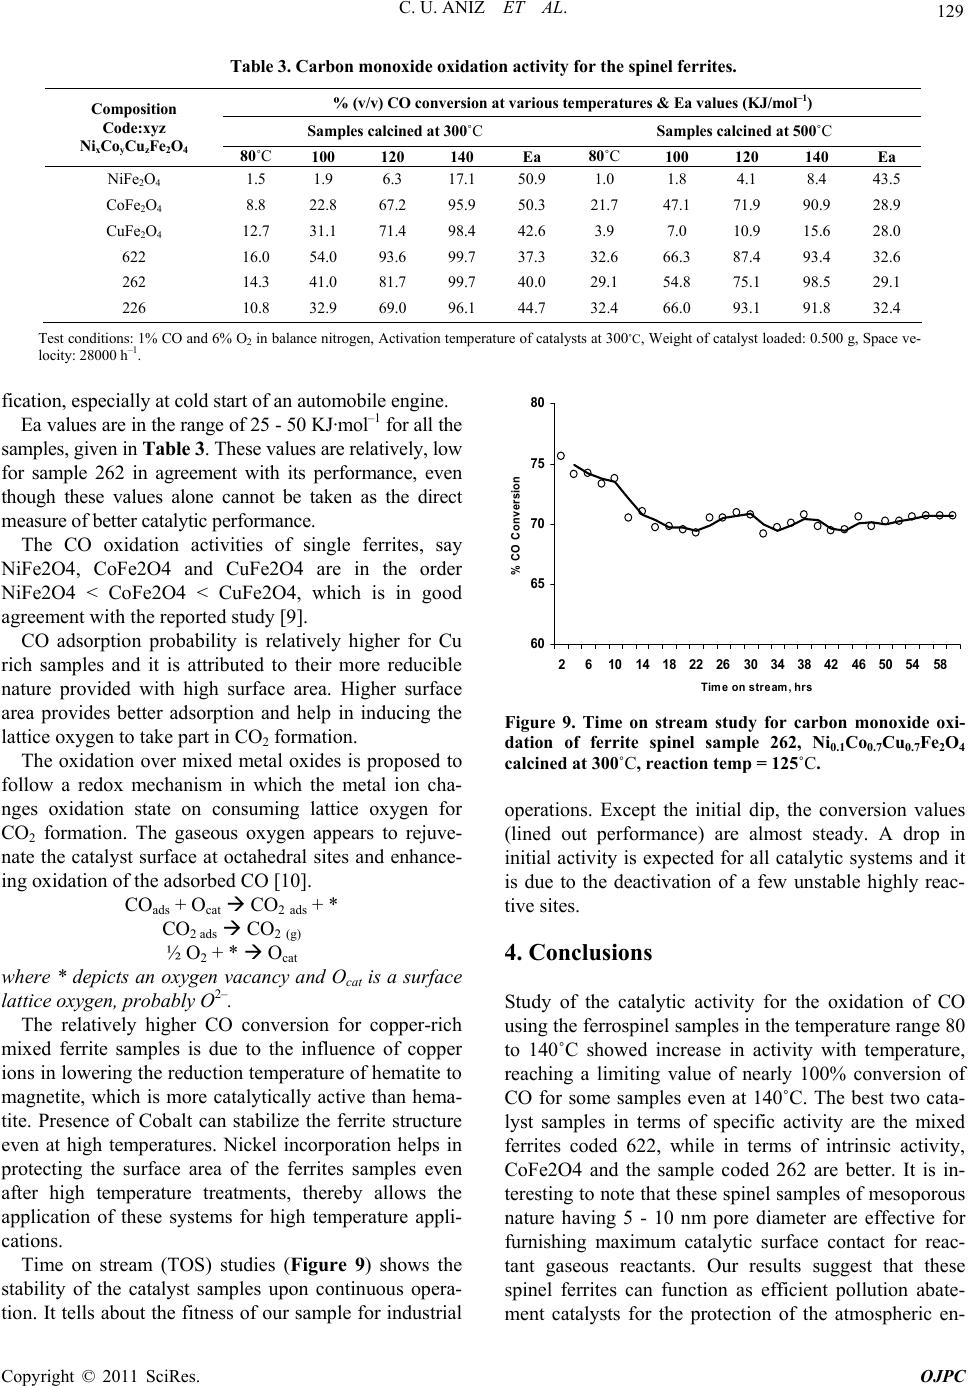
reaction studies. The details are given in Table 3. The
CO and CO2 in the outlet gas were separated using
“Pouropack” packed column followed by converting to
methane by the “methanator” containing the Sud Chemie
Ni-catalyst working at 400˚C and finally detected sepa-
rately by GC-FID. The percentage conversion was cal-
culated using the equation:
% Conversion = (Cco-C’co)/Cco × 100
where, Cco and C’co are the % inlet and outlet carbon
Figure 1. Flow diagram of the reactor & the analytical set
up for carbon monoxide oxidation studies. (1. Mass flow
controller for N2-O2 gas mixture. 2. Mass flow controller for
CO. 3. Loop for mixing the gases. 4. Sampling point for
inlet analysis. 5. U-tube glass reactor in the electric furnace
with PID controller. 6. Outlet for measuring total gas flow.
7. Gas sample injector. 8. GC column. 9. Methanator with
Sud-Chemie methanation catalyst. 10. GC-FID detector. 11.
Data processor.)
monoxide compositions respectively.
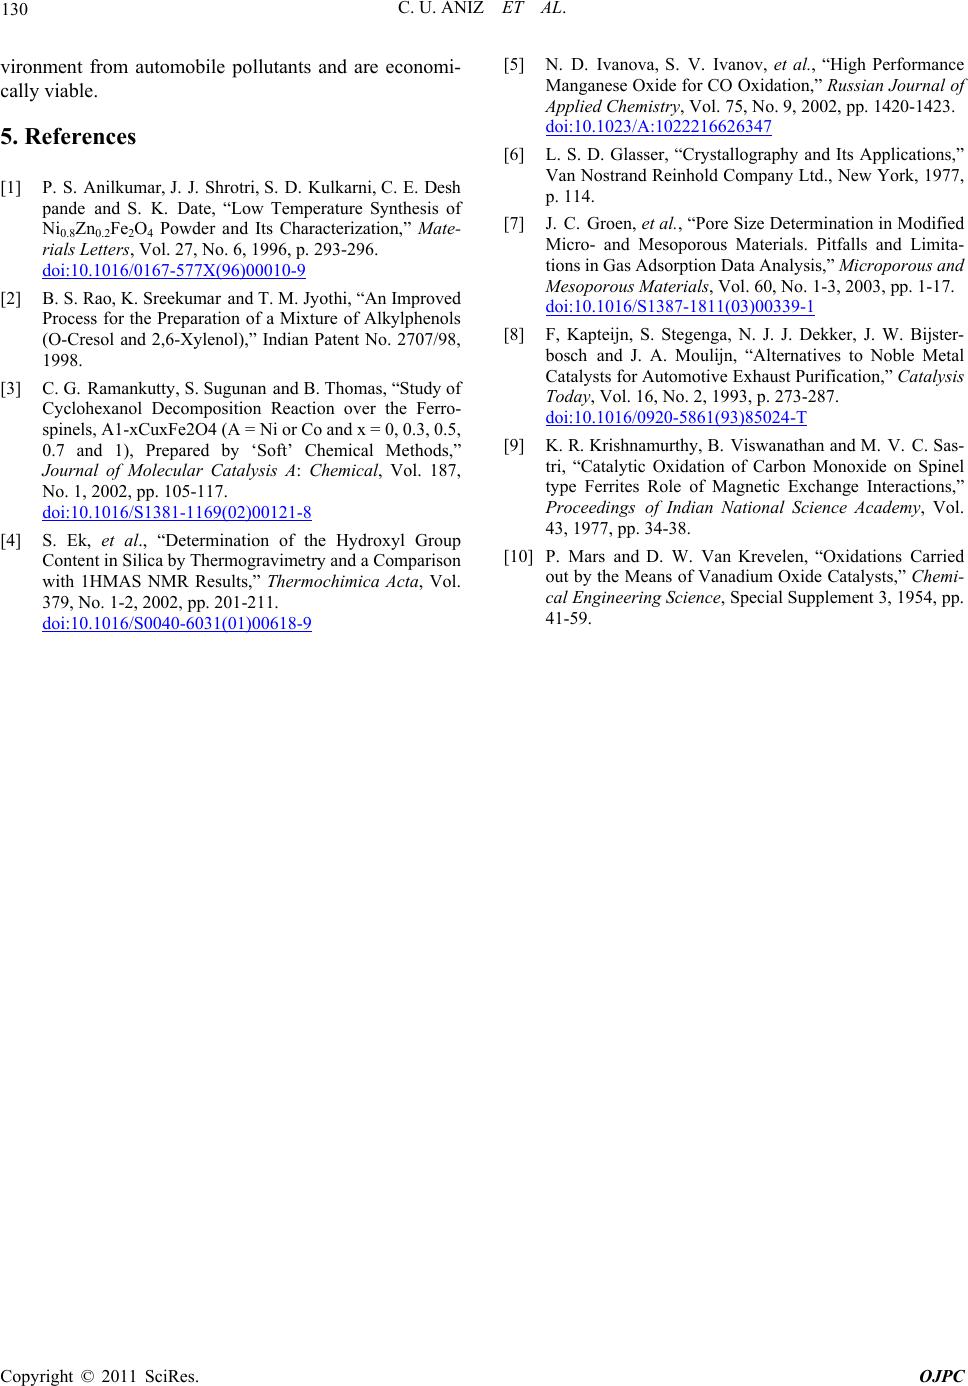
Activation energies for the CO oxidation reactions
were calculated using the conversion data at various re-
action temperatures. The catalytic activity of the selected
samples were tested for CO-oxidation reaction continu-
ously for around 60 hrs at a constant temperature of
125˚C, which is near to its 70% CO conversion tempera-
ture, T70.
3. Results and Discussion
The composition of a few samples has been checked by
Inductively Coupled PlasmaAtomic Emission Spec-
troscopy technique and the results agreed fairly well with
theoretically expected w/w percentage of the transition
elements in them.
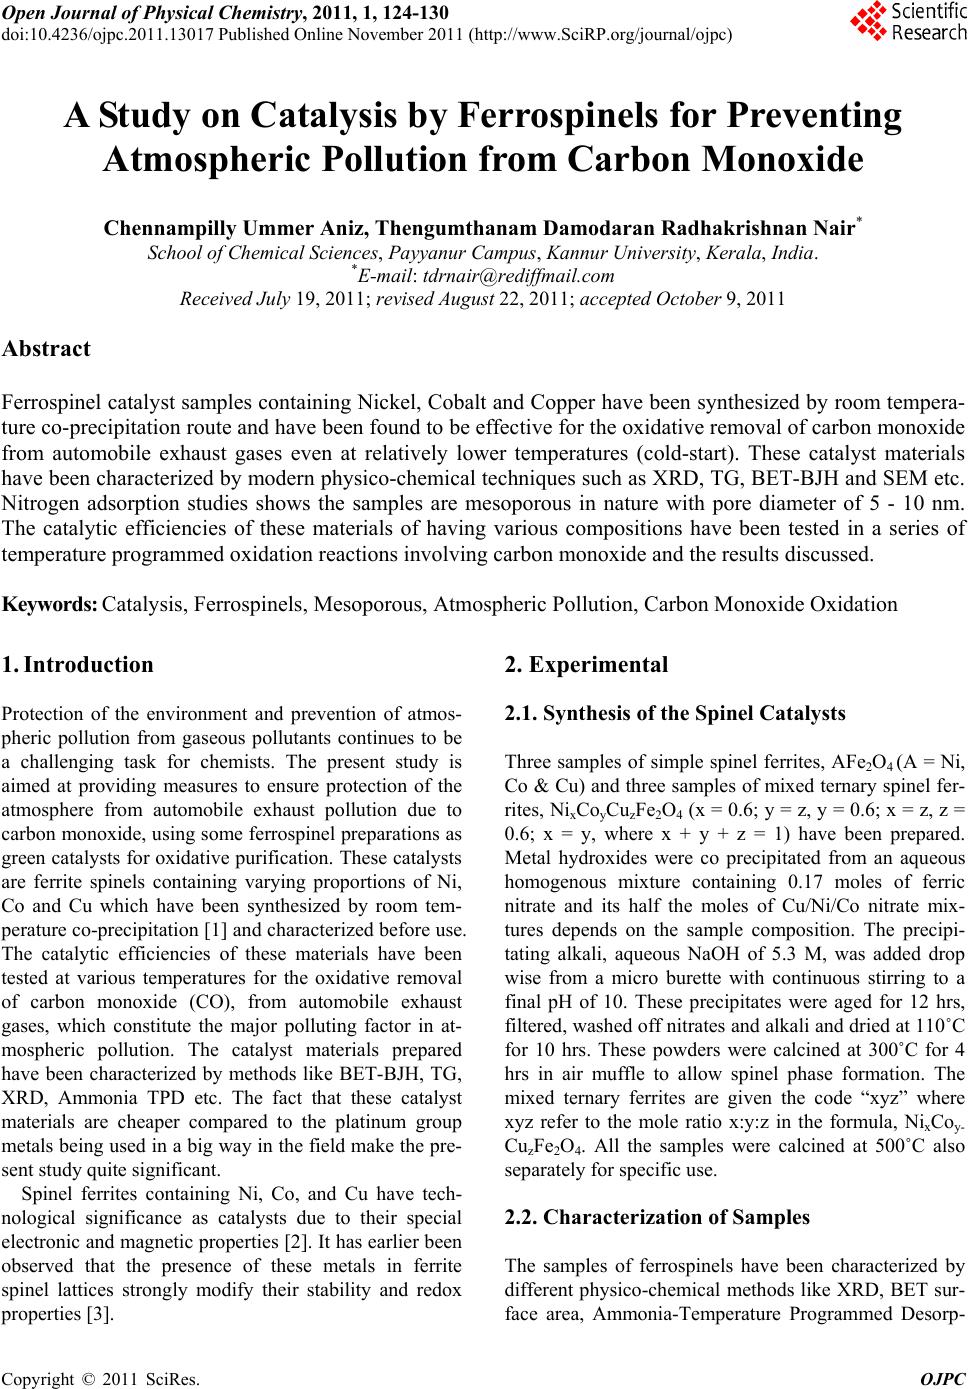
TG traces of the catalyst samples are given in Figure
2. Initial weight loss up to 120˚C is due to the loss of
adsorbed water. The samples are thermally stable after
300˚C.
The loss in weight in the region 120˚ to 300˚C could be
due to loss of oxygen arising out of structural transforma-
tions, beyond that the samples are stable. Hence these
catalyst samples are convenient for use in the automobile
exhaust systems. The content of surface and total hy-
droxide groups were calculated from the TG/DTA data
[4,5] from the mass loss in two different temperature
ranges of 150˚C - 200˚C and 150˚C - 400˚C respectively.
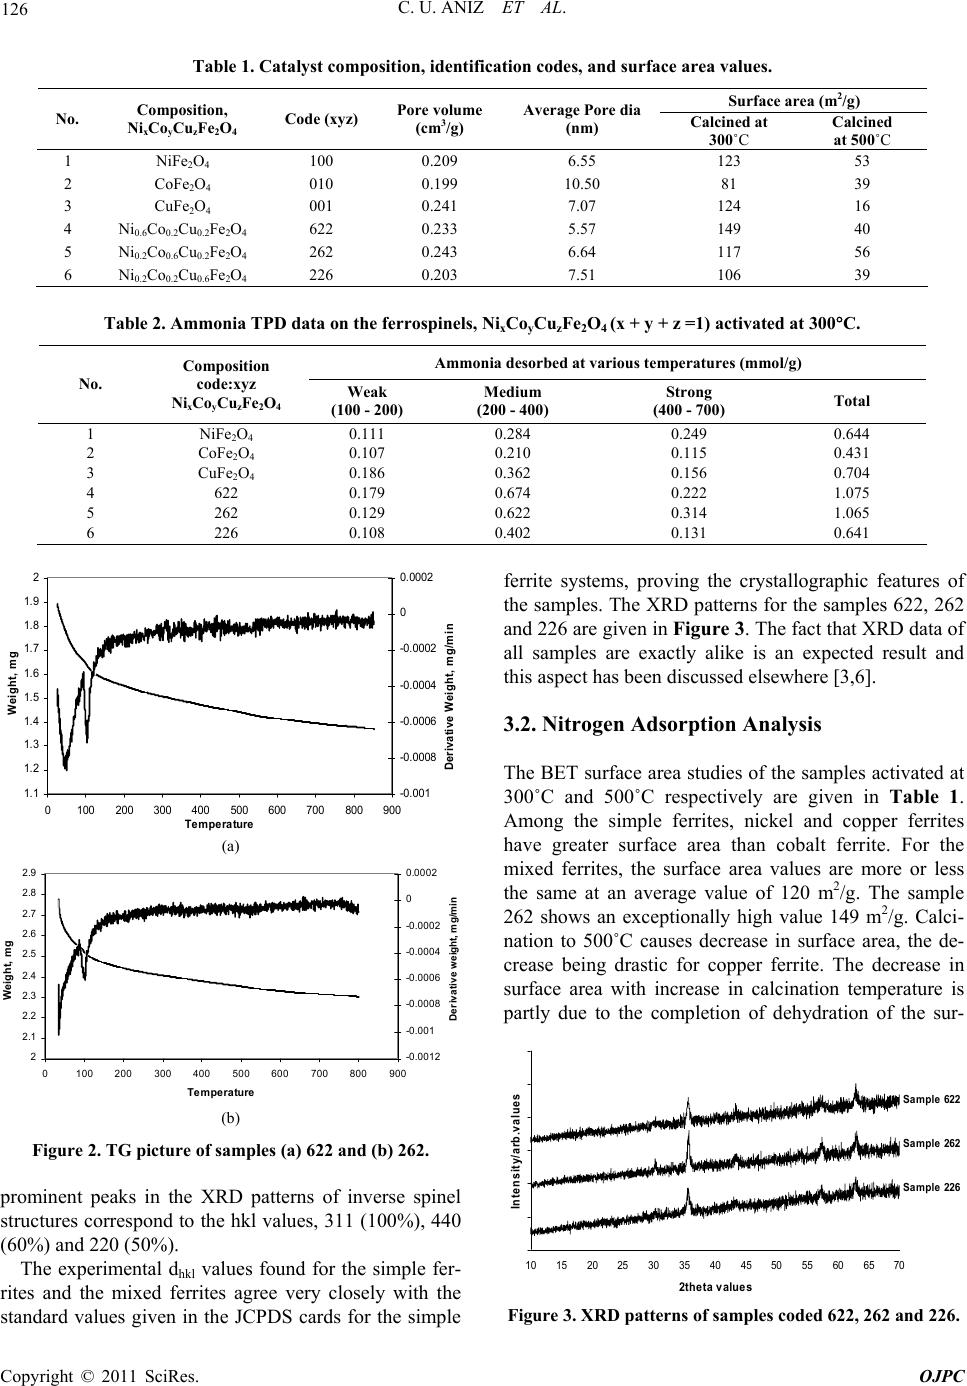
3.1. XRD Analysis
X-ray crystallographic studies show that the first three
Copyright © 2011 SciRes. OJPC
C. U. ANIZ ET AL.
Copyright © 2011 SciRes. OJPC
126
Table 1. Catalyst composition, identification codes, and surface area values.
Surface area (m2/g)
No. Composition,
NixCoyCuzFe2O4 Code (xyz) Pore volume
(cm3/g)
Average Pore dia
(nm) Calcined at
300˚C
Calcined
at 500˚C
1 NiFe2O4 100 0.209 6.55 123 53
2 CoFe2O4 010 0.199 10.50 81 39
3 CuFe2O4 001 0.241 7.07 124 16
4 Ni0.6Co0.2Cu0.2Fe2O4 622 0.233 5.57 149 40
5 Ni0.2Co0.6Cu0.2Fe2O4 262 0.243 6.64 117 56
6 Ni0.2Co0.2Cu0.6Fe2O4 226 0.203 7.51 106 39
Table 2. Ammonia TPD data on the ferrospinels, NixCoyCuzFe2O4 (x + y + z =1) activated at 300C.
Ammonia desorbed at various temperatures (mmol/g)
No.
Composition
code:xyz
NixCoyCuzFe2O4 Weak
(100 - 200)
Medium
(200 - 400)
Strong
(400 - 700) Total
1 NiFe2O4 0.111 0.284 0.249 0.644
2 CoFe2O4 0.107 0.210 0.115 0.431
3 CuFe2O4 0.186 0.362 0.156 0.704
4 622 0.179 0.674 0.222 1.075
5 262 0.129 0.622 0.314 1.065
6 226 0.108 0.402 0.131 0.641
1.1
1.2
1.3
1.4
1.5
1.6
1.7
1.8
1.9
2
0100200 300 400500 600 700800 900
Tem perature
Weight, mg
-0. 00 1
-0. 00 08
-0. 00 06
-0. 00 04
-0. 00 02
0
0.0002
Derivative Weight, mg/min
(a)
2
2.1
2.2
2.3
2.4
2.5
2.6
2.7
2.8
2.9
0100 200300 400500 600700 800900
Temperature
Weight, mg
-0.0012
-0.001
-0.0008
-0.0006
-0.0004
-0.0002
0
0.0002
Derivative weight, mg/min
(b)
Figure 2. TG picture of samples (a) 622 and (b) 262.
prominent peaks in the XRD patterns of inverse spinel
structures correspond to the hkl values, 311 (100%), 440
(60%) and 220 (50%).
The experimental dhkl values found for the simple fer-
rites and the mixed ferrites agree very closely with the
standard values given in the JCPDS cards for the simple
ferrite systems, proving the crystallographic features of
the samples. The XRD patterns for the samples 622, 262
and 226 are given in Figure 3. The fact that XRD data of
all samples are exactly alike is an expected result and
this aspect has been discussed elsewhere [3,6].
3.2. Nitrogen Adsorption Analysis
The BET surface area studies of the samples activated at
300˚C and 500˚C respectively are given in Table 1.
Among the simple ferrites, nickel and copper ferrites
have greater surface area than cobalt ferrite. For the
mixed ferrites, the surface area values are more or less
the same at an average value of 120 m2/g. The sample
262 shows an exceptionally high value 149 m2/g. Calci-
nation to 500˚C causes decrease in surface area, the de-
crease being drastic for copper ferrite. The decrease in
surface area with increase in calcination temperature is
partly due to the completion of dehydration of the sur-
0
000
000
000
000
000
000
10 15 202530 35 40 455055 60 6570
2theta values
In t e n s it y /a rb .values
Sam ple 622
Sam ple 262
Sam ple 226
Figure 3. XRD patterns of samples coded 622, 262 and 226.
127
C. U. ANIZ ET AL.
face hydroxyl groups, concomitant with the completion
of crystallization and growth of crystallite size, and
partly due to sintering. Nickel ferrite is retaining the rela-
tively higher surface area with increase of calcination
temperature and this property of nickel is expected to
support for the higher specific catalytic activity for the
resultant mixed ferrites at the higher temperatures.
Among the mixed ferrites, the better surface area values
of high copper composition samples even after 500˚C
calcination shows the support of nickel and cobalt on
retaining the surface area. The high relative surface area
of all the samples depends on the preparative methods
and high surface area accounts for the increased catalytic
activity for the oxidation
Selected representative isotherms have been plotted in
Figure 4, the corresponding Barret-Joyner-Halenda (BJ-
H) pore size distributions were calculated as applied to
the adsorption branches. All the samples exhibit nitrogen
adsorption/desorption isotherms of the Type IV, showing
a well-defined step and hysteresis loop. The P/Po posi-
tion of reflection points clearly shows that the pore di-
ameter is in the mesopore range, while the broad hys-
teresis loop reflects some mesopores are disorder in
shape. The initial part of the Type IV isotherm is attrib-
uted to monolayer-multilayer adsorption since it follows
the same path as the corresponding part of a Type II iso-
therm obtained with the given adsorptive on the same
surface area of the adsorbent in a non-porous form. The
average pore diameter is estimated to be mainly in a
range of 5.0 - 10.0 nm, while a very negligible portion is
also found at relatively larger dimensions. The hystereses
appear in the multilayer range of physisorption isotherms
and the two branches are nearly parallel over an appre-
ciable range of gas uptake which confirms the H1 type of
mesoporous materials. These studies were useful in iden-
tifying the nature of the pore structure of the catalysts [7].
The Type H1 loop is often associated with aggregates of
nano particles or compacts of uniform spheres in fairly
0
100
200
300
400
500
600
700
00.20.4 0.6 0.811.2
Rela tive pressure,p/po
Quan tiy o f N2 ad so r p be d, cm3/g , ST P
1OO
O1 O
OO1
622
262
226
Figure 4. N2-adsorption isotherms (type IV) of spinel ferrite
samplesBJH adsorption method.
regular array for the obtained samples, since it shows big
hysteresis loops at relative pressure between 0.6 and 0.8,
a capillary condensation in nano pores originated from
secondary inter-nano particle voids. These observations
are in line with the observations from SEM images
(Figure 5).
3.3. Temperature Programmed Reduction
Analysis
In the hydrogen TPR (Figure 6), the first peak charac-
terizes the reduction of +2 valence metal oxides,
Ni/Co/Cu, along with the reduction of ferric iron to fer-
rous stage, hematite to magnetite. The second separated
peak probably corresponds to the start of Fe3+ to Fe2+
reduction, and the third separated peak stands for the
reduction to metallic Iron. In the case of NiFe2O4, hema-
tite to magnetite peak is observed at 380˚C, where as in
CuFe2O4, it is at around 210˚C. In case of CoFe2O4, it is
further shifted to around 520˚C, and it might only in-
clude the reduction of Co2+ to Co+, while the reduction to
metallic Co took place at further extreme conditions. It
should also be noted that these Cu2+ ions may probably
play a significant role in promoting the reduction, even
without forming an extended separate metallic copper
phase. For the mixed spinel samples, corresponding re-
duction peaks of Ni/Co/Cu could be seen at respective
temperatures depends on their composition. It can be
assumed that addition of easily reducible metallic ele-
Figure 5. SEM photographs of samples 622, 262 and 226.
-2
0
2
4
6
8
10
12
14
16
18
0100 200300 400500600700 800
Tem pe ra ture, (
o
C)
TCD signal, (a.u)
sample 100
sample 010
sample 001
Figure 6. Temperature programmed reduction curves of
pure ferrites.
Copyright © 2011 SciRes. OJPC
C. U. ANIZ ET AL.
128
ments like Cu, may extend the Fe3+ Fe2+/3+ reduction
to a larger proportion, beyond the stoichiometric ratio.
Incorporation of structure stabilizers, like Co, may stabi-
lize iron in the ferric state in an even higher proportion,
exceeding the nominal 1:2 ratio. The temperature of the
Fe3+ to Fe3+/2+ is significantly shifted to lower tempera-
tures in the copper containing samples.
3.4. Carbon Monoxide Oxidation Studies
Data in Table 3 shows that copper ferrite among simple
ferrites, and sample with code 622 among mixed ferrites,
have the maximum specific activities for CO oxidation at
the reaction temperature of 120˚C. However, if the spe-
cific activities are divided by the surface area to get in-
trinsic activities, the maximum activity is for CoFe2O4
and the sample 262. Figure 7 shows the graphical repre-
sentation of CO oxidation performance.
In industrial catalysis, specific activity is more impor-
tant and, in this sense, sample 622 and copper ferrite are
the best catalysts. Intrinsic activity is important in theo-
retical correlation of activities with the chemical compo-
sition, concluding that the best two catalysts are cobalt
ferrite (at both activation temperatures) and sample 262,
having 70% of cobalt as the divalent cation. Figure 8
depicts the CO conversion observed for selected samples
after calcination at 500˚C. It is our observation that co-
balt ferrite, copper ferrite and mixed ferrites having high
percentage of cobalt are excellent catalysts practically in
accordance with theoretical requirements. This observa-
tion is in line with the surface area values of these sam-
ples too. Nickel ferrite and mixed ferrites with high pro-
portion of nickel have generally low activities, owing to
their lesser reducible nature irrespective of better surface
area values.
It is observed that the catalyst samples prepared and
employed have very high CO conversion abilities amo-
unting to almost 100% at as low a temperature as 140˚C
which has tremendous possibilities of application
0
20
40
60
80
100
120
80100120 140
Reaction temperature,oC
% CO con vesrio n
001
010
100
(a)
0
20
40
60
80
100
120
80100120 140
Reaction Temperature,oC
% CO con ver sio
n
262 226
622
(b)
Figure 7. Carbon monoxide oxidation activity evaluation of
ferrite spinel samples calcined at 300˚C (a) & (b).
0
10
20
30
40
50
60
70
80
90
100
80100120 140
Reaction Temperature,oC
% CO conversio
n
010
001
100
(a)
0
20
40
60
80
100
120
80100 120 140
Reaction Temperature,oC
% CO c o n versi o
n
622 262
226
(b)
Figure 8. Carbon monoxide oxidation activity evaluation of
ferrite spinel samples calcined at 500˚C (a) & (b).
in automobile exhaust purification processes. After the
cold start of an automobile engine, a very large fraction of
the total emission is left un-reacted [8]. Ordinary exhaust
catalysts start functioning only when the temperature rises
to about 200˚C. The usual noble metal catalysts require
higher reaction temperatures to catalyze CO or hydrocar-
bon oxidation. Hence the results of the present investiga-
tion have great relevance in automobile exhaust gas puri-
Copyright © 2011 SciRes. OJPC
C. U. ANIZ ET AL.
Copyright © 2011 SciRes. OJPC
129
Table 3. Carbon monoxide oxidation activity for the spinel ferrites.
% (v/v) CO conversion at various temperatures & Ea values (KJ/mol–1)
Samples calcined at 300˚C Samples calcined at 500˚C
Composition
Code:xyz
NixCoyCuzFe2O4 80˚C 100 120 140 Ea 80˚C 100 120 140 Ea
NiFe2O4 1.5 1.9 6.3 17.1 50.9 1.0 1.8 4.1 8.4 43.5
CoFe2O4 8.8 22.8 67.2 95.9 50.3 21.7 47.1 71.9 90.9 28.9
CuFe2O4 12.7 31.1 71.4 98.4 42.6 3.9 7.0 10.9 15.6 28.0
622 16.0 54.0 93.6 99.7 37.3 32.6 66.3 87.4 93.4 32.6
262 14.3 41.0 81.7 99.7 40.0 29.1 54.8 75.1 98.5 29.1
226 10.8 32.9 69.0 96.1 44.7 32.4 66.0 93.1 91.8 32.4
Test conditions: 1% CO and 6% O2 in balance nitrogen, Activation temperature of catalysts at 300˚C, Weight of catalyst loaded: 0.500 g, Space ve-
locity: 28000 h–1.
60
65
70
75
80
261014 18 22 2630 34 38 4246 50 5458
Time on stream, hrs
% CO Conversion
fication, especially at cold start of an automobile engine.
Ea values are in the range of 25 - 50 KJ·mol–1 for all the
samples, given in Table 3. These values are relatively, low
for sample 262 in agreement with its performance, even
though these values alone cannot be taken as the direct
measure of better catalytic performance.
The CO oxidation activities of single ferrites, say
NiFe2O4, CoFe2O4 and CuFe2O4 are in the order
NiFe2O4 < CoFe2O4 < CuFe2O4, which is in good
agreement with the reported study [9].
CO adsorption probability is relatively higher for Cu
rich samples and it is attributed to their more reducible
nature provided with high surface area. Higher surface
area provides better adsorption and help in inducing the
lattice oxygen to take part in CO2 formation. Figure 9. Time on stream study for carbon monoxide oxi-
dation of ferrite spinel sample 262, Ni0.1Co0.7Cu0.7Fe2O4
calcined at 300˚C, reaction temp = 125˚C.
The oxidation over mixed metal oxides is proposed to
follow a redox mechanism in which the metal ion cha-
nges oxidation state on consuming lattice oxygen for
CO2 formation. The gaseous oxygen appears to rejuve-
nate the catalyst surface at octahedral sites and enhance-
ing oxidation of the adsorbed CO [10].
operations. Except the initial dip, the conversion values
(lined out performance) are almost steady. A drop in
initial activity is expected for all catalytic systems and it
is due to the deactivation of a few unstable highly reac-
tive sites.
COads + Ocat CO2 ads + *
CO2 ads CO2 (g)
4. Conclusions
½ O2 + * Ocat
where * depicts an oxygen vacancy and Ocat is a surface
lattice oxygen, probably O2–. Study of the catalytic activity for the oxidation of CO
using the ferrospinel samples in the temperature range 80
to 140˚C showed increase in activity with temperature,
reaching a limiting value of nearly 100% conversion of
CO for some samples even at 140˚C. The best two cata-
lyst samples in terms of specific activity are the mixed
ferrites coded 622, while in terms of intrinsic activity,
CoFe2O4 and the sample coded 262 are better. It is in-
teresting to note that these spinel samples of mesoporous
nature having 5 - 10 nm pore diameter are effective for
furnishing maximum catalytic surface contact for reac-
tant gaseous reactants. Our results suggest that these
spinel ferrites can function as efficient pollution abate-
ment catalysts for the protection of the atmospheric en-
The relatively higher CO conversion for copper-rich
mixed ferrite samples is due to the influence of copper
ions in lowering the reduction temperature of hematite to
magnetite, which is more catalytically active than hema-
tite. Presence of Cobalt can stabilize the ferrite structure
even at high temperatures. Nickel incorporation helps in
protecting the surface area of the ferrites samples even
after high temperature treatments, thereby allows the
application of these systems for high temperature appli-
cations.
Time on stream (TOS) studies (Figure 9) shows the
stability of the catalyst samples upon continuous opera-
tion. It tells about the fitness of our sample for industrial
C. U. ANIZ ET AL.
130
vironment from automobile pollutants and are economi-
cally viable.
5. References
[1] P. S. Anilkumar, J. J. Shrotri, S. D. Kulkarni, C. E. Desh
pande and S. K. Date, “Low Temperature Synthesis of
Ni0.8Zn0.2Fe2O4 Powder and Its Characterization,” Mate-
rials Letters, Vol. 27, No. 6, 1996, p. 293-296.
doi:10.1016/0167-577X(96)00010-9
[2] B. S. Rao, K. Sreekumar and T. M. Jyothi, “An Improved
Process for the Preparation of a Mixture of Alkylphenols
(O-Cresol and 2,6-Xylenol),” Indian Patent No. 2707/98,
1998.
[3] C. G. Ramankutty, S. Sugunan and B. Thomas, “Study of
Cyclohexanol Decomposition Reaction over the Ferro-
spinels, A1-xCuxFe2O4 (A = Ni or Co and x = 0, 0.3, 0.5,
0.7 and 1), Prepared by ‘Soft’ Chemical Methods,”
Journal of Molecular Catalysis A: Chemical, Vol. 187,
No. 1, 2002, pp. 105-117.
doi:10.1016/S1381-1169(02)00121-8
[4] S. Ek, et al., “Determination of the Hydroxyl Group
Content in Silica by Thermogravimetry and a Comparison
with 1HMAS NMR Results,” Thermochimica Acta, Vol.
379, No. 1-2, 2002, pp. 201-211.
doi:10.1016/S0040-6031(01)00618-9
[5] N. D. Ivanova, S. V. Ivanov, et al., “High Performance
Manganese Oxide for CO Oxidation,” Russian Journal of
Applied Chemistry, Vol. 75, No. 9, 2002, pp. 1420-1423.
doi:10.1023/A:1022216626347
[6] L. S. D. Glasser, “Crystallography and Its Applications,”
Van Nostrand Reinhold Company Ltd., New York, 1977,
p. 114.
[7] J. C. Groen, et al., “Pore Size Determination in Modified
Micro- and Mesoporous Materials. Pitfalls and Limita-
tions in Gas Adsorption Data Analysis,” Microporous and
Mesoporous Materials, Vol. 60, No. 1-3, 2003, pp. 1-17.
doi:10.1016/S1387-1811(03)00339-1
[8] F, Kapteijn, S. Stegenga, N. J. J. Dekker, J. W. Bijster-
bosch and J. A. Moulijn, “Alternatives to Noble Metal
Catalysts for Automotive Exhaust Purification,” Catalysis
Today, Vol. 16, No. 2, 1993, p. 273-287.
doi:10.1016/0920-5861(93)85024-T
[9] K. R. Krishnamurthy, B. Viswanathan and M. V. C. Sas-
tri, “Catalytic Oxidation of Carbon Monoxide on Spinel
type Ferrites Role of Magnetic Exchange Interactions,”
Proceedings of Indian National Science Academy, Vol.
43, 1977, pp. 34-38.
[10] P. Mars and D. W. Van Krevelen, “Oxidations Carried
out by the Means of Vanadium Oxide Catalysts,” Chemi-
cal Engineering Science, Special Supplement 3, 1954, pp.
41-59.
Copyright © 2011 SciRes. OJPC