 Open Journal of Physical Chemistry, 2011, 1, 109-117 doi:10.4236/ojpc.2011.13015 Published Online November 2011 (http://www.SciRP.org/journal/ojpc) Copyright © 2011 SciRes. OJPC 109 Adsorptio n of CO2 and H2 on Cu and Zn Micro-Cluster Surfaces Studied by Quantum Chemistry and Theory of Absolute Reaction Rates Shin’ichiro Okude1, Hiroaki Kuze2* 1Yokohama-Totsuka Research Institute of Science and Technology, Mie Laboratory, Mie, Japan. 2Center for Environmental Remote Sensing, Chiba, Japan. *E-mail: YRX02226@nifty.com Received August 9, 2011; revised September 10, 2011; accepted October 11, 2011 Abstract Statistical mechanics and semi-empirical molecular orbital theory (PM6) are used to calculate the surface coverage of CO2 and H2 molecular species chemically adsorbed on the surface of Cu and Zn micro clusters. The calculation shows that CO2 is adsorbed well both on the surface of Cu and Zn micro clusters. Although H2 is adsorbed well on the surface of Zn micro clusters, H2 absorption on the surface of Cu micro clusters is much more limited in the pressure range of 20 - 100 atm and temperature range of 200 - 1000 K. Reaction rates are also estimated for some chemical adsorption process of H2 gas using theory of absolute reaction rates. It is found that the values of the reaction rate calculated in the present paper agree reasonably well with the experimental values. Keywords: Surface Reaction, CO2, Hydrogen, Global Warming, Catalyst 1. Introduction In view of the social awareness of the global climate change supposedly due to anthropogenic carbon dioxide (CO2) emissions [1], Sustainability Science Consortium was established in August 2010 in Japan for the purpose of better cooperation among various fields such as phys- ics, chemistry, engineering, biology, economics, politics, quality control etc. Since the reduction of fossil fuel bur- ning is becoming an urgent issue, various types of alter- native, renewable energy resources have been proposed, such as solar energy, biomass, wind power, wave power, etc [2]. Among others, Research Institute of Innovative Technology for Earth proposed a “Global CO2 Recycle System”, in which a solar power station in a desert will generate electric power, and hydrogen gas will be pro- duced using this electric power. Carbon dioxide gas re- cycled from industrialized countries will be carried to the desert by using, for example, a liquefied CO2 gas tanker. The chemical reaction of CO2 gas with hydrogen gas will be used to form methanol. The methanol will be con- veyed return back to industrialized countries using a me- thanol tanker, and will be used as fuel [3-5]. Namura shipbuilding Co. Ltd. has already constructed a methanol tanker which is now used practically in industry. In Mo- jave Desert in California in U.S.A., Solar Energy Gener- ating Systems is in operation and electric power is pro- duced therein. Methanol can be formed through the inhomogeneous chemical reaction of CO2 gas with H2 gas catalyzed by the surface of Cu and Zn alloy, as studied by ab initio qu- antum chemistry [6] and by experiments [3,4,7]. The purpose of the present paper is to describe our calcula- tion results on the surface coverage of CO2 and H2 mole- cular species chemically adsorbed on the surface of Cu and Zn micro clusters. It is well known that ab initio qu- antum chemical calculations give quantitative value of molecular parameters such as chemical bonding energies, frequencies of molecular normal vibrations, and active- tion energies of chemical reactions. In general, chemical reaction rate, K, is given by K A exp(-EaR0T), (1) where Ea is the activation energy, T is the temperature, R0 is the gas constant, and A is a constant called frequ- ency factor. Quantum chemical calculation gives the val- ue of Ea. The theory of absolute reaction rates [8], which is based on the statistical mechanics, can be employed to derive a mathematical formula for the frequency factor, A.  S. OKUDE ET AL. 110 Generally, a catalytic surface has surface sites, on each of which a single gaseous molecule can adsorb. In the present paper, we use the approach of quantum chemical calculation to obtain quantitative values of molecular constants of chemical species on surface sites. Statistical mechanical technique [9] gives a mathematical formula which describes surface coverage, (total number of ad- sorbed moleculestotal number of surface sites), as a function of the temperature T and the gas pressure p. In the present paper, we calculate quantitative value of by cou- pling the quantum chemical values of molecular con- stants with the mathematical formula of statistical dyna- mics. Theory of absolute reaction rates [8] was used to model inhomogeneous surface reactions more than 20 years ago [10]. The numerical accuracy of the calculations, however, was not very high, because of the limited performance of computers. In addition, quantum chemical calculation of molecular parameters was very difficult when complex chemical systems or heavy metal elements were involved in inhomogeneous surface reactions. Accurate molecular parameters are indispensable for making quantitative cal- culations of statistical mechanics. Today, remarkably improved computer performance has made it possible to carry out quantum chemical cal- culations of considerably large chemical systems. Ab in- itio quantum chemical calculations can possibly give re- liable molecular parameters if sufficient resources are av- ailable. Semi empirical quantum chemical calculations, on the other hand, are simplified and approximate cal- culations. They can be implemented using ordinary per- sonal computers, giving reasonably accurate molecular parameters. Until recently, however, only light elements have been covered, with little coverage of heavy metal elements. In 2007, PM6 was introduced as a platform for semi empirical molecular orbital calculation [11-13] and is now commercially available (Ryoka system Inc.). Computer program named WinMostar (Tencube Co.) can be suitably used to visualize the result of the calculation given by PM6, showing molecular structures on personal computers. PM6 solves the Schrödinger equation that incorporates an approximate, semi-empirical Hamilto- nian, simplified by introducing fitting parameters. More than 9000 experimental data and numerical results of ab initio molecular orbital calculations have been used to optimize and to determine the parameters of PM6. As for previously developed semi-empirical molecular orbital theories, AM1 (developed in 1985) uses 200 data, and PM3 (developed in 1989) uses 500 data to determine the parameters in Hamiltonians. Both AM1 and PM3 have been used by chemists for more than 20 years. When compared with AM1 or PM3 methods, PM6 gives nu- merical values of formation/bonding energy of chemical compounds with higher accuracy and predicts sta- ble/semi-stable structures of chemical species with hi- gher accuracy. PM6 covers almost all of the elements in the periodic table including heavy metal elements such as Cu and Zn as well as light elements such as H, C, O, etc. The web sites of open MOPAC (http://openmopac. net /manual/ index_accuracy. html and http://openmopac. net/MOPAC2009brochure.pdf) show that the average un- signed error of heat of formation of PM6 is around 8 kcal/mol, and the accuracy of PM6 is as good as the ac- curacy of B3LYP 6-31G(d), a sophisticated code devel- oped for super-computer calculations. Empirical molecu- lar orbital theory such as extended Hückel calculation is used in material science for qualitative discussion [14]. In contrast, semi empirical molecular orbital theory gives much more accurate quantitative values of molecular pa- rameters. As PM6 covers open shell calculations, reac- tion intermediates or radicals can also be treated using the same framework. PM6 has already been used for the study of molecular properties such as polycyclic aroma- tic hydrocarbons and fullerenes [15], molecular orbital study of the interaction between MgATP and the myosin motor domain [16], and frontier orbital theory study of some aminopyrimidine derivatives and their interaction with an iron surface [17]. In the present paper, PM6 molecular orbital calcula- tion, the theory of absolute reaction rates, as well as the technique of statistical mechanics are used systematically to simulate CO2 and H2 adsorption on the surface of Cu and Zn micro clusters. As the result, surface coverage of these molecular species is calculated numerically as a function of the temperature and the gas pressure. In addi- tion, rough estimation of the reaction rate of gas phase H2 molecules with adsorbed CO2 chemical species is ma- de by using the theory of absolute reaction rates. The rate of chemical adsorption of hydrogen molecule on a Zn site in a CuZn catalyst is also estimated by using the the- ory of absolute reaction rates, and compared with expe- rimental data [4]. It is found that values of reaction rates calculated in the present paper agree with reasonable ac- curacy with experimental values. 2. Theory 2.1. CO2 Molecules Adsorbed on the Surface of a Cu9 Cluster We use a conventional statistical mechanical technique and simulate a system in which linear molecules are ad- sorbed on a surface of a “bulk” metal. Here the “bulk” metal treated in the present paper consists of several metal atoms, and the structure of the cluster is optimized using PM6 calculation. In this section, we treat a Cu9 Copyright © 2011 SciRes. OJPC  111 S. OKUDE ET AL. cluster and a CO2 molecule. This Cu9 cluster consists of 9 Cu atoms. We adopt a catalytic chemical reaction mo- del [6] wherein non-dissociative chemical adsorption of CO2 on Cu surface is assumed. In other words, we adopt a chemical structure in which each of the two O atoms of the adsorbing CO2 molecule is assumed to contact a Cu atom of the Cu9 cluster. The free energy of adsorbed CO2 molecule is given by [9], F(N) (kT) log[N0!(N!(N0 – N)!)] (kTN) log{GVexp[ (kT)]} (2) where N is the number of adsorbed CO2 molecules, k is the Boltzmann’s constant, T is the temperature of the system, N0 is the total number of the surface sites of the metal cluster, Cu9, and G is the spin parameter of the adsorbed molecule. In this case, the spin parameter G = G1 is given by G1 (2SC + 1)(2SO + 1) (2SO + 1). (3) Here suffix 1 specifies the particular case of CO2/Cu9, and SC is the nuclear spin of C atom, SC 0, (4) and SO is the nuclear spin of O atom, SO 0. (5) In Equation (2), V is the partition function for vibra- tion of a molecule (in this case, CO2) adsorbed on the metal cluster (Cu9 cluster). Thus, the partition function, V = V1, is given by V1 V Cu9 + CO2VCu9. (6) Here VCu9 ( Vmetal) is the partition function for vibra- tion of the Cu9 cluster given by Vmetal metal{1[exp(h i (2kT)) exp( h i(2kT))]}. (7) In Equation (7), i stands for the frequency of the i’th normal vibration of Cu9 cluster. In Equation (6), VCu9 + CO2 ( Vmetal + molecule) is the partition function for vibration of the CO2 + Cu9 (molecule + metal) cluster, Vmetal + molecule metal + molecule {1[exp( h i(2kT)) exp( h i(2kT))]}, (8) where i is the frequency of the i’th normal vibration of the CO2 + Cu9 (molecule + metal) cluster. In Equation (2), the heat of adsorption = 1 is given by CO2(gas) → CO2 (adsorbed) 1 . (9) The chemical potential of an adsorbed molecular spe- cies (CO2) is defined by (adsorbed) ( N) F(N). (10) By inserting Equation (2) into Equation (10) and using l’Hôpital’s rule, we obtain (adsorbed) (kT) log{G1V1 exp[ 1(kT)]} + (kT) log{N (N0-N)}. (11) The chemical potential of an isolated CO2 molecule, on the other hand, is given by [9] (gas) (kT) log{h3/[(2 π mkT)3/2(kT)]} (kT) log j (kT)log p , (12) where m is the mass of a CO2 molecule, and p is the pressure of the CO2 gas, and j is given by j 0.5 gnuc re(T) Vmolec_vibration(T) (13) where gnuc (2SC + 1)(2SO + 1) (2SO + 1) , (14) and re(T) is given by re(T) 82 I kTh2 , (15) where I is the moment of inertia of a CO2 molecule, and Vmolec_vibration(T) is given by Vmolec_vibration(T) i {1[exp(h i (2kT)) – exp( h i(2kT))]}, (16) where i is the frequency of the i’th normal vibration of a CO2 molecule. The values of i, I, and 1 are calculated using PM6 molecular orbital calculation. The condition of the thermal equilibrium between a CO2 gas molecule and an adsorbed CO2 molecule is given by (adsorbed) µ (gas). (17) By inserting Equations (11) and (12) into Equation (17), one obtains N(N0 – N) A p, (18) where A is given by A {h3[(2 mkT)3/2(kT)]}(j–1G1V1) exp [ 1(k T)] (19) Surface coverage. = CO2 is defined by N N0. (20) From Equations (18) and (20), the surface coverage is given by Ap(1 + Ap). (21) 2.2. H2 Molecules Adsorbed on the Surface of a Cu9 Cluster Next, we consider a system in which a H2 molecule is adsorbed on a Cu9 cluster. We assume a case in which the H2 molecule dissociates when adsorbed on the cluster surface. The free energy of an adsorbed system is given Copyright © 2011 SciRes. OJPC  S. OKUDE ET AL. 112 } by Equation (2), where N is the number of H atoms ad- sorbed on the surface, N0 is the total number of the sur- face sites of the Cu9 cluster, and G = G2 is given by G2 (2SH + 1), (22) where SH is the nuclear spin of H atom, SH 1/2, (23) and = 2 is the heat of adsorption: H(gas) → H(adsorbed) + 2 , (24) and V = V2 is given by V2 VCu9+H VCu9, (25) where VCu9 is the partition function for vibration of Cu9 cluster given by Equation (7). In Equation (25), VCu9+H is the partition function for vibration of H + Cu9 cluster written as Equation (8), with i indicating the frequency of the i’th normal vibration of H + Cu9 cluster. The chemical potential of an adsorbed H atom is de- fined by Equation (10). Thus we use Equation (11) to obtain the chemical potential of an adsorbed H atom, where G2, V2, and 2 are used instead of G1, V1, and 1, respectively. The chemical potential of an isolated H2 molecule is given by [9] (gas) (kT) log{(h3)[(2π mkT)3/2(kT)]} – (kT) log j + (kT) log(p) – 2 3, (26) where 3 is the heat of dissociation of the reaction H(gas) → (1/2)H2(gas) – 3. (27) In Equation (26), m is the mass of a H2 molecule, p is the pressure of the H2 gas, j is given by Equation (13), where gnuc (2SH + 1) (2SH + 1), (28) re(T) is given by Equation (15), where I indicates the moment of inertia of a H2 molecule, and Vmolec_vibration(T) 1/exp(/(2 ))exp(/(2 ))hn kThn kT{--, (29), where is the frequency of the vibration of a H2 mole- cule. The values of vi (the frequency of the i’th normal vibration of Cu9 cluster), I and 3 are calculated using PM6 molecular orbital calculation. The condition of the thermal equilibrium between H2 gas and the adsorbed H is given by 2 (adsoped) (gas). (30) By substituting Equation (11) (with G2, V2 and 2, re- spectively, instead of G1, V1 and 1) and Equation (26) into Equation (30), we obtain N(N0 – N) A·p0.5, (31) where, A {h1.5[(2 m kT)3/4(k T)0.5]} j–0.5 G2 V2 exp[ 2(kT)] exp[– 3 (kT)]. (32) Surface coverage is defined by, H2 N/N0. (33) From Equations (31) and (33), H2 is given by H2 Ap1/2(1 + Ap1/2). (34) A system in which a H2 molecule is adsorbed on a Zn7 cluster can be calculated in a similar way. 2.3. General Theory of Surface Reaction Rates When a surface reaction occurs between Cu9Zn and H2, for example, an activated complex is generally formed in a transition state. Figure 1 shows (a) the initial state, (b) the transition state and (c) the final state of the reaction Cu9Zn + H2 → Cu9ZnH2. (35) Here the chemical structure of an activated complex has been obtained from the PM6 calculation as follows. First we choose two atoms (Zn and H atoms, in the case of Figure 1); these two atoms, each being selected from the two molecules, interact with each other in the reac- tion process. The total energy of the compound is calcu- lated as a function of the distance between the two se- lected atoms. In other words, the distance between the two atoms is used as the reaction coordinate. When the total energy takes a maximum at a certain distance (0.22 nm, in the present example), the compound correspond- ing to this distance is regarded as the activated complex. Reaction rate of the total system can be calculated by using the theory of absolute reaction rates [8]. In this theory, the velocity, u, of the translational motion (ther- mal motion) of the activated complex along the reaction coordinate is given by u (kT 2m)1/2 . (36) The mean time, , in which an activated complex changes to the final reaction product is given by u, (37) where is the typical length of the transition state. Here we assume 0.10 nm. Let us consider a system in which powder of the cata- lytic material (powdered CuZn catalyst) is used. In an experiment [4] of methanol formation from H2 and CO2, the catalytic powder is formed in a shape of cylinder ( 3 mm H3 mm). We assume that the volume of a grain of the powder, Vgrain, is equal to 27 mm3 (0.003 0.003 0.003 m3) and the surface area of one grain of the pow- der, Sgrain, is equal to 54 mm2 (6 0.003 0.003 m2). Copyright © 2011 SciRes. OJPC 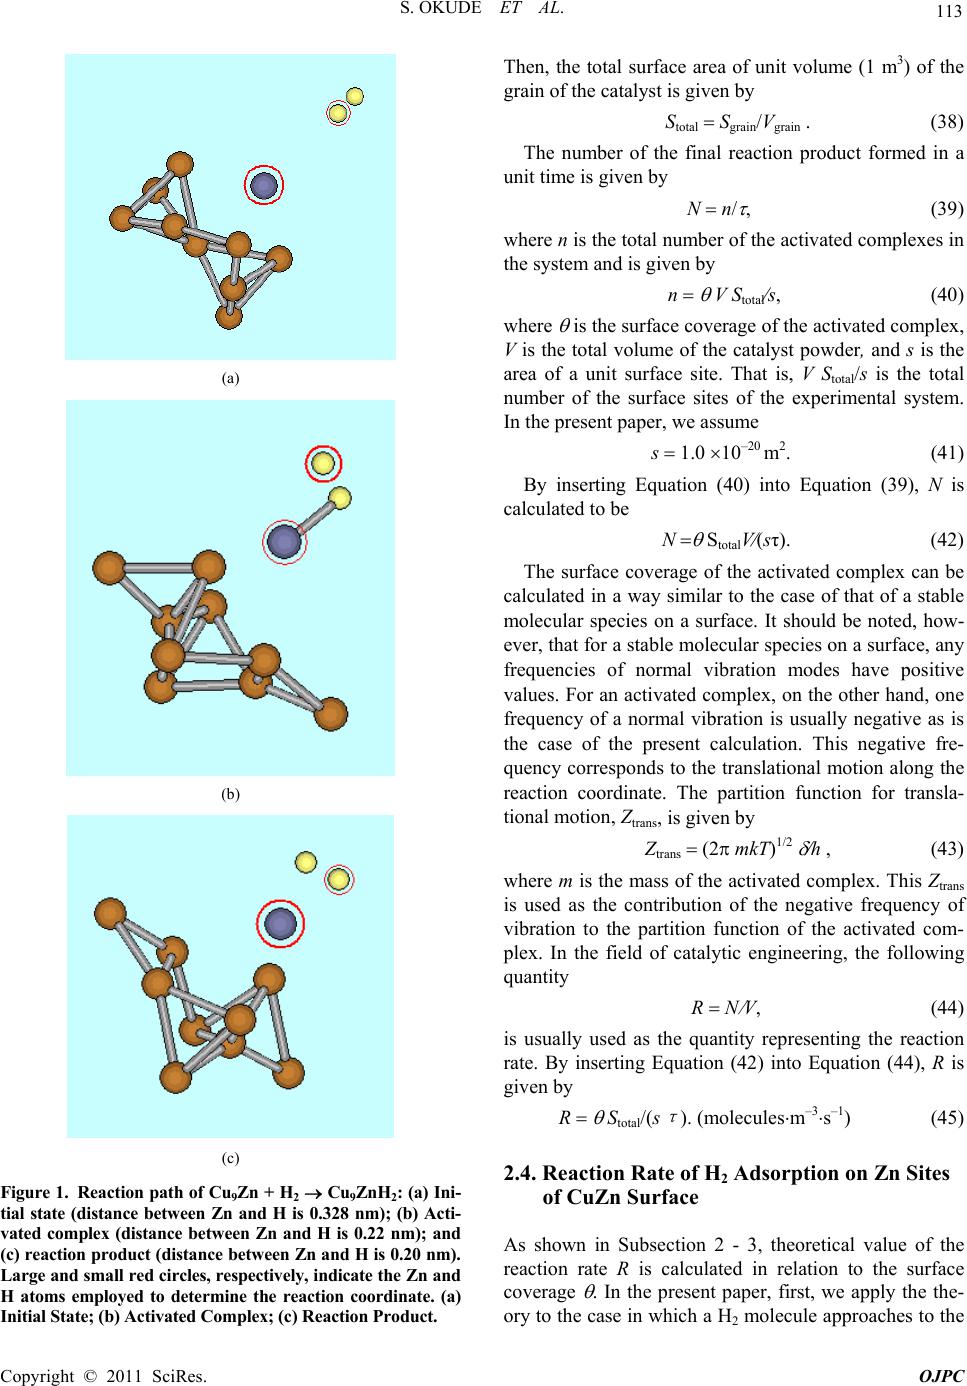 113 S. OKUDE ET AL. (a) (b) (c) Figure 1. Reaction path of Cu9Zn + H2 Cu9ZnH2: (a) Ini- tial state (distance between Zn and H is 0.328 nm); (b) Acti- vated complex (distance between Zn and H is 0.22 nm); and (c) reaction product (distance between Zn and H is 0.20 nm). Large and small red circles, respectively, indicate the Zn and H atoms employed to determine the reaction coordinate. (a) Initial State; (b) Activated Complex; (c) Reaction Product. Then, the total surface area of unit volume (1 m3) of the grain of the catalyst is given by Stotal SgrainVgrain . (38) The number of the final reaction product formed in a unit time is given by N n , (39) where n is the total number of the activated complexes in the system and is given by n V Stotals, (40) where is the surface coverage of the activated complex, V is the total volume of the catalyst powder, and s is the area of a unit surface site. That is, V Stotals is the total number of the surface sites of the experimental system. In the present paper, we assume s 1.0 10–20 m2. (41) By inserting Equation (40) into Equation (39), N is calculated to be N StotalV(sτ). (42) The surface coverage of the activated complex can be calculated in a way similar to the case of that of a stable molecular species on a surface. It should be noted, how- ever, that for a stable molecular species on a surface, any frequencies of normal vibration modes have positive values. For an activated complex, on the other hand, one frequency of a normal vibration is usually negative as is the case of the present calculation. This negative fre- quency corresponds to the translational motion along the reaction coordinate. The partition function for transla- tional motion, Ztrans, is given by Ztrans (2 mkT)1/2 h , (43) where m is the mass of the activated complex. This Ztrans is used as the contribution of the negative frequency of vibration to the partition function of the activated com- plex. In the field of catalytic engineering, the following quantity R N V, (44) is usually used as the quantity representing the reaction rate. By inserting Equation (42) into Equation (44), R is given by R Stotal/(s τ ). (moleculesm–3s–1) (45) 2.4. Reaction Rate of H2 Adsorption on Zn Sites of CuZn Surface As shown in Subsection 2 - 3, theoretical value of the reaction rate R is calculated in relation to the surface coverage . In the present paper, first, we apply the the- ory to the case in which a H2 molecule approaches to the Copyright © 2011 SciRes. OJPC  S. OKUDE ET AL. 114 Zn site of a Cu9Zn cluster: H2 + Cu9Zn → Cu9 ZnH2. (46) To calculate the value of R, we calculate of the acti- vated complex system as follows. The free energy of the activated complex system is given by Equation (2), where N is the number of H2 molecules in activated complexes, N0 is the total number of the surface sites of the Cu9Zn cluster, and G3 (instead of G) is given by G3 (2SH + 1) (2SH + 1), (47) and V3 (instead of V), the partition function for vibration of H2 in an activated complex on the Cu9Zn cluster, is given by V3 VCu9Zn+H2 VCu9Zn, (48) where VCu9Zn is the partition function for vibration of Cu9Zn cluster given by Equation (7), where, i is the frequency of the i’th normal vibration of Cu9Zn cluster, and VCu9Zn+H2 is the partition function for vibration of the total activation complex of H2 + Cu9Zn cluster: VCu9Zn+H2 Ztrans Cu9Zn+H2{1[exp(h i(2kT)) exp(h i (2kT))]}. (49) Here, Ztrans is the partition function of translational motion along the reaction coordinate, which has negative vibration frequency, (see Equation (43)), i is the fre- quency of the i’th normal vibration of Cu9 + H2 cluster whose frequency is positive, and in Equation (2) is, in this case, the heat of adsorption, 4, which is given by H2 (gas) → H2 (activated complex) + 4. (50) The chemical potential of H2 in the activated complex is defined by Equation (10), where F(N) is the free en- ergy of the activated complex system described above. Thus we obtain Equation (11) as the chemical potential of H2 in an activated complex, by replacing G1, V1, and 1 with G3, V3, and 4, respectively. The chemical poten- tial of an isolated H2 molecule, on the other hand, is given by Equation (26). In this case, 3 equals to zero, since the activated complex is H2 molecular specimen and not dissociated H atoms on the surface. The condition of the thermal equilibrium between a H2 gas molecule and H2 molecular specimen in the activated complex is given by Equation (17). The value of N/(N0 – N) is given by Equation (18), where A is given by Equation (19). In this Equation (19), G3, V3, and 4 are used instead of G1, V1, and 1, respectively, m is the mass of a H2 molecule, j is given by Equation (13) with gnuc is given by Equation (28) and Vmolec_vibration (T) is given by Equation (29). Surface coverage H2_activated is defined by Equation (20), and is given by Equation (21). The reaction rate Rcalc of H2 adsorption is given by Equation (45) (R Rcalc), where H2_activated is used instead of . 3. Results and Discussion 3.1. CO2 Molecules Adsorbed on the Surface of a Cu9 Cluster The value of CO2 of CO2 molecules chemically adsorbed on a Cu surface has been numerically calculated in the temperature range 200 - 1000 K and in the pressure range 20 - 100 atm. The value of CO2 is 1.0, irrespective of the temperature and gas pressure: CO2 1.0 100. (Cu surface, 200 - 1000 K, 20 - 100 atm) (51) Thus, all the Cu surface sites adsorb CO2 molecules, with virtually no vacant sites remaining on the surface. As mentioned before, we adopt a non-dissociative che- mical absorption model of CO2 on Cu surface [6]. Equa- tion (51) shows that the surface coverage of such ad- sorbing CO2 is considerably high (near 1.0) under the experimental conditions considered here. This means that such non-dissociative adsorbing CO2 is thermodynami- cally stable. This result is consistent with the catalytic reaction model given in Ref.6. 3.2. H2 Molecules Adsorbed on the Surface of a Cu9 Cluster The value of H2, the coverage of H atoms chemically adsorbed on a Cu surface has been calculated in the temperature range of 200 - 1000 K and in the pressure range 20 - 100 atm. Table 1 shows the result of this nu- merical calculation. Under these temperature and pres- sure conditions, it is found that almost all of the Cu9 sur- face sites are vacant. Thus, H atoms are rarely adsorbed on the Cu surface. This is in good accordance with the statement in Ref.18 that “dissociative chemisorption of H2 molecules is not found in experiments”. Under the same temperature and pressure conditions, the surface coverage of H atoms chemically adsorbed on a Zn surface is calculated. In the calculation, a Zn9 cluster and a H2 molecule are involved. Table 2 shows the result of this numerical calculation. Under these temperature and pressure conditions, considerable nu- mbers of H2 are adsorbed on the Zn surface. 3.3. CO2 and H2 Molecules Co-Adsorbed on the Surface of a Cu9 Cluster In this part, we consider the case in which CO2 and H2 molecules are co-adsorbed on the surface of a Cu9 Copyright © 2011 SciRes. OJPC  S. OKUDE ET AL. Copyright © 2011 SciRes. OJPC 115 Table 1. Surface coverage of H atoms chemically adsorbed on a Cu surface calculated as a function of H2 gas pressure and temperature. 200 K 400 K 600 K 800 K 1000 K 20 atm 1.37 × 10–46 4.01 × 10⁻²⁵ 5.79 × 10⁻¹⁸ 2.27 × 10⁻¹⁴ 3.33 × 10⁻¹² 40 atm 1.94 × 10–46 5.67 × 10⁻²⁵ 8.19 × 10⁻¹⁸ 3.21 × 10⁻¹⁴ 4.71 × 10⁻¹² 60 atm 2.38 × 10–46 6.94 × 10⁻²⁵ 1.00 × 10⁻¹⁷ 3.93 × 10⁻¹⁴ 5.77 × 10⁻¹² 80 atm 2.75 × 10–46 8.01 × 10⁻²⁵ 1.16 × 10⁻¹⁷ 4.53 × 10⁻¹⁴ 6.67 × 10⁻¹² 100 atm 3.07 × 10–46 8.96 × 10⁻²⁵ 1.30 × 10⁻¹⁷ 5.07 × 10⁻¹⁴ 7.45 × 10⁻¹² Table 2. Surface coverage of H atoms chemically adsorbed on a Zn surface calculated as a function of H2 gas pressure and temperature. 200 K 400 K 600 K 800 K 1000 K 20 atm 1.00 × 100 9.98 × 10⁻¹ 9.16 × 10⁻¹ 5.83 × 10⁻¹ 2.93 × 10⁻¹ 40 atm 1.00 × 100 9.99 × 10⁻¹ 9.39 × 10⁻¹ 6.64 × 10⁻¹ 3.70 × 10⁻¹ 60 atm 1.00 × 100 9.99 × 10⁻¹ 9.50 × 10⁻¹ 7.07 × 10⁻¹ 4.18 × 10⁻¹ 80 atm 1.00 × 100 9.99 × 10⁻¹ 9.56 × 10⁻¹ 7.36 × 10⁻¹ 4.53 × 10⁻¹ 100 atm 1.00 × 100 9.99 × 10⁻¹ 9.61 × 10⁻¹ 7.57 × 10⁻¹ 4.81 × 10⁻¹ cluster. In a previous theoretical calculation [6], it was shown that formate (HCO2 adsorbed on Cu cluster surface) plays an important role in the catalytic forma- tion of methanol from H2 and CO2. PM6 calculation in the present paper shows that HCO2 adsorbed on Cu 9 cluster has a negative charge of –0.872. This negative charge makes a formate molecule chemically stable on a Cu surface. On a Zn surface, on the contrary, HCO2 is unstable, and it is dissociated into atoms. This behavior is based on the result of present calculation, namely a Zn surface adsorbs H atoms well (see Table 2), but on a Cu surface virtually no adsorption of H atoms takes place (Table 1). These results suggest that on the surface of a CuZn metal alloy catalyst, it is likely that Cu surface sites play an important role in adsorbing CO2, and Zn surface sites in adsorbing H, leading to the formation of HCO2 on Cu surface sites. 3.4. CO2 and H2CO2 Co-Adsorbed on a Cu Surface In this subsection, we discuss the co-adsorption of CO2 and H2CO2 on a Cu surface. As described in Sec.3-1, a Cu surface is nearly saturated with CO2 when it is ex- posed to pure CO2 gas. Here we investigate whether H2CO2 and CO2 can be co-adsorbed on the surface of a Cu9 cluster when CO2 gas and H2 gas coexist. In this case, the condition of thermal equilibrium is given by the equations (CO2 gas) (CO2 adsorbed), (52) (CO2 gas) + (H2 gas) (H2CO2 adsorbed). (53) Solving these equations, the values of NCO2 adsorbed(N0 NH2CO2 adsorbed ) and NH2CO2 adsorbed(N0 – NCO2 adsorbed) can be obtained, where N0 is the total number of the surface sites of the Cu9 cluster, NCO2 adsorbed is the total number of adsorbed CO2 molecules, and NH2CO2 adsorbed is the total number of adsorbed H2CO2 molecules. Table 3 summarizes the result of present calculation, showing the surface coverage of co-adsorbed CO2 and H2CO2. The temperature range is 600 - 1000 K and the total pressure range is 60 - 100 atm, with the condition that the partial pressure of CO2 equals to that of H2. From Table 3, it is seen that most of Cu surface sites adsorb CO2 molecules but much less H2CO2 molecules at 600 K. At 1000K, on the other hand, considerable amounts of both CO2 and H2CO2 are adsorbed on the Cu surface. In a previous quantum chemical calculation [6], it was sug- gested that dioxomethylene (H2CO2) adsorbed on a Cu cluster surface might play an important role in the cata- lytic formation of methanol from H2 and CO2. The sur- face coverage of H2CO2 obtained from the present work strongly supports the catalytic chemical reaction model proposed in Ref.6. 3.5. Reaction Rate of H2 Adsorption on Zn Sites of CuZn Surface Reaction rate, Rcalc, of H2 adsorption on Zn sites of CuZn surface is calculated in the temperature range of 400 - 600 K and in the gas pressure range of 60 - 100 atm.  S. OKUDE ET AL. 116 Numerical values of Rcalc are shown in Table 4. The value of Rcalc can be approximately given by Rcalc (1.5 1032) PH2・exp(-Ecalc R0T), (moleculesm–3s–1) (54) where PH2 is the pressure of H2 gas (Pa) and Ecalc is given by Ecalc 80 kJ mole. (55) It is known that the inverse shift reaction, CO2 + H2 → CO + H2O, (56) plays an important role in the methanol formation from H2 and CO2 using a CuZn catalyst [4]. The rate constant of this inverse shift reaction was experimentally obtained to be [4] Rexp (1.1 1036) fH2·exp(-EexpR0T), (moleculesm–3s–1) (57) where fH2 is the fugacity of H2 gas (Pa), and Eexp was given by Eexp 121 kJmole (58) The experiment [4] was carried out around the tem- perature 503 - 521 K and the gas pressure 100 atom (H2 gas plus CO2 gas). It should be noted that Equation (57) includes the fugacity of H2 gas, fH2, but dose not include the fugacity of CO2 gas, fCO2. This situation is in good agreement with the result of the present paper that the surface is nearly saturated with CO2 chemical species when H2 gas and CO2 gas coexist in the experimental range of pressure and temperature (see Equation (51)). The values of Rexp [4] and Rcalc are compared in Table 4. The values of frequency factor and activation energy calculated in the present paper are considerably different from those obtained experimentally. The present values of and Rcalc, however, agree well with the values of Rexp. (see Table 4) in the range where experiment was carried out (503 - 521 K). This shows that the reaction in which a Zn site on a Cu9Zn catalyst surface adsorbs H chemical species is one of the rate determining steps in the inverse shift reaction given by Equation (56). 3.6. Reaction Rate of Chemical Adsorption of H2 Gas on CO2 Chemical Species on Cu9 Cluster Finally we estimate the reaction rate, Rcalc, of chemical adsorption of H2 gas on CO2 chemical species on Cu9 cluster. In other words, we estimate the rate of gas phase H2 reaction with CO2 chemical species. As a result, H2CO2 would be formed on the surface. This estimation is calculated in the temperature range of 400 – 600 K and in the gas pressure range of 60 - 100 atm. The value of Rcalc is approximately given by Rcalc (1.49 1031)PH2 exp( Ecalc R0T), (59) where PH2 is the pressure of H2 gas (Pa) and Ecalc is given by Ecalc 299 kJmole. (60) This activation energy, Ecalc, is much larger than that of the inverse shift reaction given in Equation (58). The value of the frequency factor, 1.49 1031, is much smaller than the frequency factor of the inverse shift re- action (see Equation (57)). Therefore, the quantitative value of reaction rate of chemical adsorption of H2 gas on CO2 chemical species on Cu9 cluster is much smaller Table 3. Surface coverage of CO2 chemical species and H2CO2 chemical species co-adsorbed on a Cu surface calculated as a function of gas pressure and temperature. 600 K 1000 K Total pressure CO2 H 2CO2 CO2 H 2CO2 60 atm 1.0 × 100 3.76 × 10⁻⁷ 7.24 × 10⁻¹ 2.76 × 10⁻¹ 80 atm 1.0 × 100 5.01 × 10⁻⁷ 6.63 × 10⁻¹ 3.37 × 10⁻¹ 100 atm 1.0 × 100 6.27 × 10⁻⁷ 6.11 × 10⁻¹ 3.89 × 10⁻¹ Table 4. Reaction rate (moleculesm–3s–1) of H2 adsorption on Zn sites of CuZn surface. Experimental values (Rexp) are taken from Ref.(4), while the calculated values (Rcalc) are from the present calculation. 400 K 500 K 600 K Total pressure Rexp Rcalc Rexp Rcalc Rexp Rcalc 60 atm 5.4 × 1026 1.6 × 1028 7.8 × 1029 2.0 × 1030 1.0 × 1032 5.4 × 1031 80 atm 7.2 × 1026 2.1 × 1028 1.0 × 1030 2.7 × 1030 1.3 × 1032 7.1 × 1031 100 atm 9.0 × 1026 2.6 × 1028 1.3 × 1030 3.4 × 1030 1.7 × 1032 9.0 × 1031 Copyright © 2011 SciRes. OJPC 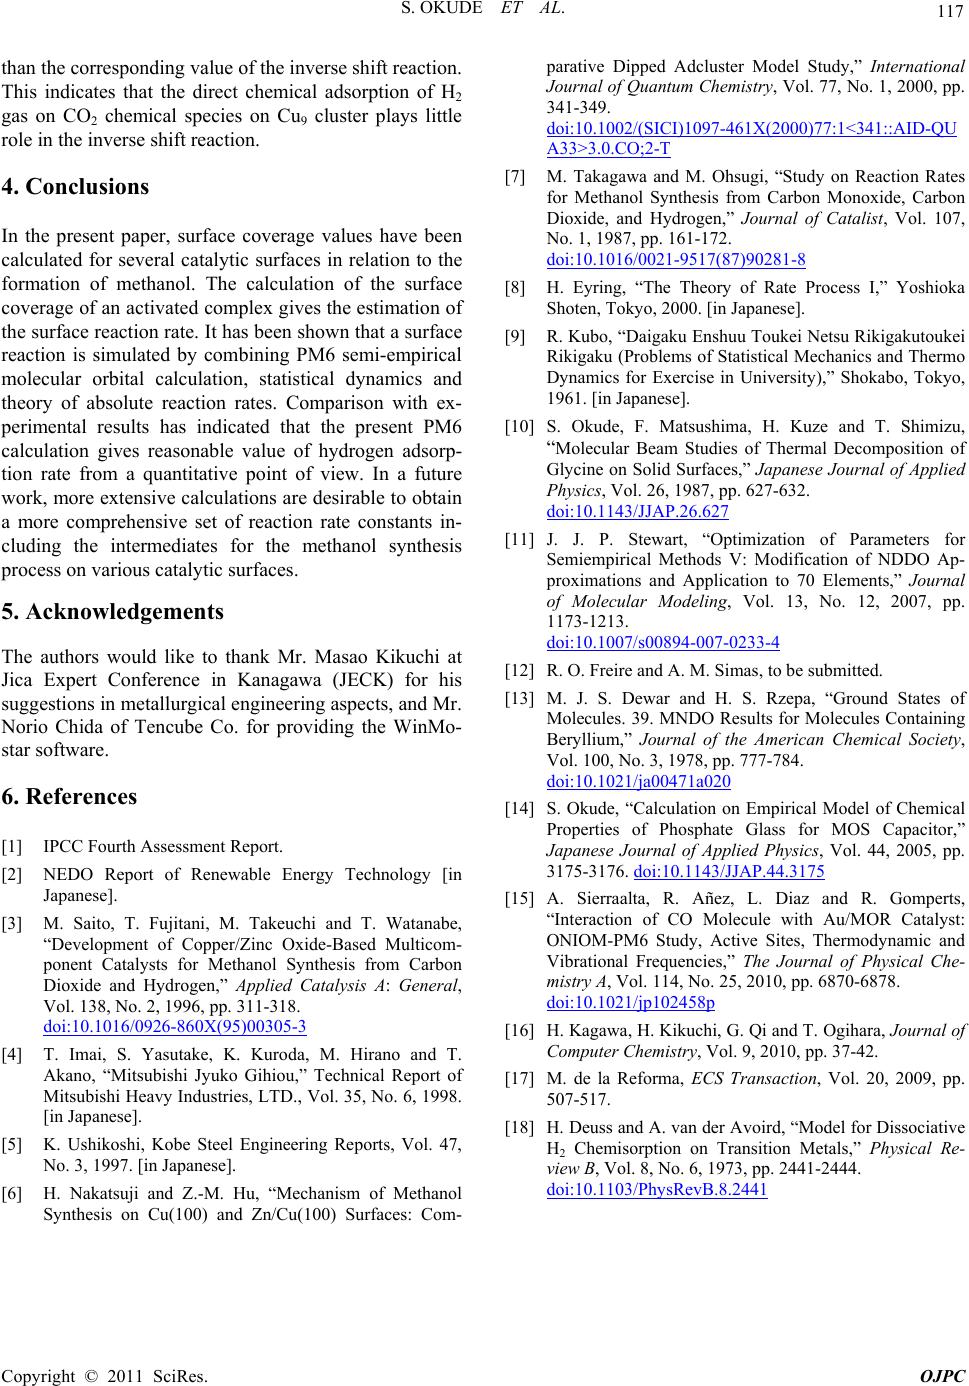 117 S. OKUDE ET AL. than the corresponding value of the inverse shift reaction. This indicates that the direct chemical adsorption of H2 gas on CO2 chemical species on Cu9 cluster plays little role in the inverse shift reaction. 4. Conclusions In the present paper, surface coverage values have been calculated for several catalytic surfaces in relation to the formation of methanol. The calculation of the surface coverage of an activated complex gives the estimation of the surface reaction rate. It has been shown that a surface reaction is simulated by combining PM6 semi-empirical molecular orbital calculation, statistical dynamics and theory of absolute reaction rates. Comparison with ex- perimental results has indicated that the present PM6 calculation gives reasonable value of hydrogen adsorp- tion rate from a quantitative point of view. In a future work, more extensive calculations are desirable to obtain a more comprehensive set of reaction rate constants in- cluding the intermediates for the methanol synthesis process on various catalytic surfaces. 5. Acknowledgements The authors would like to thank Mr. Masao Kikuchi at Jica Expert Conference in Kanagawa (JECK) for his suggestions in metallurgical engineering aspects, and Mr. Norio Chida of Tencube Co. for providing the WinMo- star software. 6. References [1] IPCC Fourth Assessment Report. [2] NEDO Report of Renewable Energy Technology [in Japanese]. [3] M. Saito, T. Fujitani, M. Takeuchi and T. Watanabe, “Development of Copper/Zinc Oxide-Based Multicom- ponent Catalysts for Methanol Synthesis from Carbon Dioxide and Hydrogen,” Applied Catalysis A: General, Vol. 138, No. 2, 1996, pp. 311-318. doi:10.1016/0926-860X(95)00305-3 [4] T. Imai, S. Yasutake, K. Kuroda, M. Hirano and T. Akano, “Mitsubishi Jyuko Gihiou,” Technical Report of Mitsubishi Heavy Industries, LTD., Vol. 35, No. 6, 1998. [in Japanese]. [5] K. Ushikoshi, Kobe Steel Engineering Reports, Vol. 47, No. 3, 1997. [in Japanese]. [6] H. Nakatsuji and Z.-M. Hu, “Mechanism of Methanol Synthesis on Cu(100) and Zn/Cu(100) Surfaces: Com- parative Dipped Adcluster Model Study,” International Journal of Quantum Chemistry, Vol. 77, No. 1, 2000, pp. 341-349. doi:10.1002/(SICI)1097-461X(2000)77:1<341::AID-QU A33>3.0.CO;2-T [7] M. Takagawa and M. Ohsugi, “Study on Reaction Rates for Methanol Synthesis from Carbon Monoxide, Carbon Dioxide, and Hydrogen,” Journal of Catalist, Vol. 107, No. 1, 1987, pp. 161-172. doi:10.1016/0021-9517(87)90281-8 [8] H. Eyring, “The Theory of Rate Process I,” Yoshioka Shoten, Tokyo, 2000. [in Japanese]. [9] R. Kubo, “Daigaku Enshuu Toukei Netsu Rikigakutoukei Rikigaku (Problems of Statistical Mechanics and Thermo Dynamics for Exercise in University),” Shokabo, Tokyo, 1961. [in Japanese]. [10] S. Okude, F. Matsushima, H. Kuze and T. Shimizu, “Molecular Beam Studies of Thermal Decomposition of Glycine on Solid Surfaces,” Japanese Journal of Applied Physics, Vol. 26, 1987, pp. 627-632. doi:10.1143/JJAP.26.627 [11] J. J. P. Stewart, “Optimization of Parameters for Semiempirical Methods V: Modification of NDDO Ap- proximations and Application to 70 Elements,” Journal of Molecular Modeling, Vol. 13, No. 12, 2007, pp. 1173-1213. doi:10.1007/s00894-007-0233-4 [12] R. O. Freire and A. M. Simas, to be submitted. [13] M. J. S. Dewar and H. S. Rzepa, “Ground States of Molecules. 39. MNDO Results for Molecules Containing Beryllium,” Journal of the American Chemical Society, Vol. 100, No. 3, 1978, pp. 777-784. doi:10.1021/ja00471a020 [14] S. Okude, “Calculation on Empirical Model of Chemical Properties of Phosphate Glass for MOS Capacitor,” Japanese Journal of Applied Physics, Vol. 44, 2005, pp. 3175-3176. doi:10.1143/JJAP.44.3175 [15] A. Sierraalta, R. Añez, L. Diaz and R. Gomperts, “Interaction of CO Molecule with Au/MOR Catalyst: ONIOM-PM6 Study, Active Sites, Thermodynamic and Vibrational Frequencies,” The Journal of Physical Che- mistry A, Vol. 114, No. 25, 2010, pp. 6870-6878. doi:10.1021/jp102458p [16] H. Kagawa, H. Kikuchi, G. Qi and T. Ogihara, Journal of Computer Chemistry, Vol. 9, 2010, pp. 37-42. [17] M. de la Reforma, ECS Transaction, Vol. 20, 2009, pp. 507-517. [18] H. Deuss and A. van der Avoird, “Model for Dissociative H2 Chemisorption on Transition Metals,” Physical Re- view B, Vol. 8, No. 6, 1973, pp. 2441-2444. doi:10.1103/PhysRevB.8.2441 Copyright © 2011 SciRes. OJPC
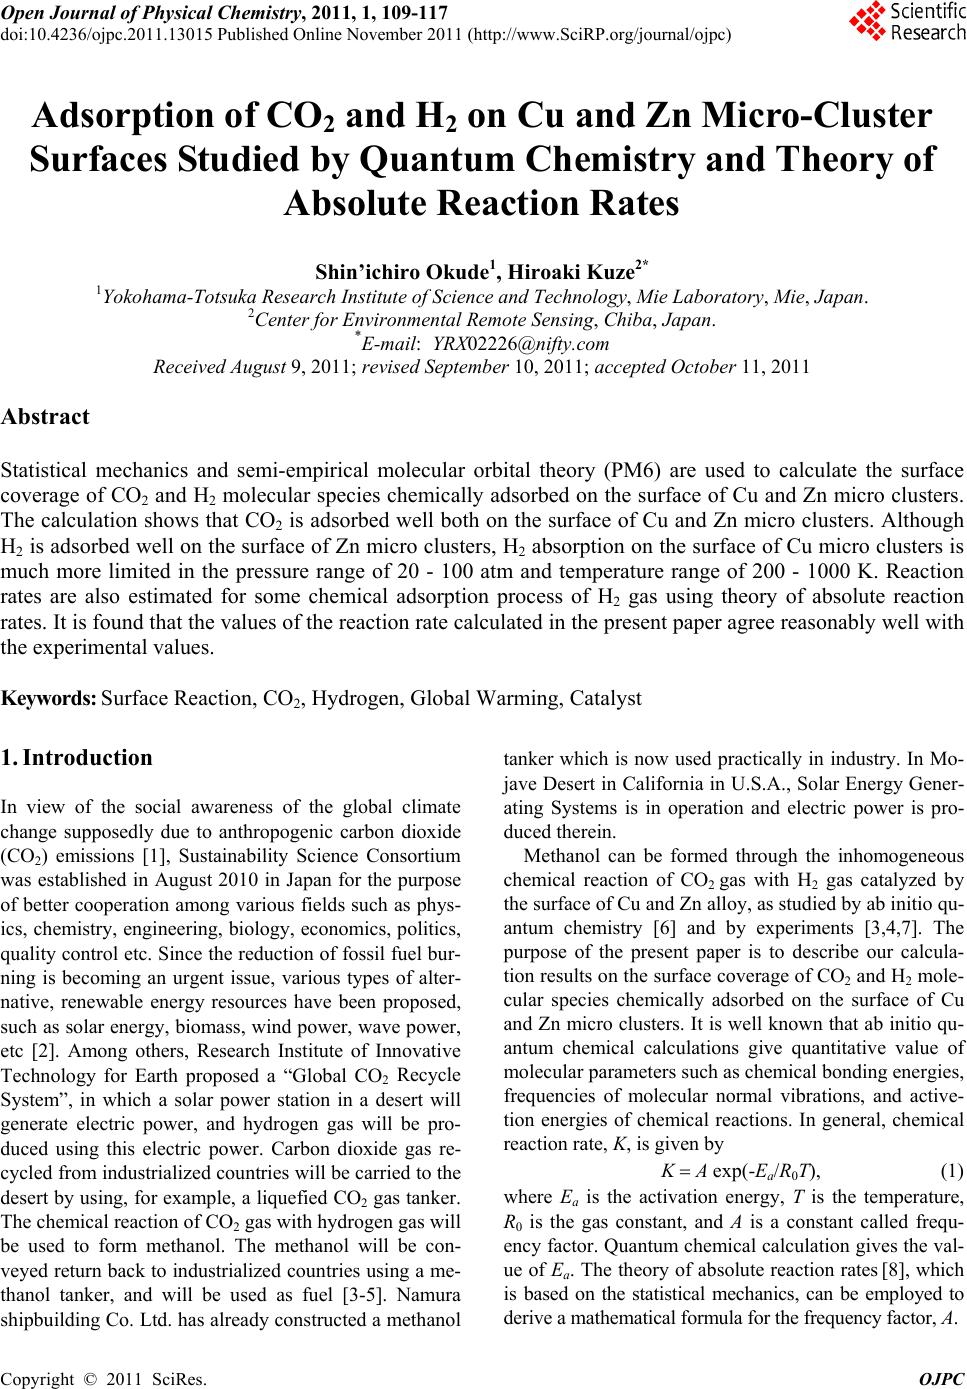
|