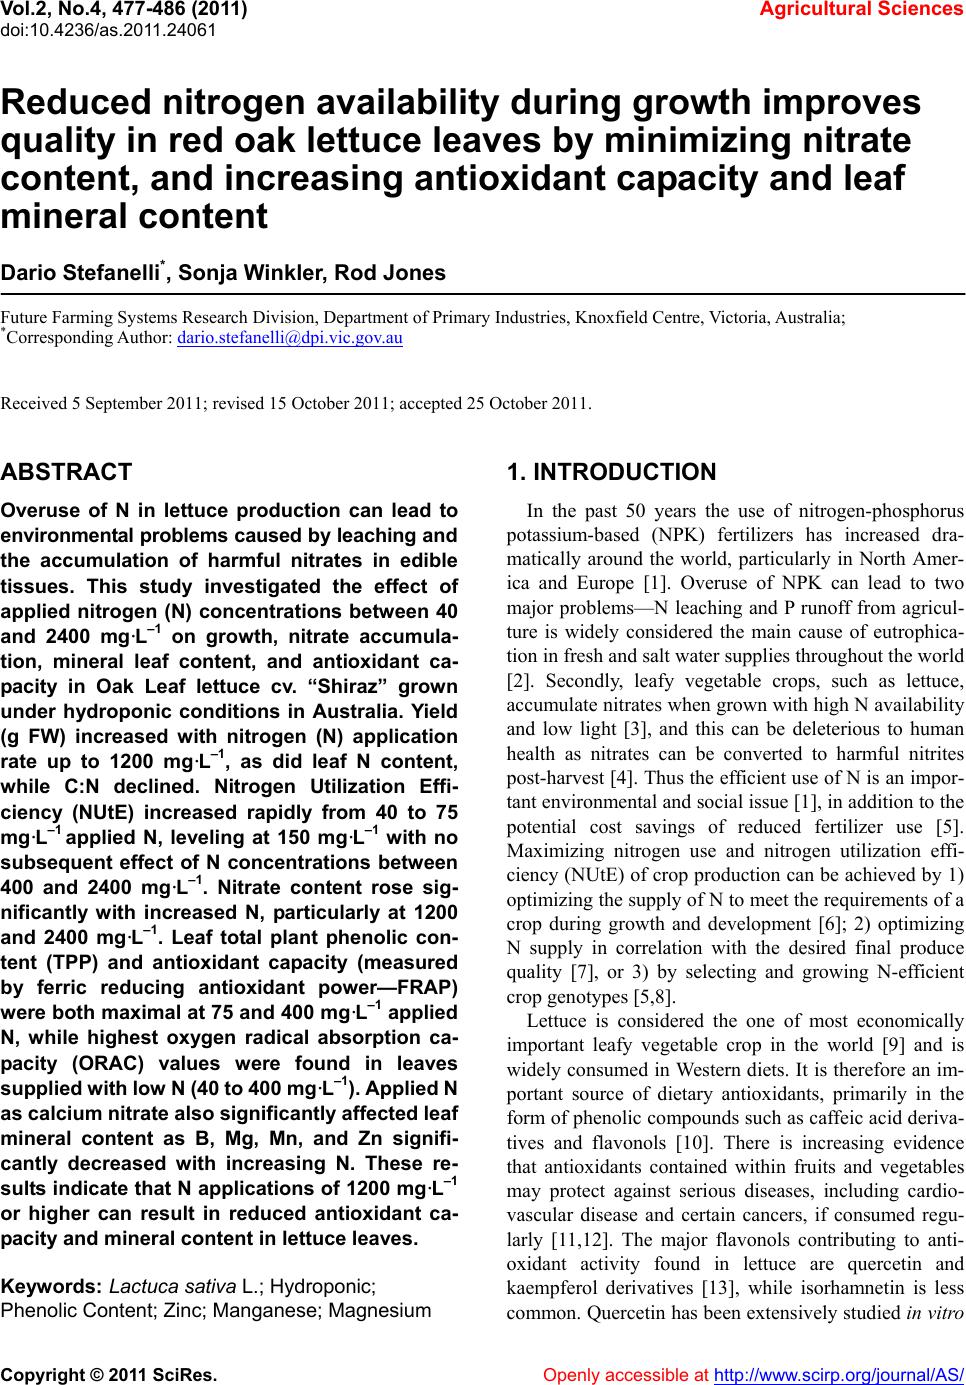
 Vol.2, No.4, 477-486 (2011) doi:10.4236/as.2011.24061 C opyright © 2011 SciRes. Openly accessible at http://www.scirp.org/journal/AS/ Agricultural Scienc es Reduced nitrogen availability during growth improves quality in red oak lettuce leaves by minimizing nitrate content, and increasing antioxidant capacity and leaf mineral content Dario Stefanelli*, Sonja Winkler, Rod Jones Future Farming Systems Research Division, Department of Primary Industries, Knoxfield Centre, Victoria, Australia; *Corresponding Author: dario.stefanelli@dpi.vic.gov.au Received 5 September 2011; revised 15 October 2011; accepted 25 October 2011. ABSTRACT Overuse of N in lettuce production can lead to environmental problems caused by leaching an d the accumulation of harmful nitrates in edible tissues. This study investigated the effect of applied nitrogen (N) concentrations between 40 and 2400 mg·L–1 on growth, nitrate accumula- tion, mineral leaf content, and antioxidant ca- pacity in Oak Leaf lettuce cv. “Shiraz” grown under hydroponic conditions in Australia. Yield (g FW) increased with nitrogen (N) application rate up to 1200 mg·L–1, as did leaf N content, while C:N declined. Nitrogen Utilization Effi- ciency (NUtE) increased rapidly from 40 to 75 mg·L–1 applied N, leveling at 150 mg·L–1 with no subsequent effect of N concentrations between 400 and 2400 mg·L–1. Nitrate content rose sig- nificantly with increased N, particularly at 1200 and 2400 mg·L–1. Leaf total plant phenolic con- tent (TPP) and antioxidant capacity (measured by ferric reducing antioxidant power—FRAP) were both maximal at 75 and 400 mg·L–1 applied N, while highest oxygen radical absorption ca- pacity (ORAC) values were found in leaves supplied with lo w N (40 to 400 mg·L–1). Applied N as calcium nitrate also significan tly affecte d leaf mineral content as B, Mg, Mn, and Zn signifi- cantly decreased with increasing N. These re- sults indicate that N applications of 1200 mg·L–1 or higher can result in reduced antioxidant ca- pacity and mineral content in lettuce leaves. Keywords: Lactuca sativa L.; Hydroponic; Phenolic Content; Zinc; Manganese; Magne sium 1. INTRODUCTION In the past 50 years the use of nitrogen-phosphorus potassium-based (NPK) fertilizers has increased dra- matically around the world, particularly in North Amer- ica and Europe [1]. Overuse of NPK can lead to two major problems—N leaching and P runoff from agricul- ture is widely considered the main cause of eutrophica- tion in fresh and salt water supplies throughout the world [2]. Secondly, leafy vegetable crops, such as lettuce, accumulate nitrates when grown with high N availability and low light [3], and this can be deleterious to human health as nitrates can be converted to harmful nitrites post-harvest [4]. Thus the efficient use of N is an impor- tant environmental and social issue [1], in addition to the potential cost savings of reduced fertilizer use [5]. Maximizing nitrogen use and nitrogen utilization effi- ciency (NUtE) of crop production can be achieved by 1) optimizing the supply of N to meet the requirements of a crop during growth and development [6]; 2) optimizing N supply in correlation with the desired final produce quality [7], or 3) by selecting and growing N-efficient crop genotypes [5,8]. Lettuce is considered the one of most economically important leafy vegetable crop in the world [9] and is widely consumed in Western diets. It is therefore an im- portant source of dietary antioxidants, primarily in the form of phenolic compounds such as caffeic acid deriva- tives and flavonols [10]. There is increasing evidence that antioxidants contained within fruits and vegetables may protect against serious diseases, including cardio- vascular disease and certain cancers, if consumed regu- larly [11,12]. The major flavonols contributing to anti- oxidant activity found in lettuce are quercetin and kaempferol derivatives [13], while isorhamnetin is less common. Quercetin has been extensively studied in vitro 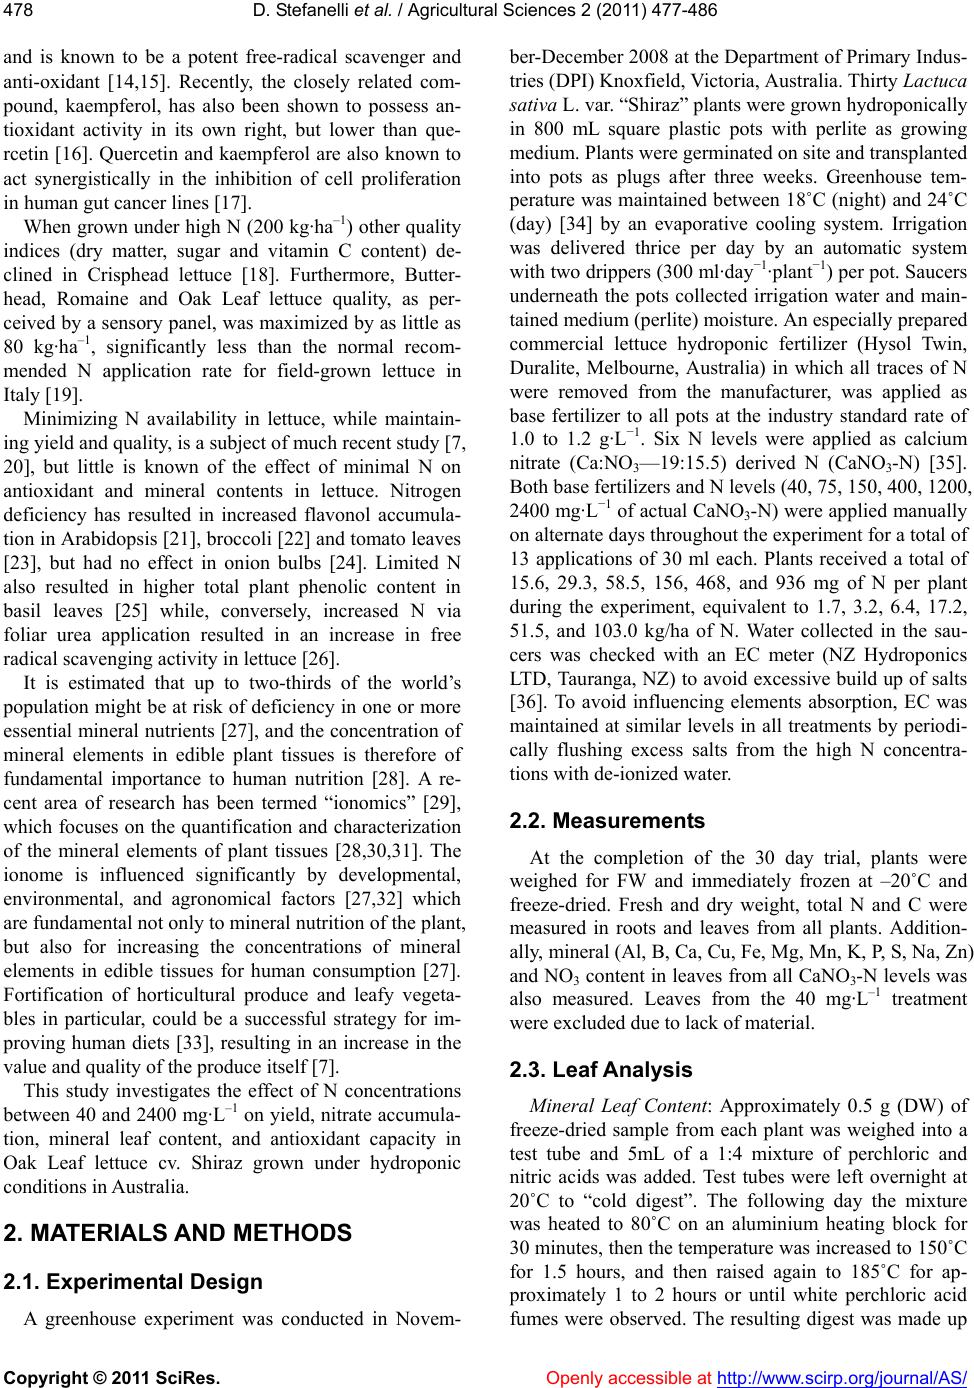 D. Stefanelli et al. / Agricultural Sciences 2 (2011) 477-486 Copyright © 2011 SciRes. Openly accessible at http://www.scirp.org/journal/AS/ 478 and is known to be a potent free-radical scavenger and anti-oxidant [14,15]. Recently, the closely related com- pound, kaempferol, has also been shown to possess an- tioxidant activity in its own right, but lower than que- rcetin [16]. Quercetin and kaempferol are also known to act synergistically in the inhibition of cell proliferation in human gut cancer lines [17]. When grown under high N (200 kg·ha–1) other quality indices (dry matter, sugar and vitamin C content) de- clined in Crisphead lettuce [18]. Furthermore, Butter- head, Romaine and Oak Leaf lettuce quality, as per- ceived by a sensory panel, was maximized by as little as 80 kg·ha–1, significantly less than the normal recom- mended N application rate for field-grown lettuce in Italy [19]. Minimizing N availability in lettuce, while maintain- ing yield and quality, is a subject of much recent study [7, 20], but little is known of the effect of minimal N on antioxidant and mineral contents in lettuce. Nitrogen deficiency has resulted in increased flavonol accumula- tion in Arabidopsis [21], broccoli [22] and tomato leaves [23], but had no effect in onion bulbs [24]. Limited N also resulted in higher total plant phenolic content in basil leaves [25] while, conversely, increased N via foliar urea application resulted in an increase in free radical scavenging activity in lettuce [26]. It is estimated that up to two-thirds of the world’s population might be at risk of deficiency in one or more essential mineral nutrients [27], and the concentration of mineral elements in edible plant tissues is therefore of fundamental importance to human nutrition [28]. A re- cent area of research has been termed “ionomics” [29], which focuses on the quantification and characterization of the mineral elements of plant tissues [28,30,31]. The ionome is influenced significantly by developmental, environmental, and agronomical factors [27,32] which are fundamental not only to mineral nutrition of the plant, but also for increasing the concentrations of mineral elements in edible tissues for human consumption [27]. Fortification of horticultural produce and leafy vegeta- bles in particular, could be a successful strategy for im- proving human diets [33], resulting in an increase in the value and quality of the produce itself [7]. This study investigates the effect of N concentrations between 40 and 2400 mg·L–1 on yield, nitrate accumula- tion, mineral leaf content, and antioxidant capacity in Oak Leaf lettuce cv. Shiraz grown under hydroponic conditions in Australia. 2. MATERIALS AND METHODS 2.1. Experimental Design A greenhouse experiment was conducted in Novem- ber-December 2008 at the Department of Primary Indus- tries (DPI) Knoxfield, Victoria, Australia. Thirty Lactuca sativa L. var. “Shiraz” plants were grown hydroponically in 800 mL square plastic pots with perlite as growing medium. Plants were germinated on site and transplanted into pots as plugs after three weeks. Greenhouse tem- perature was maintained between 18˚C (night) and 24˚C (day) [34] by an evaporative cooling system. Irrigation was delivered thrice per day by an automatic system with two drippers (300 ml·day−1·plant−1) per pot. Saucers underneath the pots collected irrigation water and main- tained medium (perlite) moisture. An especially prepared commercial lettuce hydroponic fertilizer (Hysol Twin, Duralite, Melbourne, Australia) in which all traces of N were removed from the manufacturer, was applied as base fertilizer to all pots at the industry standard rate of 1.0 to 1.2 g·L−1. Six N levels were applied as calcium nitrate (Ca:NO3—19:15.5) derived N (CaNO3-N) [35]. Both base fertilizers and N levels (40, 75, 150, 400, 1200, 2400 mg·L−1 of actual CaNO3-N) were applied manually on alternate days throughout the experiment for a total of 13 applications of 30 ml each. Plants received a total of 15.6, 29.3, 58.5, 156, 468, and 936 mg of N per plant during the experiment, equivalent to 1.7, 3.2, 6.4, 17.2, 51.5, and 103.0 kg/ha of N. Water collected in the sau- cers was checked with an EC meter (NZ Hydroponics LTD, Tauranga, NZ) to avoid excessive build up of salts [36]. To avoid influencing elements absorption, EC was maintained at similar levels in all treatments by periodi- cally flushing excess salts from the high N concentra- tions with de-ionized water. 2.2. Measurements At the completion of the 30 day trial, plants were weighed for FW and immediately frozen at –20˚C and freeze-dried. Fresh and dry weight, total N and C were measured in roots and leaves from all plants. Addition- ally, mineral (Al, B, Ca, Cu, Fe, Mg, Mn, K, P, S, Na, Zn) and NO3 content in leaves from all CaNO3-N levels was also measured. Leaves from the 40 mg·L–1 treatment were excluded due to lack of material. 2.3. Leaf Anal ysis Mineral Leaf Content: Approximately 0.5 g (DW) of freeze-dried sample from each plant was weighed into a test tube and 5mL of a 1:4 mixture of perchloric and nitric acids was added. Test tubes were left overnight at 20˚C to “cold digest”. The following day the mixture was heated to 80˚C on an aluminium heating block for 30 minutes, then the temperature was increased to 150˚C for 1.5 hours, and then raised again to 185˚C for ap- proximately 1 to 2 hours or until white perchloric acid fumes were observed. The resulting digest was made up 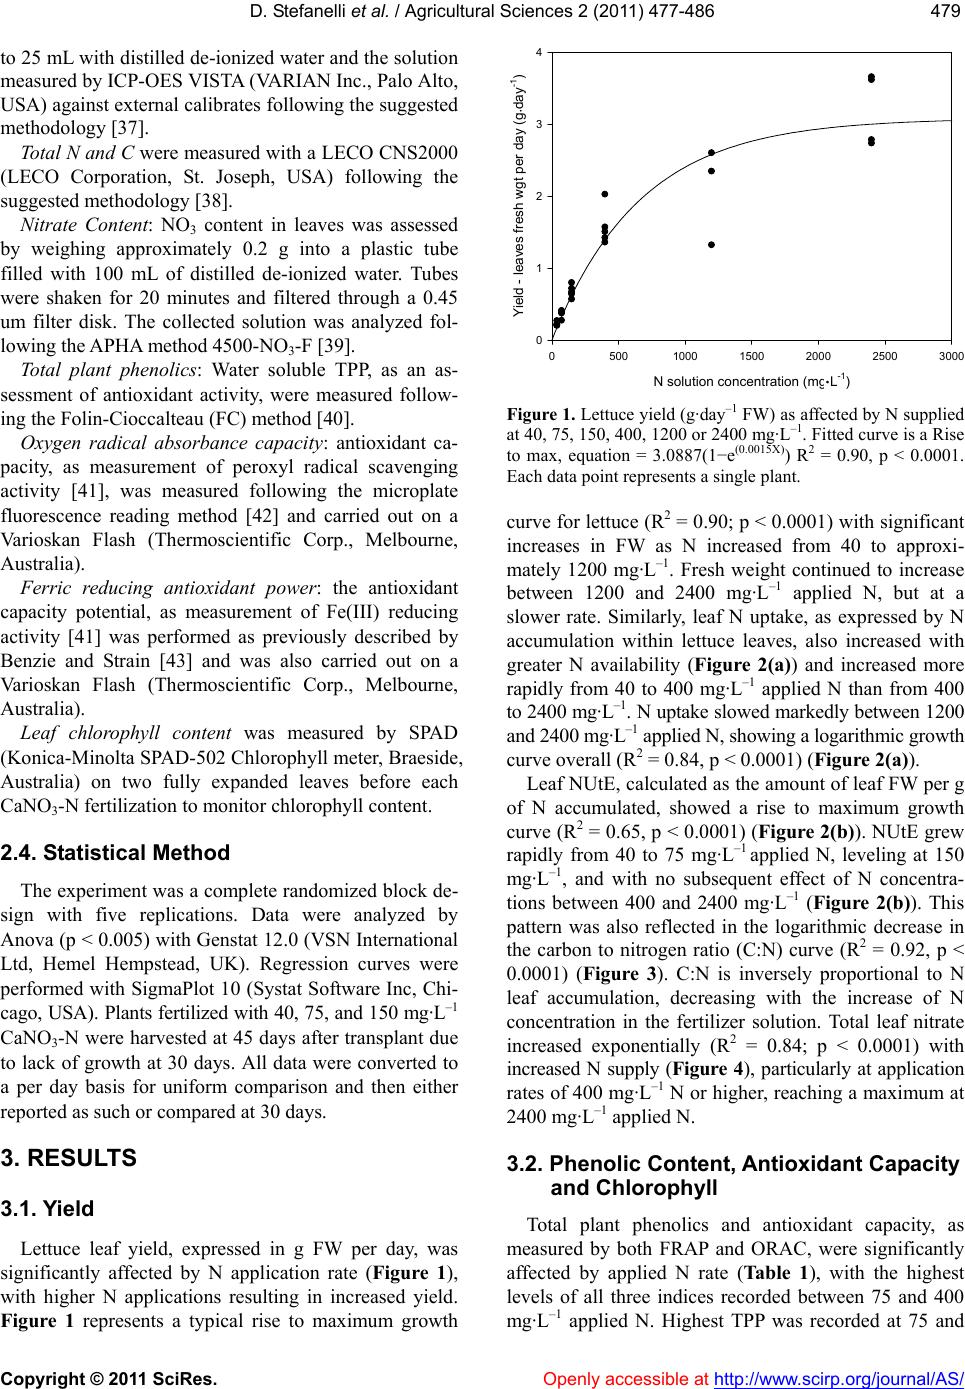 D. Stefanelli et al. / Agricultural Sciences 2 (2011) 477-486 Copyright © 2011 SciRes. Openly accessible at http://www.scirp.org/journal/AS/ 479479 to 25 mL with distilled de-ionized water and the solution measured by ICP-OES VISTA (VARIAN Inc., Palo Alto, USA) against external calibrates following the suggested methodology [37]. Total N and C were measured with a LECO CNS2000 (LECO Corporation, St. Joseph, USA) following the suggested methodology [38]. Nitrate Content: NO3 content in leaves was assessed by weighing approximately 0.2 g into a plastic tube filled with 100 mL of distilled de-ionized water. Tubes were shaken for 20 minutes and filtered through a 0.45 um filter disk. The collected solution was analyzed fol- lowing the APHA method 4500-NO3-F [39]. Total plant phenolics: Water soluble TPP, as an as- sessment of antioxidant activity, were measured follow- ing the Folin-Cioccalteau (FC) method [40]. Oxygen radical absorbance capacity: antioxidant ca- pacity, as measurement of peroxyl radical scavenging activity [41], was measured following the microplate fluorescence reading method [42] and carried out on a Varioskan Flash (Thermoscientific Corp., Melbourne, Australia). Ferric reducing antioxidant power: the antioxidant capacity potential, as measurement of Fe(III) reducing activity [41] was performed as previously described by Benzie and Strain [43] and was also carried out on a Varioskan Flash (Thermoscientific Corp., Melbourne, Australia). Leaf chlorophyll content was measured by SPAD (Konica-Minolta SPAD-502 Chlorophyll meter, Braeside, Australia) on two fully expanded leaves before each CaNO3-N fertilization to monitor chlorophyll content. 2.4. Statistical Method The experiment was a complete randomized block de- sign with five replications. Data were analyzed by Anova (p < 0.005) with Genstat 12.0 (VSN International Ltd, Hemel Hempstead, UK). Regression curves were performed with SigmaPlot 10 (Systat Software Inc, Chi- cago, USA). Plants fertilized with 40, 75, and 150 mg·L–1 CaNO3-N were harvested at 45 days after transplant due to lack of growth at 30 days. All data were converted to a per day basis for uniform comparison and then either reported as such or compared at 30 days. 3. RESULTS 3.1. Yield Lettuce leaf yield, expressed in g FW per day, was significantly affected by N application rate (Figure 1), with higher N applications resulting in increased yield. Figure 1 represents a typical rise to maximum growth N solution concentration (mg L -1 ) 05001000 1500 2000 2500 3000 Yield - leaves fresh wgt per d ay (g day -1 ) 0 1 2 3 4 · · Figure 1. Lettuce yield (g·day–1 FW) as affected by N supplied at 40, 75, 150, 400, 1200 or 2400 mg·L–1. Fitted curve is a Rise to max, equation = 3.0887(1−e(0.0015X)) R2 = 0.90, p < 0.0001. Each data point represents a single plant. curve for lettuce (R2 = 0.90; p < 0.0001) with significant increases in FW as N increased from 40 to approxi- mately 1200 mg·L–1. Fresh weight continued to increase between 1200 and 2400 mg·L–1 applied N, but at a slower rate. Similarly, leaf N uptake, as expressed by N accumulation within lettuce leaves, also increased with greater N availability (Figure 2(a)) and increased more rapidly from 40 to 400 mg·L–1 applied N than from 400 to 2400 mg·L–1. N uptake slowed markedly between 1200 and 2400 mg·L–1 applied N, showing a logarithmic growth curve overall (R2 = 0.84, p < 0.0001) (Figure 2(a)). Leaf NUtE, calculated as the amount of leaf FW per g of N accumulated, showed a rise to maximum growth curve (R2 = 0.65, p < 0.0001) (Figure 2(b)). NUtE grew rapidly from 40 to 75 mg·L–1 applied N, leveling at 150 mg·L –1, and with no subsequent effect of N concentra- tions between 400 and 2400 mg·L–1 (Figure 2(b)). This pattern was also reflected in the logarithmic decrease in the carbon to nitrogen ratio (C:N) curve (R2 = 0.92, p < 0.0001) (Figure 3). C:N is inversely proportional to N leaf accumulation, decreasing with the increase of N concentration in the fertilizer solution. Total leaf nitrate increased exponentially (R2 = 0.84; p < 0.0001) with increased N supply (Figure 4), particularly at application rates of 400 mg·L–1 N or higher, reaching a maximum at 2400 mg·L–1 applied N. 3.2. Phenolic Content, Antioxidant Capacity and Chlorophyll Total plant phenolics and antioxidant capacity, as measured by both FRAP and ORAC, were significantly affected by applied N rate (Table 1), with the highest levels of all three indices recorded between 75 and 400 mg·L –1 applied N. Highest TPP was recorded at 75 and 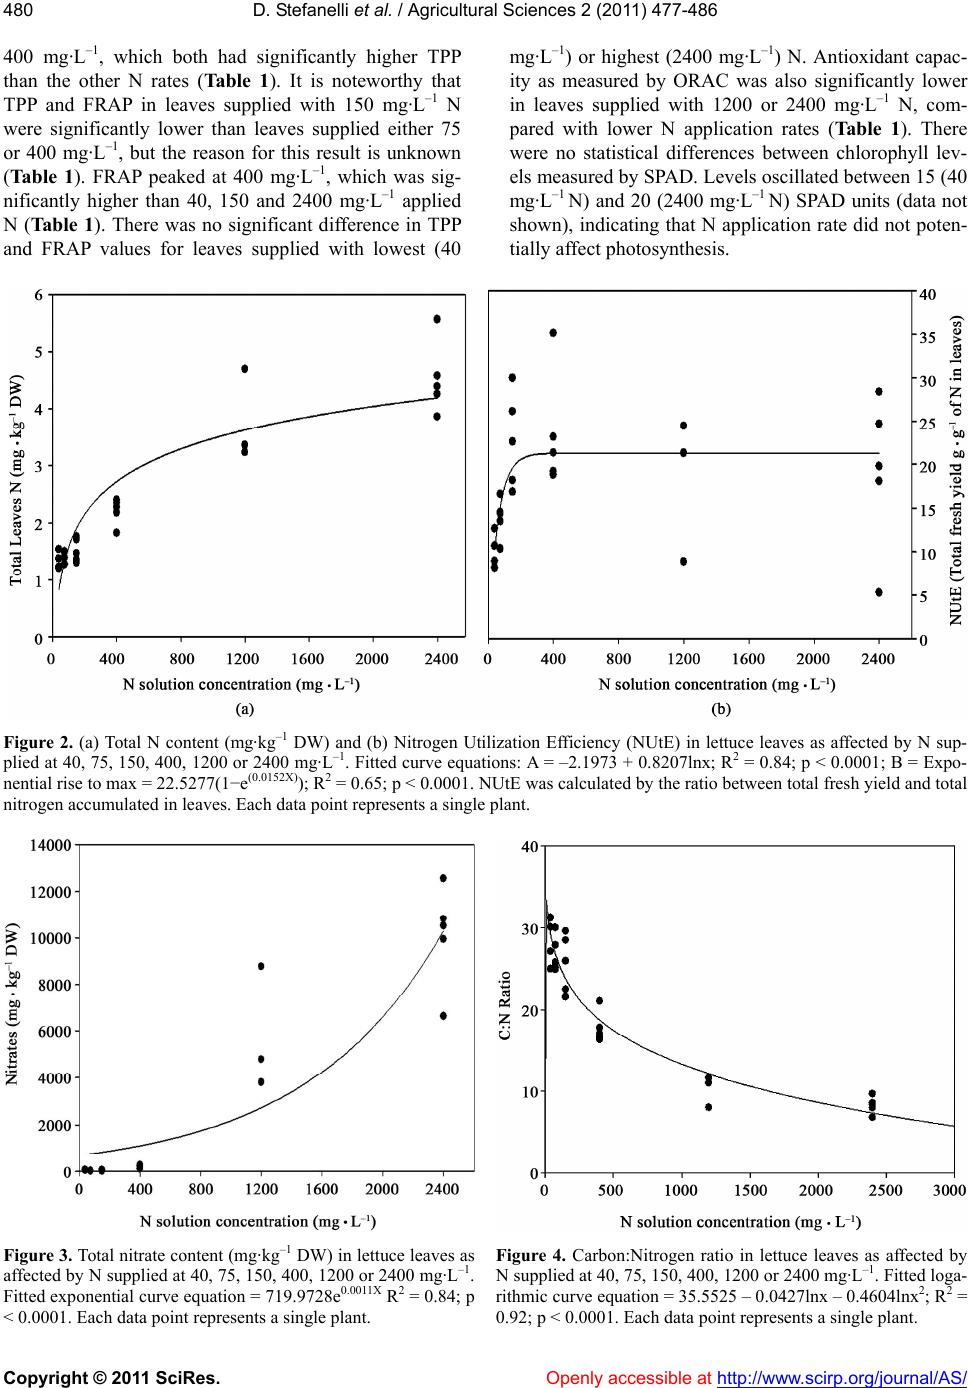 D. Stefanelli et al. / Agricultural Sciences 2 (2011) 477-486 Copyright © 2011 SciRes. http://www.scirp.org/journal/AS/ 480 400 mg·L–1, which both had significantly higher TPP than the other N rates (Table 1). It is noteworthy that TPP and FRAP in leaves supplied with 150 mg·L–1 N were significantly lower than leaves supplied either 75 or 400 mg·L–1, but the reason for this result is unknown (Ta b l e 1 ). FRAP peaked at 400 mg·L–1, which was sig- nificantly higher than 40, 150 and 2400 mg·L–1 applied N (Ta ble 1). There was no significant difference in TPP and FRAP values for leaves supplied with lowest (40 mg·L –1) or highest (2400 mg·L–1) N. Antioxidant capac- ity as measured by ORAC was also significantly lower in leaves supplied with 1200 or 2400 mg·L–1 N, com- pared with lower N application rates (Table 1). There were no statistical differences between chlorophyll lev- els measured by SPAD. Levels oscillated between 15 (40 mg·L –1 N) and 20 (2400 mg·L–1 N) SPAD units (data not shown), indicating that N application rate did not poten- tially affect photosynthesis. Figure 2. (a) Total N content (mg·kg–1 DW) and (b) Nitrogen Utilization Efficiency (NUtE) in lettuce leaves as affected by N sup- plied at 40, 75, 150, 400, 1200 or 2400 mg·L–1. Fitted curve equations: A = –2.1973 + 0.8207lnx; R2 = 0.84; p < 0.0001; B = Expo- nential rise to max = 22.5277(1−e(0.0152X)); R2 = 0.65; p < 0.0001. NUtE was calculated by the ratio between total fresh yield and total nitrogen accumulated in leaves. Each data point represents a single plant. Figure 3. Total nitrate content (mg·kg–1 DW) in lettuce leaves as affected by N supplied at 40, 75, 150, 400, 1200 or 2400 mg·L–1. Fitted exponential curve equation = 719.9728e0.0011X R2 = 0.84; p < 0.0001. Each data point represents a single plant. Figure 4. Carbon:Nitrogen ratio in lettuce leaves as affected by N supplied at 40, 75, 150, 400, 1200 or 2400 mg·L–1. Fitted loga- rithmic curve equation = 35.5525 – 0.0427lnx – 0.4604lnx2; R2 = 0.92; p < 0.0001. Each data point represents a single plant. Openly accessible at 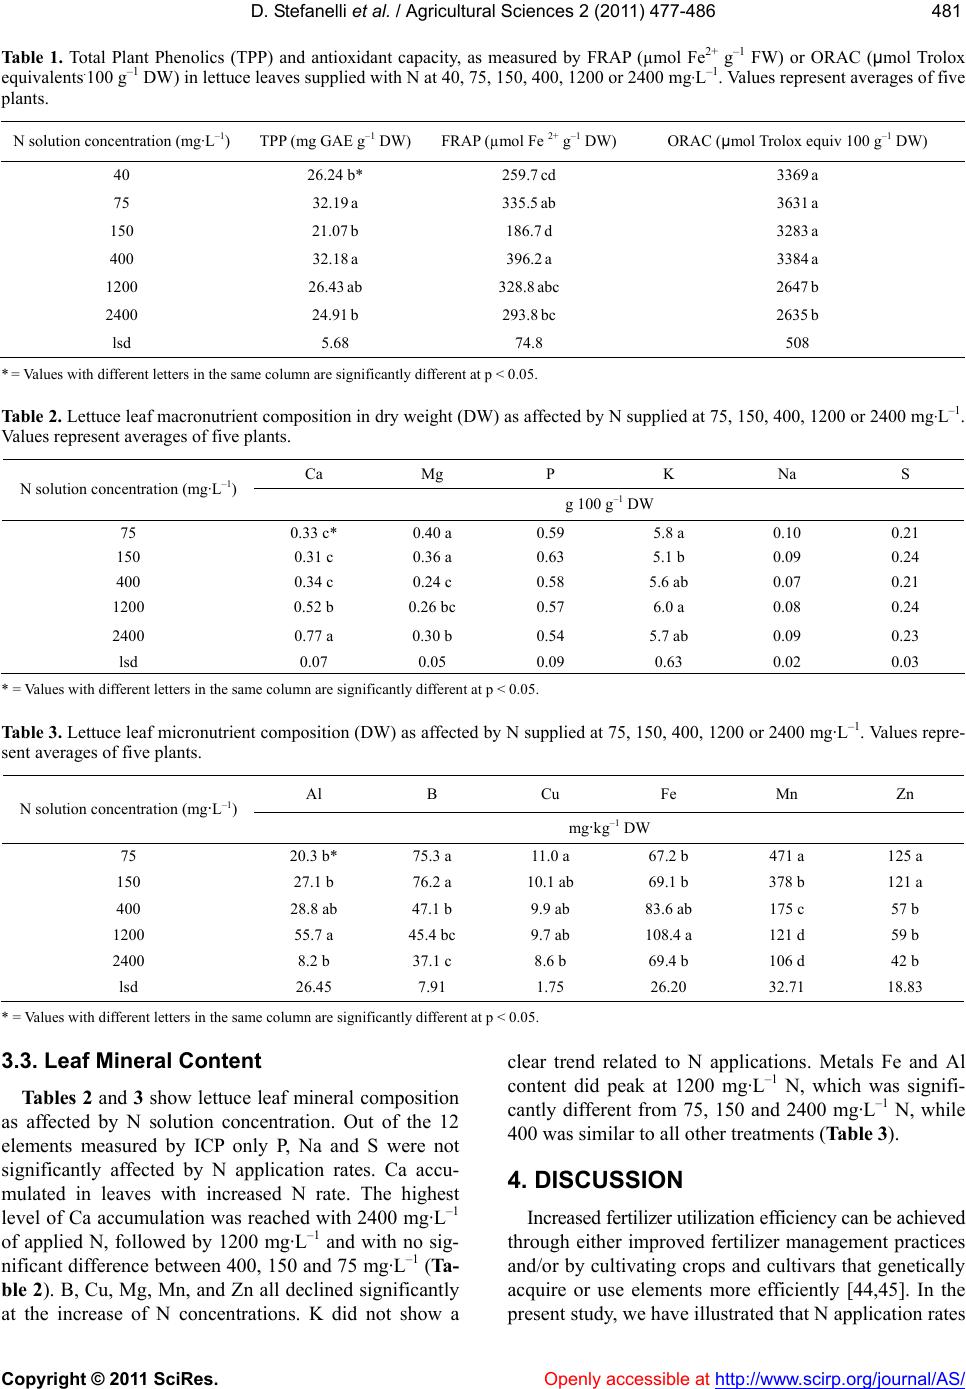 D. Stefanelli et al. / Agricultural Sciences 2 (2011) 477-486 Copyright © 2011 SciRes. Openly accessible at http://www.scirp.org/journal/AS/ 481481 Table 1. Total Plant Phenolics (TPP) and antioxidant capacity, as measured by FRAP (µmol Fe2+ g–1 FW) or ORAC (µmol Trolox equivalents.100 g–1 DW) in lettuce leaves supplied with N at 40, 75, 150, 400, 1200 or 2400 mg·L–1. Values represent averages of five plants. N solution concentration (mg·L–1) TPP (mg GAE g–1 DW) FRAP (µmol Fe 2+ g–1 DW)ORAC (µmol Trolox equiv 100 g–1 DW) 40 26.24 b* 259.7 cd 3369 a 75 32.19 a 335.5 ab 3631 a 150 21.07 b 186.7 d 3283 a 400 32.18 a 396.2 a 3384 a 1200 26.43 ab 328.8 abc 2647 b 2400 24.91 b 293.8 bc 2635 b lsd 5.68 74.8 508 * = Values with different letters in the same column are significantly different at p < 0.05. Table 2. Lettuce leaf macronutrient composition in dry weight (DW) as affected by N supplied at 75, 150, 400, 1200 or 2400 mg·L–1. Values represent averages of five plants. Ca Mg P K Na S N solution concentration (mg·L–1) g 100 g–1 DW 75 0.33 c* 0.40 a 0.59 5.8 a 0.10 0.21 150 0.31 c 0.36 a 0.63 5.1 b 0.09 0.24 400 0.34 c 0.24 c 0.58 5.6 ab 0.07 0.21 1200 0.52 b 0.26 bc 0.57 6.0 a 0.08 0.24 2400 lsd 0.77 a 0.07 0.30 b 0.05 0.54 0.09 5.7 ab 0.63 0.09 0.02 0.23 0.03 * = Values with different letters in the same column are significantly different at p < 0.05. Table 3. Lettuce leaf micronutrient composition (DW) as affected by N supplied at 75, 150, 400, 1200 or 2400 mg·L–1. Values repre- sent averages of five plants. Al B Cu Fe Mn Zn N solution concentration (mg·L–1) mg·kg–1 DW 75 20.3 b* 75.3 a 11.0 a 67.2 b 471 a 125 a 150 27.1 b 76.2 a 10.1 ab 69.1 b 378 b 121 a 400 28.8 ab 47.1 b 9.9 ab 83.6 ab 175 c 57 b 1200 55.7 a 45.4 bc 9.7 ab 108.4 a 121 d 59 b 2400 8.2 b 37.1 c 8.6 b 69.4 b 106 d 42 b lsd 26.45 7.91 1.75 26.20 32.71 18.83 * = Values with different letters in the same column are significantly different at p < 0.05. 3.3. Leaf Mineral Content Tables 2 and 3 show lettuce leaf mineral composition as affected by N solution concentration. Out of the 12 elements measured by ICP only P, Na and S were not significantly affected by N application rates. Ca accu- mulated in leaves with increased N rate. The highest level of Ca accumulation was reached with 2400 mg·L–1 of applied N, followed by 1200 mg·L–1 and with no sig- nificant difference between 400, 150 and 75 mg·L–1 (Ta- ble 2). B, Cu, Mg, Mn, and Zn all declined significantly at the increase of N concentrations. K did not show a clear trend related to N applications. Metals Fe and Al content did peak at 1200 mg·L–1 N, which was signifi- cantly different from 75, 150 and 2400 mg·L–1 N, while 400 was similar to all other treatments (Table 3). 4. DISCUSSION Increased fertilizer utilization efficiency can be achieved through either improved fertilizer management practices and/or by cultivating crops and cultivars that genetically acquire or use elements more efficiently [44,45]. In the present study, we have illustrated that N application rates 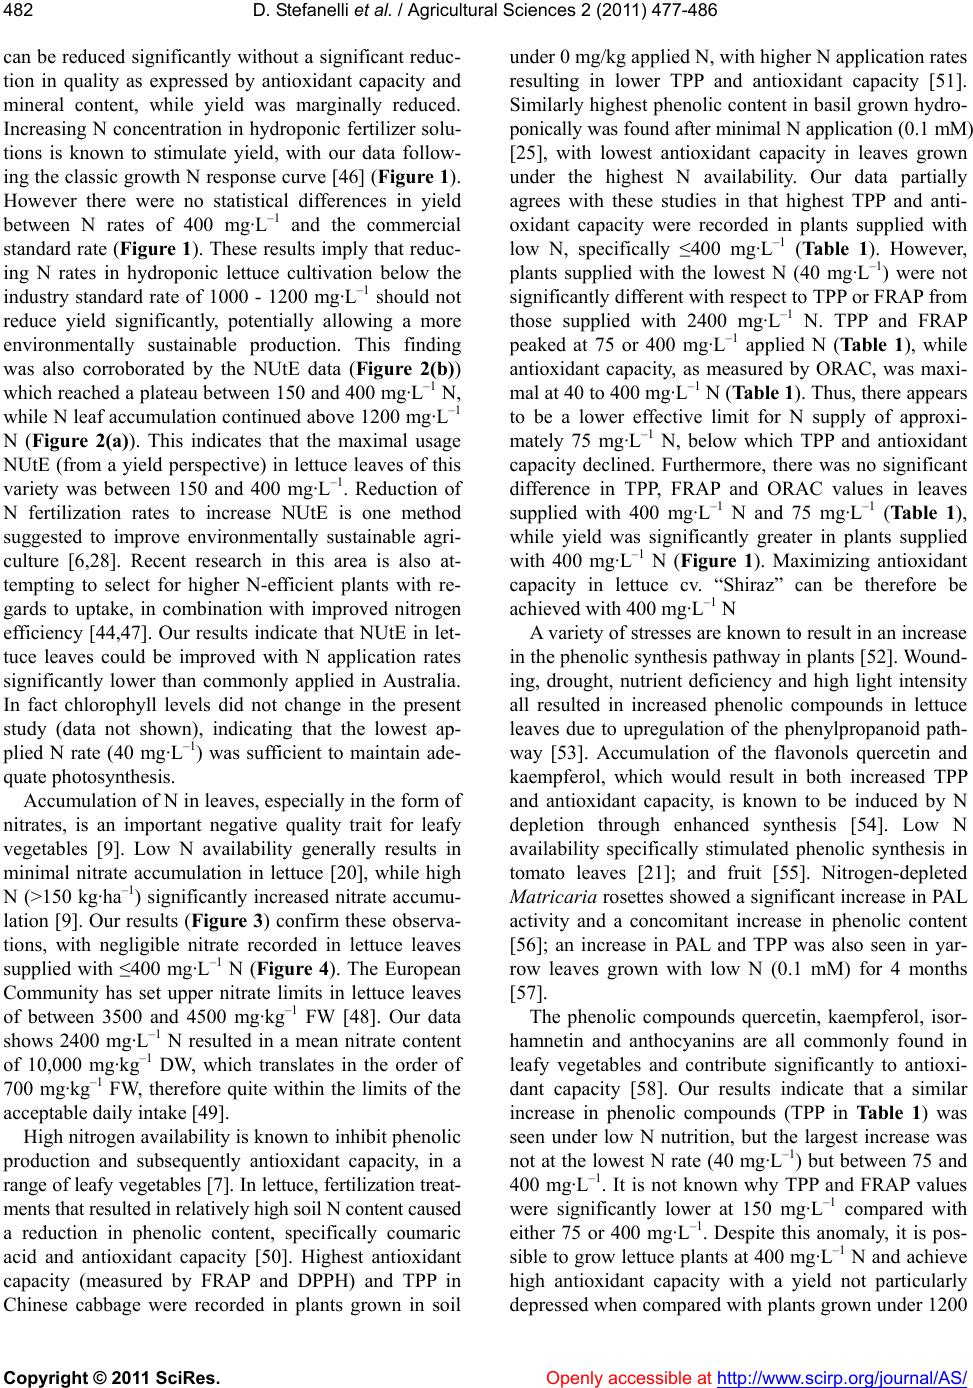 D. Stefanelli et al. / Agricultural Sciences 2 (2011) 477-486 Copyright © 2011 SciRes. Openly accessible at http://www.scirp.org/journal/AS/ 482 can be reduced significantly without a significant reduc- tion in quality as expressed by antioxidant capacity and mineral content, while yield was marginally reduced. Increasing N concentration in hydroponic fertilizer solu- tions is known to stimulate yield, with our data follow- ing the classic growth N response curve [46] (Figure 1). However there were no statistical differences in yield between N rates of 400 mg·L–1 and the commercial standard rate (Figure 1). These results imply that reduc- ing N rates in hydroponic lettuce cultivation below the industry standard rate of 1000 - 1200 mg·L–1 should not reduce yield significantly, potentially allowing a more environmentally sustainable production. This finding was also corroborated by the NUtE data (Figure 2(b)) which reached a plateau between 150 and 400 mg·L–1 N, while N leaf accumulation continued above 1200 mg·L–1 N (Figure 2(a)). This indicates that the maximal usage NUtE (from a yield perspective) in lettuce leaves of this variety was between 150 and 400 mg·L–1. Reduction of N fertilization rates to increase NUtE is one method suggested to improve environmentally sustainable agri- culture [6,28]. Recent research in this area is also at- tempting to select for higher N-efficient plants with re- gards to uptake, in combination with improved nitrogen efficiency [44,47]. Our results indicate that NUtE in let- tuce leaves could be improved with N application rates significantly lower than commonly applied in Australia. In fact chlorophyll levels did not change in the present study (data not shown), indicating that the lowest ap- plied N rate (40 mg·L–1) was sufficient to maintain ade- quate photosynthesis. Accumulation of N in leaves, especially in the form of nitrates, is an important negative quality trait for leafy vegetables [9]. Low N availability generally results in minimal nitrate accumulation in lettuce [20], while high N (>150 kg·ha–1) significantly increased nitrate accumu- lation [9]. Our results (Figure 3) confirm these observa- tions, with negligible nitrate recorded in lettuce leaves supplied with ≤400 mg·L–1 N (Figure 4). The European Community has set upper nitrate limits in lettuce leaves of between 3500 and 4500 mg·kg–1 FW [48]. Our data shows 2400 mg·L–1 N resulted in a mean nitrate content of 10,000 mg·kg–1 DW, which translates in the order of 700 mg·kg–1 FW, therefore quite within the limits of the acceptable daily intake [49]. High nitrogen availability is known to inhibit phenolic production and subsequently antioxidant capacity, in a range of leafy vegetables [7]. In lettuce, fertilization treat- ments that resulted in relatively high soil N content caused a reduction in phenolic content, specifically coumaric acid and antioxidant capacity [50]. Highest antioxidant capacity (measured by FRAP and DPPH) and TPP in Chinese cabbage were recorded in plants grown in soil under 0 mg/kg applied N, with higher N application rates resulting in lower TPP and antioxidant capacity [51]. Similarly highest phenolic content in basil grown hydro- ponically was found after minimal N application (0.1 mM) [25], with lowest antioxidant capacity in leaves grown under the highest N availability. Our data partially agrees with these studies in that highest TPP and anti- oxidant capacity were recorded in plants supplied with low N, specifically ≤400 mg·L–1 (Table 1). However, plants supplied with the lowest N (40 mg·L–1) were not significantly different with respect to TPP or FRAP from those supplied with 2400 mg·L–1 N. TPP and FRAP peaked at 75 or 400 mg·L–1 applied N (Ta ble 1), while antioxidant capacity, as measured by ORAC, was maxi- mal at 40 to 400 mg·L–1 N (Table 1). Thus, there appears to be a lower effective limit for N supply of approxi- mately 75 mg·L–1 N, below which TPP and antioxidant capacity declined. Furthermore, there was no significant difference in TPP, FRAP and ORAC values in leaves supplied with 400 mg·L–1 N and 75 mg·L–1 (Table 1), while yield was significantly greater in plants supplied with 400 mg·L–1 N (Figure 1). Maximizing antioxidant capacity in lettuce cv. “Shiraz” can be therefore be achieved with 400 mg·L–1 N A variety of stresses are known to result in an increase in the phenolic synthesis pathway in plants [52]. Wound- ing, drought, nutrient deficiency and high light intensity all resulted in increased phenolic compounds in lettuce leaves due to upregulation of the phenylpropanoid path- way [53]. Accumulation of the flavonols quercetin and kaempferol, which would result in both increased TPP and antioxidant capacity, is known to be induced by N depletion through enhanced synthesis [54]. Low N availability specifically stimulated phenolic synthesis in tomato leaves [21]; and fruit [55]. Nitrogen-depleted Matricaria rosettes showed a significant increase in PAL activity and a concomitant increase in phenolic content [56]; an increase in PAL and TPP was also seen in yar- row leaves grown with low N (0.1 mM) for 4 months [57]. The phenolic compounds quercetin, kaempferol, isor- hamnetin and anthocyanins are all commonly found in leafy vegetables and contribute significantly to antioxi- dant capacity [58]. Our results indicate that a similar increase in phenolic compounds (TPP in Table 1) was seen under low N nutrition, but the largest increase was not at the lowest N rate (40 mg·L–1) but between 75 and 400 mg·L–1. It is not known why TPP and FRAP values were significantly lower at 150 mg·L–1 compared with either 75 or 400 mg·L–1. Despite this anomaly, it is pos- sible to grow lettuce plants at 400 mg·L–1 N and achieve high antioxidant capacity with a yield not particularly depressed when compared with plants grown under 1200 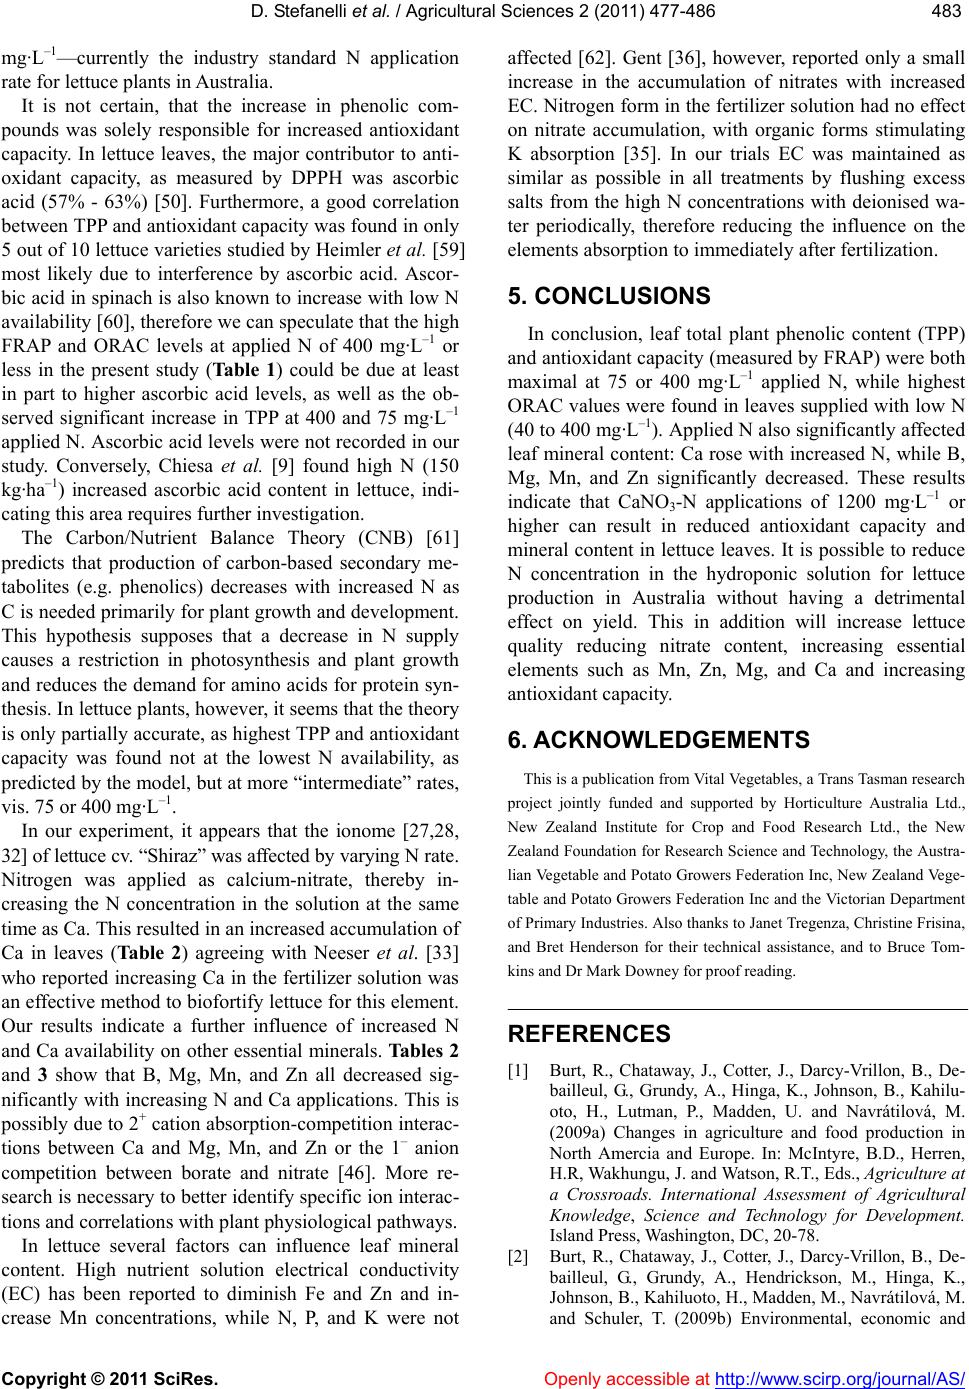 D. Stefanelli et al. / Agricultural Sciences 2 (2011) 477-486 Copyright © 2011 SciRes. Openly accessible at http://www.scirp.org/journal/AS/ 483483 mg·L –1—currently the industry standard N application rate for lettuce plants in Australia. It is not certain, that the increase in phenolic com- pounds was solely responsible for increased antioxidant capacity. In lettuce leaves, the major contributor to anti- oxidant capacity, as measured by DPPH was ascorbic acid (57% - 63%) [50]. Furthermore, a good correlation between TPP and antioxidant capacity was found in only 5 out of 10 lettuce varieties studied by Heimler et al. [59] most likely due to interference by ascorbic acid. Ascor- bic acid in spinach is also known to increase with low N availability [60], therefore we can speculate that the high FRAP and ORAC levels at applied N of 400 mg·L–1 or less in the present study (Ta bl e 1 ) could be due at least in part to higher ascorbic acid levels, as well as the ob- served significant increase in TPP at 400 and 75 mg·L–1 applied N. Ascorbic acid levels were not recorded in our study. Conversely, Chiesa et al. [9] found high N (150 kg·ha–1) increased ascorbic acid content in lettuce, indi- cating this area requires further investigation. The Carbon/Nutrient Balance Theory (CNB) [61] predicts that production of carbon-based secondary me- tabolites (e.g. phenolics) decreases with increased N as C is needed primarily for plant growth and development. This hypothesis supposes that a decrease in N supply causes a restriction in photosynthesis and plant growth and reduces the demand for amino acids for protein syn- thesis. In lettuce plants, however, it seems that the theory is only partially accurate, as highest TPP and antioxidant capacity was found not at the lowest N availability, as predicted by the model, but at more “intermediate” rates, vis. 75 or 400 mg·L–1. In our experiment, it appears that the ionome [27,28, 32] of lettuce cv. “Shiraz” was affected by varying N rate. Nitrogen was applied as calcium-nitrate, thereby in- creasing the N concentration in the solution at the same time as Ca. This resulted in an increased accumulation of Ca in leaves (Ta b le 2 ) agreeing with Neeser et al. [33] who reported increasing Ca in the fertilizer solution was an effective method to biofortify lettuce for this element. Our results indicate a further influence of increased N and Ca availability on other essential minerals. Tables 2 and 3 show that B, Mg, Mn, and Zn all decreased sig- nificantly with increasing N and Ca applications. This is possibly due to 2+ cation absorption-competition interac- tions between Ca and Mg, Mn, and Zn or the 1– anion competition between borate and nitrate [46]. More re- search is necessary to better identify specific ion interac- tions and correlations with plant physiological pathways. In lettuce several factors can influence leaf mineral content. High nutrient solution electrical conductivity (EC) has been reported to diminish Fe and Zn and in- crease Mn concentrations, while N, P, and K were not affected [62]. Gent [36], however, reported only a small increase in the accumulation of nitrates with increased EC. Nitrogen form in the fertilizer solution had no effect on nitrate accumulation, with organic forms stimulating K absorption [35]. In our trials EC was maintained as similar as possible in all treatments by flushing excess salts from the high N concentrations with deionised wa- ter periodically, therefore reducing the influence on the elements absorption to immediately after fertilization. 5. CONCLUSIONS In conclusion, leaf total plant phenolic content (TPP) and antioxidant capacity (measured by FRAP) were both maximal at 75 or 400 mg·L–1 applied N, while highest ORAC values were found in leaves supplied with low N (40 to 400 mg·L–1). Applied N also significantly affected leaf mineral content: Ca rose with increased N, while B, Mg, Mn, and Zn significantly decreased. These results indicate that CaNO3-N applications of 1200 mg·L–1 or higher can result in reduced antioxidant capacity and mineral content in lettuce leaves. It is possible to reduce N concentration in the hydroponic solution for lettuce production in Australia without having a detrimental effect on yield. This in addition will increase lettuce quality reducing nitrate content, increasing essential elements such as Mn, Zn, Mg, and Ca and increasing antioxidant capacity. 6. ACKNOWLEDGEMENTS This is a publication from Vital Vegetables, a Trans Tasman research project jointly funded and supported by Horticulture Australia Ltd., New Zealand Institute for Crop and Food Research Ltd., the New Zealand Foundation for Research Science and Technology, the Austra- lian Vegetable and Potato Growers Federation Inc, New Zealand Vege- table and Potato Growers Federation Inc and the Victorian Department of Primary Industries. Also thanks to Janet Tregenza, Christine Frisina, and Bret Henderson for their technical assistance, and to Bruce Tom- kins and Dr Mark Downey for proof reading. REFERENCES [1] Burt, R., Chataway, J., Cotter, J., Darcy-Vrillon, B., De- bailleul, G., Grundy, A., Hinga, K., Johnson, B., Kahilu- oto, H., Lutman, P., Madden, U. and Navrátilová, M. (2009a) Changes in agriculture and food production in North Amercia and Europe. In: McIntyre, B.D., Herren, H.R, Wakhungu, J. and Watson, R.T., Eds., Agriculture at a Crossroads. International Assessment of Agricultural Knowledge, Science and Technology for Development. Island Press, Washington, DC, 20-78. [2] Burt, R., Chataway, J., Cotter, J., Darcy-Vrillon, B., De- bailleul, G., Grundy, A., Hendrickson, M., Hinga, K., Johnson, B., Kahiluoto, H., Madden, M., Navrátilová, M. and Schuler, T. (2009b) Environmental, economic and  D. Stefanelli et al. / Agricultural Sciences 2 (2011) 477-486 Copyright © 2011 SciRes. Openly accessible at http://www.scirp.org/journal/AS/ 484 social impacts of north america and europe agriculture and agricultural knowledge, science and technology. In: McIntyre, B.D., Herren, H.R., Wakhungu, J. and Watson, R.T., Eds., Agriculture at a Crossroads. International Assessment of Agricultural Knowledge, Science and Technology for Development, Island Press, Washington, DC, 79-115. [3] Demsar, J., Osvald, J. and Vodnik, D. (2004). The effect of light-dependent application of nitrate on the growth of aeroponically grown lettuce (Lactuca sativa L.). Journal of the American Society for Horticultural Science, 129, 570-575. [4] Maynard, D.N. and Barker, A.V. (1979) Regulation of nitrate accumulation in vegetables. Acta Horticulturae, 93, 153-162. [5] Broadley, M.R., Seginer, I., Burns, A., Escobar-Gutiérrez, A.J., Burns, I.G. and Wite, P.J. (2003) The nitrogen and nitrate economy of butterhead lettuce (Lactuca saviva var. capitata L.). Journal of Experimental Botany, 390, 2081- 2090. doi:10.1093/jxb/erg222 [6] Zhu, W., Li, X.L., Christie, P. and Li, J.L. (2005) Envi- ronmental implications of low nitrogen use efficiency in excessively fertilized hot pepper (Capsicum frutescens L.) cropping systems. Agriculture, Ecosystems & Environ- ment, 111 , 70-80. doi:10.1016/j.agee.2005.04.025 [7] Stefanelli, D., Goodwin, I. and Jones, R. (2010) Minimal nitrogen and water use in horticulture: Effects on quality and content of selected nutrients. Food Research Interna- tional, 43, 1833-1843. doi:10.1016/j.foodres.2010.04.022 [8] Maranville, J.W. and Madhavan, S. (2002) Physiological adaptation for nitrogen use efficiency in sorghum. Plant and Soil, 245, 25-34. doi:10.1023/A:1020660504596 [9] Chiesa, A., Mayorga, I. and Leon, A. (2009) Quality of fresh cut lettuce (Lactuca sativa L.) as affected by lettuce genotype, nitrogen fertilisation and crop season. Ad- vances in Horticultural Science, 23, 143-149. [10] Nicolle, C., Cardinault, N., Gueux, E., Jaffrelo, L., Rock, E., Mazur, A., Amouroux, P. and Remesy, C. (2004) Health effect of vegetable-based diet: Lettuce consump- tion improves cholesterol metabolism and antioxidant status in the rat. Clinical Nutrition, 23, 605-614. doi:10.1016/j.clnu.2003.10.009 [11] Birt, D.F., Hendrich, S. and Wang, W. (2001) Dietary agents in cancer prevention: Flavonoids and isoflavon- oids. Pharmacology & Therapeutics, 90, 157-177. doi:10.1016/S0163-7258(01)00137-1 [12] Hu, F.B. (2003) Plant-based foods and prevention of cardiovascular disease: An overview. Americal Journal of Clinical Nutrition, 78, 544S-551S. [13] Hollman, P.C.H. and Katan, M.B. (1999) Dietary flavon- oids: Intake, health effects and bioavailability. Food Chemistry and Toxicology, 37, 937-942. doi:10.1016/S0278-6915(99)00079-4 [14] Larson, A.J., Symons, J.D. and Jalili, T. (2010) Quercetin: A treatment for hypertension? A review of efficacy and mechanisms. Pharmaceuticals (Basel), 3, 237-250. [15] Vargas, A.J. and Burd, R. (2010) Hormesis and synergy: Pathways and mechanisms of quercetin in cancer preven- tion and management. Nutrition Reviews, 68, 418-428. doi:10.1111/j.1753-4887.2010.00301.x [16] Kim, J.-D., Liu, L., Guo, W. and Meydani, M. (2006) Chemical structure of flavonols in relation to modulation of angiogenesis and immune-endothelial cell adhesion. The Journal of Nutritional Biochemistry, 17, 165-176. doi:10.1016/j.jnutbio.2005.06.006 [17] Ackland, L., Van de Waarsenburg, S. and Jones, R.B. (2005) Synergistic antiproliferative effect of the fla- vonols quercetin and kaempferol in cultured human can- cer cell lines. In Vivo, 19, 69-76. [18] Poulsen, N., Johansen, A.S. and Sorensen, J.N. (1995) Influence of growth conditions on the value of crisphead lettuce. 4. Quality changes during storage. Plant Foods for Human Nutrition, 47, 157-162. doi:10.1007/BF01089265 [19] D’Antuono, L.F. and Neri, R. (2001) The evaluation of nitrogen effect on lettuce quality by means of descriptive sensory profiling. Acta Horticulturae, 563, 217-223. [20] Seginer, I. (2003) A dynamic model for nitrogen-stressed lettuce. Annals of Botany, 91, 623-635. doi:10.1093/aob/mcg069 [21] Stewart, A.J., Chapman, W., Jenkins, G.I., Graham, I., Martin, T. and Crozier, A. (2001) The effect of nitrogen and phosphorous deficiency on flavonol accumulation in plant tissues. Plant, Cell & Environment, 24, 1189-1197. doi:10.1046/j.1365-3040.2001.00768.x [22] Jones, R.B., Imsic, M., Franz, P., Hale, G. and Tomkins, R.B. (2007) High nitrogen during growth reduced glu- coraphanin and flavonol content in broccoli (Brassica oleracea var. italica) heads. Australian Journal of Ex- perimental Agricult ure, 47, 1498-1505. doi:10.1071/EA06205 [23] Bongue-Bartelsman, M. and Phillips, D.A. (1995) Nitro- gen stress regulates gene expression of enzymes in the flavonoid biosynthetic pathway of tomato. Plant Physi- ology and Biochemistry, 33, 539-546. [24] Mogren, L.M., Olsson, M.E. and Gertsson, U.E. (2007) Quercetin content in stored onions (Allium cepa L.): Ef- fects of storage conditions, cultivar, lifting time and ni- trogen fertiliser level. Journal of the Science of Food and Agriculture, 87, 1595-1602. doi:10.1002/jsfa.2904 [25] Nguyen, P.M. and Niemeyer, E.D. (2008) Effects of ni- trogen fertilization on the phenolic composition and an- tioxidant properties of Basil (Ocimum basilicum L.). Journal of Agricultural and Food Chemistry, 56 , 8685- 8691. doi:10.1021/jf801485u [26] Mareczek, A. and Leja, M. (2005) Effect of urea foliar application on antioxidant properties of lettuce and broccoli. Lithuanian Institute of Hortictulture Archives, 24, 235-241. [27] White, P.J. and Broadley, M.R. (2009) Biofortification of crops with seven mineral elements often lacking in hu- man diets—Iron, zinc, copper, calcium, magnesium, se- lenium and iodine. New Phytologist, 182, 49-84. doi:10.1111/j.1469-8137.2008.02738.x [28] White, P.J. and Brown, P.H. (2010) Plant nutrition for sustainable development and global health. Annals of Botany, 105, 1073-1080. doi:10.1093/aob/mcq085 [29] Salt, DE. (2004) Update on ionomics. Plant Physiology, 136, 2451-2456. doi:10.1104/pp.104.047753 [30] Baxter, I. (2009) Ionomics: Studying the social network of mineral nutrients. Current Opinion in Cell Biology, 3, 381-386. [31] Watanabe, T., Broadley, M.R., Jansen, S., White, P.J., Takada, J., Satake, K., Takamatsu, T., Tuah, S.J. and  D. Stefanelli et al. / Agricultural Sciences 2 (2011) 477-486 Copyright © 2011 SciRes. Openly accessible at http://www.scirp.org/journal/AS/ 485485 Osaki, M. (2007) Evolutionary control of leaf element composition in plants. New Phytologist, 174, 516-523. doi:10.1111/j.1469-8137.2007.02078.x [32] Broadley, M.R., Hammond, J.P., White, P.J. and Salt, D.E. (2010) An efficient procedure for normalizing ionomics data for Arabidopsis thaliana. New Phytologist, 186, 270-274. doi:10.1111/j.1469-8137.2009.03145.x [33] Neeser, C., Savidov, N. and Driedger, D. (2007) Produc- tion of hydroponically grown calcium fortified lettuce. Acta Horticulturae, 744, 317-321. [34] Seginer, I., Shina, G., Albright, L.D. and Marsh, L.S. (1991) Optimal temperature setpoints for greenhouse lettuce. Journal of Agricultural Engineering Research, 49, 209-226. doi:10.1016/0021-8634(91)80040-L [35] Yilmaz, H. and Dasgan, H.Y. (2009) Comparison of dif- ferent nitrogen forms for growing lettuce. Acta Horticul- turae, 807, 327-332. [36] Gent, M.P.N. (2003) Solution electrical conductivity and ratio of nitrate to other nutrients affect accumulation of nitrate in hydroponic lettuce. HortScience, 38, 222-227. [37] Ryan, A. (1998) Rapid measurement of major, minor and trace elements in plant and food material using the Varian 730-ES. ICP-OES Application Note Number, 33, 1-6. http://www.varianinc.com/image/vimage/docs/applicatio ns/apps/io-033.pdf [38] Leco Corporation (2010) Carbon, nitrogen, and sulfur in plant tissue. Organic Application Note, 203-821-172. http://www.leco.com/resources/application_notes/pdf/CN S2000_PLANT_TISSUE_203-821-172.pdf [39] Eaton, A.D., Clesceri, L.S., Rice, E.W. and Greenberg, A.E. (2005) Standard methods for the examination of water and wastewater. 21st Edition, American Public Health Association (APHA) Press, Washington, DC. [40] Singleton, V.L., Orthofer, R. and Lamuela-Raventós, R.M. (1999) Analysis of total phenolics and other oxidation substrates and antioxidants by means of Folin-Ciocalteu reagent. In: Lester Packer, Ed. Methods in Enzymology. Oxidants and Antioxidants, Part A, Elsevier, San Diego, 299, 152-178. doi:10.1016/S0076-6879(99)99017-1 [41] Ou, B., Huang, D., Hampsch-Woodill, M., Flanagan, J.A. and Deemer, E.K. (2002) Analysis of antioxidant activi- ties of common vegetables employing oxyen radical ab- sorbance capacity (ORAC) and ferric reducing antioxi- dant power (FRAP) assays: A comparative study. Journal of Agricultural and Food Chemistry, 50, 3122-3128. doi:10.1021/jf0116606 [42] Huang, D., Ou, B., Hampsch-Woodill, M., Flanagan, J.A. and Prio, R.L. (2002) High-throughput assay of oxygen radical absorbance capacity (ORAC) using a multichan- nel liquid handling system coupled with a microplate fluorescence reader in 96-well format. Journal of Agri- cultural and Food Chemistry, 50, 4437-4444. doi:10.1021/jf0201529 [43] Benzie, I.F. and Strain, J.J. (1996) The ferric reducing ability of plasma (FRAP) as a measure of “antioxidant power”: The FRAP assay. Analytical Biochemistry, 239, 70-76. doi:10.1006/abio.1996.0292 [44] Hirel, B., Le Gouis, J., Ney, B. and Gallais, A. (2007) The challenge of improving nitrogen use efficiency in crop plants: Towards a more central role for genetic vari- ability and quantitative genetics within integrated ap- proaches. Journal of Experimental Botany, 58, 2369- 2387. doi:10.1093/jxb/erm097 [45] Balint, T. and Rengel, Z. (2008) Nitrogen efficiency of canola genotypes varies between vegetative stage and grain maturity. Euphytica, 164, 421-423. doi:10.1007/s10681-008-9693-6 [46] Mengel, K. and Kirby, E.A. (2001) Principles of plant nutrition. 5th Edition, Kluwer Academic Publisher, Dor- drecht. [47] Collins N.C., Tardieu, F. and Tuberosa, R. (2008) Quan- titative trait loci and crop performance under abiotic stress: Where do we stand? Plant Physiology, 147, 469-486. doi:10.1104/pp.108.118117 [48] European Union. Commission Regulation (EU) No. 420/ 2011 of 29 April (2011) Amending Regulation (EC) No 1881/2006. Setting maximum levels for certain contami- nats in foodstuffs. Official Journal of the European Un- ion L111, 30 April 2011. http://faolex.fao.org/docs/pdf/eur102437.pdf [49] Santamaria, P. (2006) Nitrate in vegetables: Toxicity, content, intake and EC regulation. Journal of the Science of Food and Agriculture, 86, 10-17. doi:10.1002/jsfa.2351 [50] Coria-Cayupan, Y.S., Sanchez de Pinto, M.I. and Naza- reno, N.A. (2009) Variations in bioactive substance con- tents and crop yields of lettuce (Lactuca sativa L.) culti- vated in soils with different fertilization treatments. Journal of Agricultural and Food Chemistry, 57, 10122- 10129. doi:10.1021/jf903019d [51] Zhu, W., Lin, X., Zhang, Y. and Fang, P. (2009) Effects of nitrogen application rates on antioxidant contents and antioxidative activities in Chinese cabbage (Brassica chinensis L.). Journal of the Zhejiang University (Agri- culture and Life Sciences), 35, 299-306. [52] Kang, H.M. and Saltveit, M.E. (2002) Antioxidant ca- pacity of lettuce leaf tissue increases after wounding. Journal of Agricultural and Food Chemistry, 50 , 7536- 7541. doi:10.1021/jf020721c [53] Oh, M.-M., Carey, E.E. and Rajashekar, C.B. (2009) Environmental stresses induce health-promoting phyto- chemicals in lettuce. Plant Physiology and Biochemistry, 47, 578-583. doi:10.1016/j.plaphy.2009.02.008 [54] Olsen, K.M., Slimestad, R., Lea, U.S., Brede, C., Lovdal, T., Ruoff, P., Verheul, M.J. and Lillo, C. (2009) Tem- perature and nitrogen effects on regulators and products of the flavonoid pathway: Experimental and kinetic model studies. Plant, Cell & Environment, 32, 286-299. doi:10.1111/j.1365-3040.2008.01920.x [55] Dumas, Y., Dadomo, M., Di Lucca, G. and Grolier, P. (2003) Effects of environmental factors and agricultural techniques on antioxidant content of tomatoes. Journal of the Science of Food and Agriculture, 83, 369-382. doi:10.1002/jsfa.1370 [56] Kovacik, J. and Backor, M. (2007) Changes of phenolic metabolism and oxidative status in nitrogen-deficient Matricaria chamomilla plants. Plant and Soil, 297, 255- 265. doi:10.1007/s11104-007-9346-x [57] Giorgi, A., Mingozzi, M., Madeo, M., Speranza, G. and Cocucci, M. (2009) Effect of nitrogen starvation on the phenolic metabolism and antioxidant properties of yar- row (Achillea collina Becker ex Rchb.). Food Chemistry, 114, 204-211. doi:10.1016/j.foodchem.2008.09.039  D. Stefanelli et al. / Agricultural Sciences 2 (2011) 477-486 Copyright © 2011 SciRes. http://www.scirp.org/journal/AS/Openly accessible at 486 [58] Rochfort, S.J., Imsic, M., Jones, R.B., Tomkins, R.B. and Trenerry, C.V. (2006) Characterisation of flavonol con- jugates in immature leaves of Pak Choi (Brassica rapa L. ssp. chinensis L. (Hanelt.) by HPLC-DAD and LC- MS/MS. Journal of Agricultural and Food Chemistry, 54, 4855-4860. doi:10.1021/jf060154j [59] Heimler, D., Isolani, L., Vignolini, P., Tombelli, S. and Romani, A. (2007) Polyphenol content and antioxidant activity in some species of freshly consumed salads. Journal of Agricultural and Food Chemistry, 55 , 1724- 1729. doi:10.1021/jf0628983 [60] Mozafar, A. (1996) Decreasing the NO3 and increasing the vitamin C contents in spinach by a nitrogen depriva- tion method. Plant Foods for Human Nutrition, 49 , 155- 162. doi:10.1007/BF01091973 [61] Bryant, J.P., Chapin, F.S. and Klein, D.R. (1983) Car- bon/nutrient balance of boreal plants in relation to verte- brate herbivory. Oikos, 40, 357-368. doi:10.2307/3544308 [62] Abou-Hadid, A.F., Abd-Elmoniem, E.M., El-Shinawy, M.Z. and Abou-Elsoud, M. (1996) Electrical conductiv- ity effect on growth and mineral composition of lettuce plants in hydroponic system. Acta Horticolturae, 343, 59-66.
|