Paper Menu >>
Journal Menu >>
 Modern Economy, 2011, 2, 880-892 doi:10.4236/me.2011.25099 Published Online November 2011 (http://www.SciRP.org/journal/me) Copyright © 2011 SciRes. ME The Employment of Young Graduates in the Period 2000-2010: A Comparison between Six European Countries* Paola Potestio University of Rome, Rome, Italy E-mail: potestio@uniroma3.it Received August 31, 2011; revised Oc to be r 10, 2011; accepted October 22, 2011 Abstract The paper aims to assess the relative importance of participation and unemployment and the interaction be- tween them in affecting the evolution of employment rates of young graduates in selected European coun- tries. The Taylor formula is used to read the behaviour of employment rates in terms of movements in activ- ity and unemployment rates. Using this analytical procedure, the comparison between the selected countries underscores two aspects in particular: the progressive isolation of Italy, due to the poor results of the reform of the higher education system at the end of the 1990s, and the widespread progress within the female seg- ments. On a more general plane, the heterogeneity of European labour markets for young graduates assumes new characteristics in the decade but—it is argued—it remains significant. The relative importance of par- ticipation and unemployment, the impact of the reforms of the higher education system, the reaction to the crisis of the late 2000s, and the gender aspects sharply differentiate the evolution of young graduate em- ployment in the individual countries. Keywords: European Graduate Employment Rates, Higher Education System, Activity and Unemployment Rate 1. Introduction Matching the demand for and supply of labour generally presents more difficulties for the youth segments of the labour force. The size of the gap between youth and overall unemployment rates, particularly in a number of European countries, has already been stressed in OECD [1] for the p urpose of p olicy interv entions . Delayed entry into the labour markets in turn co ntributes, albeit to very differing extents, to generally lower employment rates for young people than those for more central age groups. The issues of training and education and access to the labour market have been constant features in all subse- quent steps of the employment policy of the European Union.1 To facilitate access to the labour market was a crucial indication within one of the four “pillars”—em- ployability—of the European Employment Strategy, first designed in 1997. The aim to adapt “Europe’s education and training systems both to the demands of the knowl- edge society and to the need for an improved level and quality of employment” was a key point in the Presidency Conclusions of the Lisbon European Council of 23 and 24 March 2000. Again, to invest in human capital, “rais- ing educational levels and developing an adaptable workforce suited to the challenges of a knowledge-based economy”, was one of the four key requirements stressed in the Report of the Employment Taskforce established by the Europ ean Head s of State and Gov ernment in 2 003 [2]. Finally the three priorities of smart, sustainable and inclusive growth of the current “Europe 2020 Strategy” are founded on seven “flagship initiatives”, one of which is in fact “‘Youth on the move’ to enhance the perform- ance of education systems and to facilitate the entry of young people to the labour market”. So far, at the macro level, this attention has not pro- duced widespread, uniform progress in the employment of young people in the European Union. The aim of this paper is to focus on a specific segment of the youth la- *I wish to thank N. Massarelli and F. Zirilli for help and discussions on the topics addressed in the paper. The responsibility for all opinions a n d any errors is mine alone. 1Gold [3] offers a useful overview of the themes and orientations of the European employment policy. 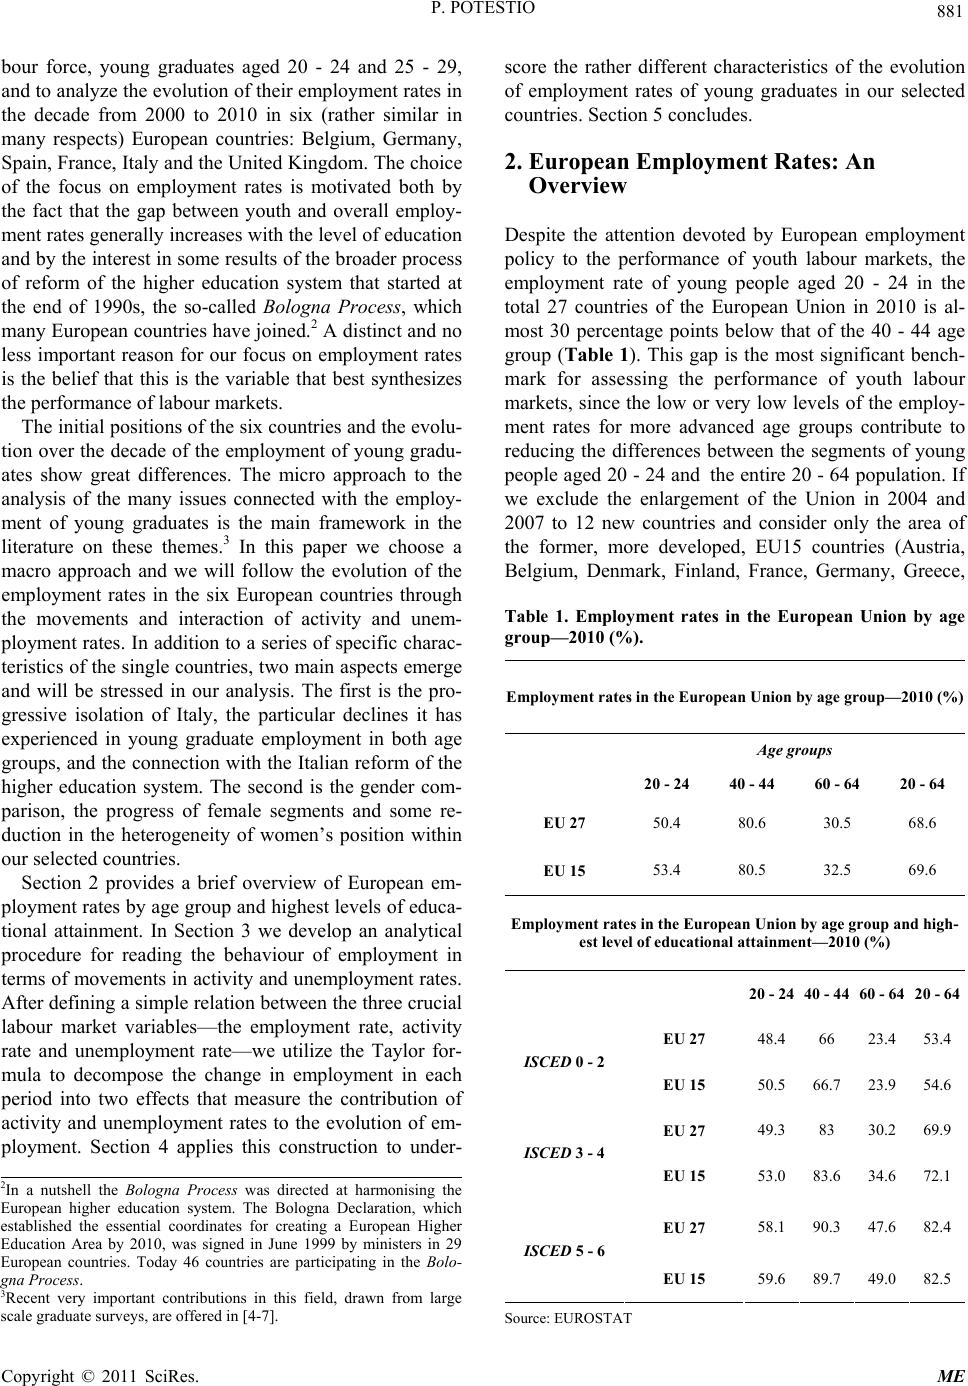 P. POTESTIO 881 bour force, young graduates aged 20 - 24 and 25 - 29, and to analyze the evolution of their employment rates in the decade from 2000 to 2010 in six (rather similar in many respects) European countries: Belgium, Germany, Spain, France, Italy and the United Kingdom. The choice of the focus on employment rates is motivated both by the fact that the gap between youth and overall employ- ment rates generally increases with the level of education and by the interest in some results of the broader process of reform of the higher education system that started at the end of 1990s, the so-called Bologna Process, which many European countries have joined.2 A distinct and no less important reason for our focus on employment rates is the belief that this is the variable that best synthesizes the performance of labour markets. The initial positions of the six countries and the evo lu- tion over the decade of the employment of young gradu- ates show great differences. The micro approach to the analysis of the many issues connected with the employ- ment of young graduates is the main framework in the literature on these themes.3 In this paper we choose a macro approach and we will follow the evolution of the employment rates in the six European countries through the movements and interaction of activity and unem- ployment rates. In addition to a series of specific charac- teristics of the single countries, two main aspects emerge and will be stressed in our analysis. The first is the pro- gressive isolation of Italy, the particular declines it has experienced in young graduate employment in both age groups, and the connection with the Italian reform of the higher education system. The second is the gender com- parison, the progress of female segments and some re- duction in the heterogeneity of women’s position within our selected countries. Section 2 provides a brief overview of European em- ployment rates by age group and highest levels of educa- tional attainment. In Section 3 we develop an analytical procedure for reading the behaviour of employment in terms of movements in activity and unemployment rates. After defining a simple relation between the three crucial labour market variables—the employment rate, activity rate and unemployment rate—we utilize the Taylor for- mula to decompose the change in employment in each period into two effects that measure the contribution of activity and unemployment rates to the evolution of em- ployment. Section 4 applies this construction to under- score the rather different characteristics of the evolution of employment rates of young graduates in our selected countries. Section 5 concludes. 2. European Employment Rates: An Overview Despite the attention devoted by European employment policy to the performance of youth labour markets, the employment rate of young people aged 20 - 24 in the total 27 countries of the European Union in 2010 is al- most 30 percentage points below that of the 40 - 44 age group (Table 1). This gap is the most significant bench- mark for assessing the performance of youth labour markets, since the low or very low levels of the employ- ment rates for more advanced age groups contribute to reducing the differences between the segments of young people aged 20 - 24 and the entire 20 - 64 popu lation. If we exclude the enlargement of the Union in 2004 and 2007 to 12 new countries and consider only the area of the former, more developed, EU15 countries (Austria, Belgium, Denmark, Finland, France, Germany, Greece, Table 1. Employment rates in the European Union by age group—2010 (%). Employment rates in the European Union by age group—2010 (%) Age groups 20 - 24 40 - 44 60 - 64 20 - 64 EU 27 50.4 80.6 30.5 68.6 EU 15 53.4 80.5 32.5 69.6 Employment rates in the European Union by age group and high- est level of educational attainment—2010 (%) 20 - 24 40 - 44 60 - 6420 - 64 EU 27 48.4 66 23.453.4 ISCED 0 - 2 EU 15 50.5 66.7 23.954.6 EU 27 49.3 83 30.269.9 ISCED 3 - 4 EU 15 53.0 83.6 34.672.1 EU 27 58.1 90.3 47.682.4 ISCED 5 - 6 EU 15 59.6 89.7 49.082.5 2In a nutshell the Bologna Process was directed at harmonising the European higher education system. The Bologna Declaration, which established the essential coordinates for creating a European Highe r Education Area by 2010, was signed in June 1999 by ministers in 29 European countries. Today 46 countries are participating in the Bolo- g na Process. 3Recent very important contributions in this field, drawn from large scale graduate surveys, are offered in [4-7]. Source: EUROSTAT Copyright © 2011 SciRes. ME 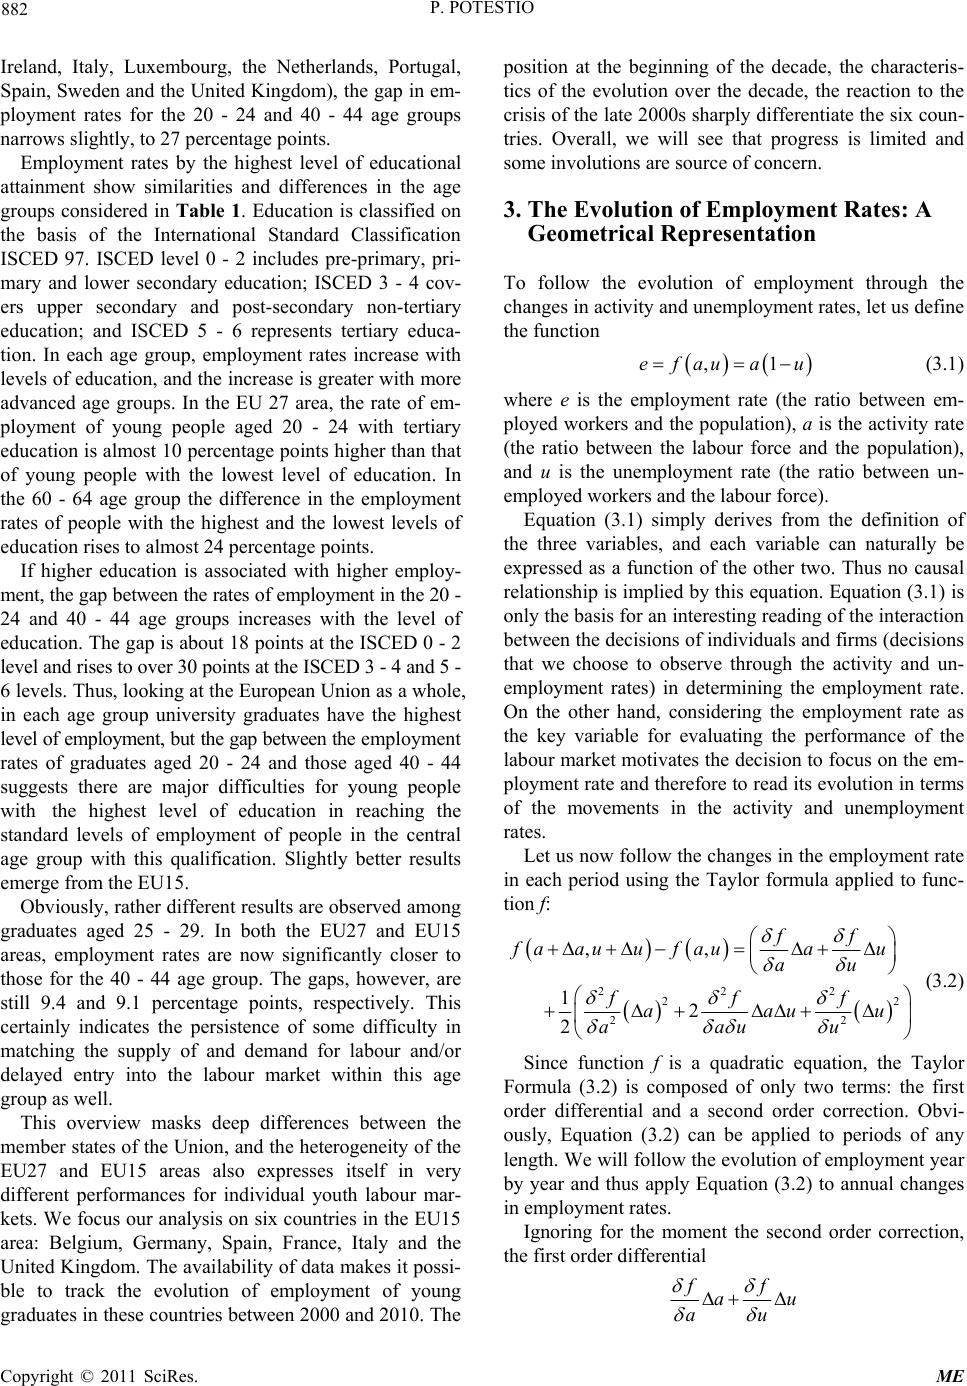 P. POTESTIO 882 Ireland, Italy, Luxembourg, the Netherlands, Portugal, Spain, Sweden and the United Kingdom), the gap in em- ployment rates for the 20 - 24 and 40 - 44 age groups narrows slightly, to 27 percentage points. Employment rates by the highest level of educational attainment show similarities and differences in the age groups considered in Table 1. Education is classified on the basis of the International Standard Classification ISCED 97. ISCED level 0 - 2 includes pre-primary, pri- mary and lower secondary education; ISCED 3 - 4 cov- ers upper secondary and post-secondary non-tertiary education; and ISCED 5 - 6 represents tertiary educa- tion. In each age group, employment rates increase with levels of education, and the increase is greater with more advanced age groups. In the EU 27 area, the rate of em- ployment of young people aged 20 - 24 with tertiary education is almost 10 percentage points higher than that of young people with the lowest level of education. In the 60 - 64 age group the difference in the employment rates of people with the highest and the lowest levels of education rises to almost 24 percentage points. If higher education is associated with higher employ- ment, the gap between the rates of employment in the 20 - 24 and 40 - 44 age groups increases with the level of education. The g ap is about 18 points at the ISCED 0 - 2 level and rises to over 30 points at the ISCED 3 - 4 and 5 - 6 levels. Thus, look ing at the European Union as a whol e, in each age group university graduates have the highest level of employment, but the gap between the e mp lo y me n t rates of graduates aged 20 - 24 and those aged 40 - 44 suggests there are major difficulties for young people with the highest level of education in reaching the standard levels of employment of people in the central age group with this qualification. Slightly better results emerge from the EU15. Obviously, rath er differ ent results are observed among graduates aged 25 - 29. In both the EU27 and EU15 areas, employment rates are now significantly closer to those for the 40 - 44 age group. The gaps, however, are still 9.4 and 9.1 percentage points, respectively. This certainly indicates the persistence of some difficulty in matching the supply of and demand for labour and/or delayed entry into the labour market within this age group as well. This overview masks deep differences between the member states of the Union, an d the heterogeneity of the EU27 and EU15 areas also expresses itself in very different performances for individual youth labour mar- kets. We focus ou r analysis on six countries in the EU15 area: Belgium, Germany, Spain, France, Italy and the United Kingdom. The availability of data makes it possi- ble to track the evolution of employment of young graduates in these coun tries between 2000 an d 2010. The position at the beginning of the decade, the characteris- tics of the evolution over the decade, the reaction to the crisis of the late 2000s sharp ly differentiate the six coun- tries. Overall, we will see that progress is limited and some involutions are source of concern. 3. The Evolution of Employment Rates: A Geometrical Representation To follow the evolution of employment through the changes in activity and unemployment rates, let us define the function ,1efau au (3.1) where e is the employment rate (the ratio between em- ployed workers and the populatio n), a is the activity rate (the ratio between the labour force and the population), and u is the unemployment rate (the ratio between un- employed workers and the labour force). Equation (3.1) simply derives from the definition of the three variables, and each variable can naturally be expressed as a function of the other two. Thus no causal relationship is implied by this equation. Equation (3.1) is only the basis for an in teresting read ing of the interaction between the decisions of individuals and firms (decisions that we choose to observe through the activity and un- employment rates) in determining the employment rate. On the other hand, considering the employment rate as the key variable for evaluating the performance of the labour market motivates the decision to focus on the em- ployment rate and therefore to read its evolution in terms of the movements in the activity and unemployment rates. Let us now follow the ch anges in the employment rate in each period using the Taylor formula applied to func- tion f: 222 22 22 ,, 1 2 2 ff f aauuf auau au fff aau au au u (3.2) Since function f is a quadratic equation, the Taylor Formula (3.2) is composed of only two terms: the first order differential and a second order correction. Obvi- ously, Equation (3.2) can be applied to periods of any length. We will follow the evolution of employment year by year and thus apply Equation (3.2) to annual changes in employment rates. Ignoring for the moment the second order correction, the first order differential ff au au Copyright © 2011 SciRes. ME  P. POTESTIO 883 gives the contribution of the movements in activity and unemployment rates to the evolution of employment in each period. The weights attached to these movements, f a and f u , are given by the components of the gradient of the function f, i.e. the partial derivative of function f with respect to a and u: 1 fu a , fa u (3.3) The change in the employment rate in each period t can thus be decomposed into the change in the activity rate in period t, weighted by the quota of employed workers in the labour force in the period t – 1, plus the change in the unemployment rate in period t, weighted by the (negative of the) activity rate in period t – 1: 1 1 1 tt ttt t eeeuaa u 1t (3.4) Equation (3.4) therefore provides a reading of the evolution of employment through the interaction be- tween the activity and unemployment rates. Since the extent to which a rise in the activity rate translates into a rise in employment is given by the quota of the em- ployed in the labour force, the lower the unemployment rate, the greater the effect on employment of the change in the activity rate. We define the component 1 f aa ua as the “activity rate effect” on employment. The effect gives the con tribution of th e activity rate to the change in employment. Symmetrically, the extent to which a decrease in the unemployment rate translates into a rise in employment is given by the quota of active people in the population. The higher this quota, the greater the effect on employ- ment of a decrease in the unemployment rate. We define the component f uuau as the “unemploy- ment rate effect”, which gives the contribution of the unemployment rate to the change in employment. As to the second order correction, given Equation (3.1), we have: 222 2 22 12 2 fff aauu au au 2 au (3.5) It seems appropriate to read the second order correc- tion as a residuum, that expresses a direct interaction of the movements of the two variables, the activity and unemployment rates, in affecting the change in employ- ment. The lower the turbulence within each period, i.e. the smaller the changes a and u, the smaller the residuum. A final point. The length of the gradient vector is ob- viously likely to differ in each period. This makes it im- possible to have a visible comparison of the weights f a and f u between periods. To geometri- cally compare the weights and to follow their evolution over time, let us refer to the normalized gradient 22 f a f f au , 22 f u f f au (3.6) where 22 f f au is the norm of the gradient. The vector in 3.6 (which we will indicate with v) is a unit vector in the same direction of the gradient. The proper- ties of v put vector 3.6 in a circle whose centre is the origin of the axes and radiu s 1. The chan ging position of the v vector in the fourth quadrant indicates how the weights evolve over time. Rotation of the vector towards the x-axis, which measures the normalized weight f a , implies that f a increases relative to f u . The opposite holds if the vector rotates towards the y- axis, which measures the normalized weight f u . 4. Employment Rates of Young Graduates: A Comparison between Six European Countries 4.1. Graduates Aged 20 - 24 Deep differences characterize the level and evolution of the employment rates of young graduates aged 20 - 24 in the six countries covered by our analysis4. In 2000 graduates aged 20 - 24 exhibit employment rates of around 80% in Belgium, Germany and the UK, and rates just above 45% in Sp ain, France, and Italy (Table 2). A t the end of decade Italy remains totally isolated in the collapse in its employment rate. The differences between the other countries appear to have narrowed, and France and, to a lesser extent, Spain record some progress com- pared with 2000 levels. As to the paths followed in the decade (Figure 1), rapid growth is sharply interrupted in Spain in the late 2000s, while in France a significant de- crease is observed only in 2010. Relative stability char- acterizes Germany and, until 2007, the United Kingdom. Italy and Belgium exhibit the greatest reductions in un- employment rates. In particular a real collapse occurs in Italy around the middle of the decade. Gender differences deserve special attention. In 2000 the female employment rate was lower than the male rate 4The source of data for our comparisons is Eurostat, EU Labour Force Survey. Until 2004, the data refer to the second quarter, while since 2005 the data are annual averages. Copyright © 2011 SciRes. ME  P. POTESTIO 884 Table 2. Employment rates of graduates aged 20 - 24. M + F M F 2000 2010 2000 2010 20002010 Belgium 80.8 54.2 75.9 51.8 83.7 55.7 Germany 80.1 77.0 Spain 45.6 46.6 49.4 43.6 42.8 48.4 France 46.1 52.9 43.4 52.6 48.0 53.1 Italy 49.3 25.3 47.9 21.7 50.2 27.4 UK 83.0 73.1 82.1 71.7 84.0 74.2 only in Spain. In 2010 , female rates are higher than male rates in all countries. These data ap pear all the more rele- vant when one considers that in 2010 the number of fe- male graduates in each of the six countries is signify- cantly larger than the number of male graduates.5 Hav- ing noted this, in Spain the rapid growth of female em- ployment more than compensates for the drastic fall in the male rate in the final years of the 2000s. The opposite pattern is observed in France, where male employment growth does not seem to be affected by the crisis. Among female graduates, moreover, the impact of the crisis in France is observed only in 2010. Finally, in Italy, the rate of employment falls drastically in both gender segments. What contribution do the activity and unemployment rate effects make to the movements in employment and how has the interaction between activity and unemploy- ment rates worked over the decade? Table 3 decomposes the changes in each year of employment rates for each gender into the activity and unemployment rate effects and the second order corrections. Table 4 sums the two effects and the second order corrections in each year for the period 2000-2007, that is before the impact of the crisis, and for the period 2008-2010, after the impact of the crisis. In both tables, all the changes, effects and weights are expressed in percentage points. One aspect is common to all countries: the extent to which a change in the activity rate translates into a change in the employment rate is generally higher than the extent to which a change in the unemployment rate translates into a change in the employment rate. The quota of employed in the labour force is generally higher than the quota of the active people in the population, thus the activity rate effect is generally stronger than the un- employment rate effect. That said, the strength of the two effects remains quite different among the countries. Be- fore examining the specific characteristics of each coun- try, it is worth returning to the Equation (3.4) for a nu m- ber of considerations. The reading of the changes in employment through Equation (3.4) makes two simple facts very clear. The impact on employment of a reduction in the unemploy- ment rate u depends on the participation rate a. Only if the latter were equal to unity would a reduction in u be accompanied by an equal increase in e, whereas low or very low participation rates constitute a rigid constraint for the contribution that a decrease in unemployment can make to increasing employment. In these circumstances, even a hypothetical zero unemployment rate would not significantly increase the employment rate. This second scenario is definitely closer to what we observe in some of the countries examined, and poses special problems for policy. On the other hand, an increase in particip ation in itself does not increase employment. But (assuming a constant population), if an increase in participation is accompanied by an increase in employment, the rate of employment increases even if the rate of unemployment rises. This implies 1uaau i.e. that the activity rate effect is greater than the unemployment rate effect. This is an important fact: a rise in participation can increase the employment rate even if the unemployment rate rises, a fact that empha- sizes the stimulus that an increase in participation, and therefore in the labour supply, exerts on employment. Processes of this kind are observed in France. Turning to the specific characteristics of the evolution of employment in individual countries, let us start with the country that shows the greatest stability, namely Germany.6 Overall, the limited reduction in the employ- ment rate over the decade (–3.1 percentage points) is linked to a negative activity rate effect. The negative unemployment rate effect in the years 2008-2010 is rather small and almost cancels out the limited positive effect over the previous period. The ratio between the weights (1 – u) and a remains almost constant (around 1.08) and the vector of the normalized weights, v, shows minimal movements (the normalized weights were 0.74 - 0.68 in 2000 and ar e 0.74 - 0.67 in 2010). Until 2007, the evolution of male employment in United Kingdom is rather similar to what we have ob- served in Germany. Employment decreases somewhat in these years, due to a negative activity rate effect. But, unlike Germany, the impact of the crisis is strong in United Kingdom and gives rise to a sharply negative nemployment rate effect in 2008-2009. Male participa- u 6For Germany the available data do not allow gender disaggregation in the 20 - 24 age group. Caution in considering the overalldata is also advisable. 5In 2010, among the graduates aged 20 - 24, the gender ratio [8] is 1.8 in Italy, 1.6 in Spain, 1.5 in Belgium, 1.3 in France and 1.2 in the UK. Copyright © 2011 SciRes. ME 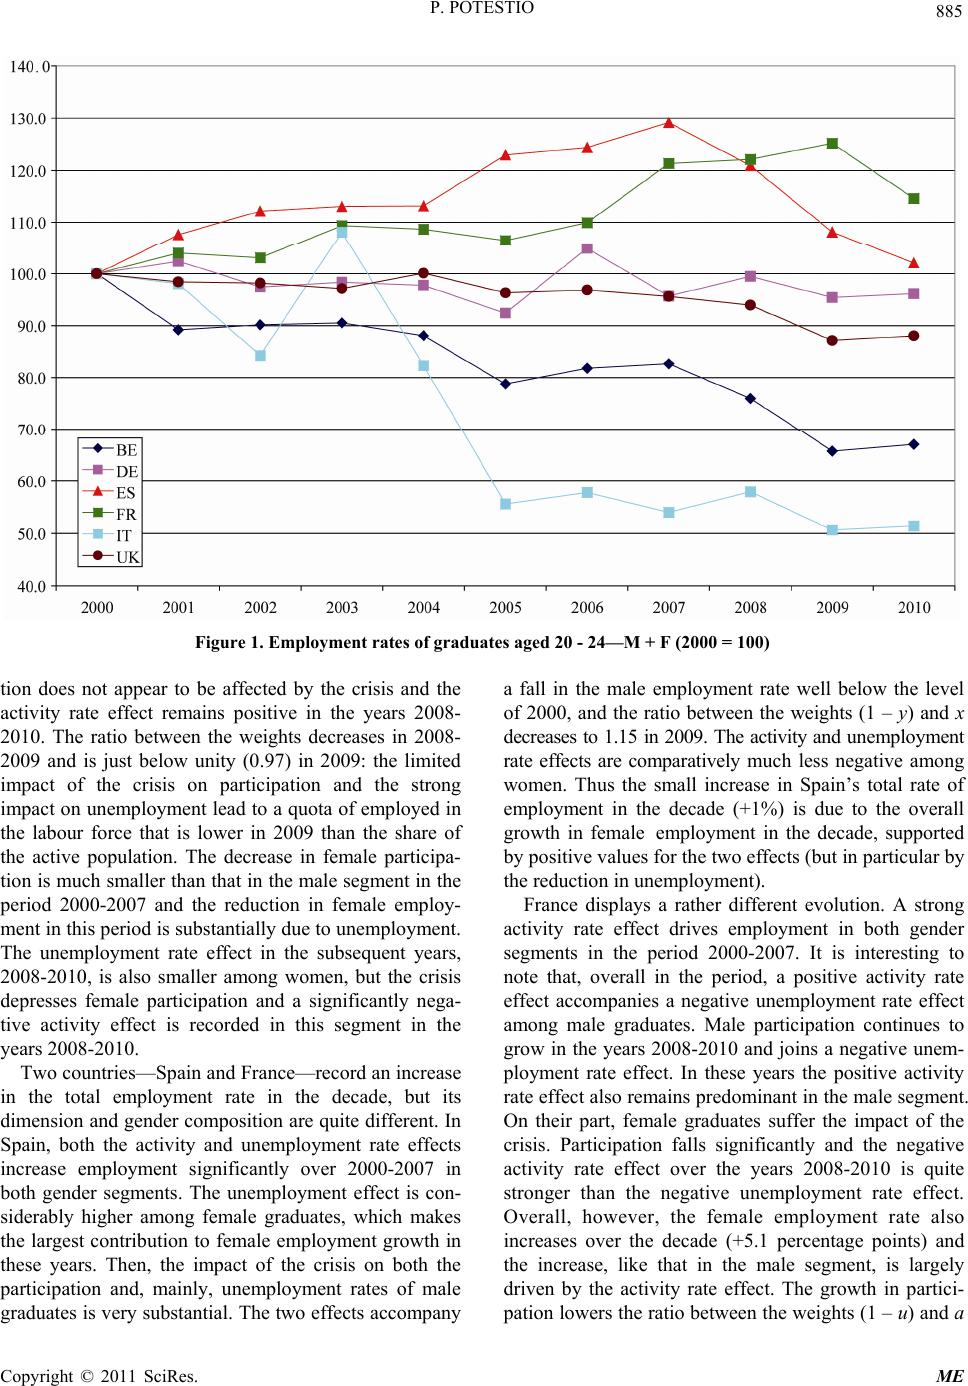 P. POTESTIO Copyright © 2011 SciRes. ME 885 Figure 1. Employment rates of graduates aged 20 - 24—M + F (2000 = 100) tion does not appear to be affected by the crisis and the activity rate effect remains positive in the years 2008- 2010. The ratio between the weights decreases in 2008- 2009 and is just below unity (0.97) in 2009: the limited impact of the crisis on participation and the strong impact on unemployment lead to a quota of employed in the labour force that is lower in 2009 than the share of the active population. The decrease in female participa- tion is much smaller than th at in the male segment in the period 2000-2007 and the reduction in female employ- ment in this period is sub stantially du e to une mployment. The unemployment rate effect in the subsequent years, 2008-2010, is also smaller among women, but the crisis depresses female participation and a significantly nega- tive activity effect is recorded in this segment in the years 2008-2010. Two countries—Spain and France—record an increase in the total employment rate in the decade, but its dimension and gender composition are quite different. In Spain, both the activity and unemployment rate effects increase employment significantly over 2000-2007 in both gender segments. The unemployment effect is con- siderably higher among female graduates, which makes the largest contribution to female employment growth in these years. Then, the impact of the crisis on both the participation and, mainly, unemployment rates of male graduates is very substantial. The two effects accompany a fall in the male employment rate well below the level of 2000, and the ratio between the weights (1 – y) and x decreases to 1.15 in 2009. The activity and unemplo yment rate effects are comparatively much less negative among women. Thus the small increase in Spain’s total rate of employment in the decade (+1%) is due to the overall growth in female employment in the decade, supported by positive v a lues for the two effects (but in particular by the reduction in une mplo yment). France displays a rather different evolution. A strong activity rate effect drives employment in both gender segments in the period 2000-2007. It is interesting to note that, overall in the period, a positive activity rate effect accompanies a negative unemployment rate effect among male graduates. Male participation continues to grow in the years 2008-2010 and joins a negative unem- ployment rate effect. In these years the positive activity rate effect also remains predominant in the male seg ment. On their part, female graduates suffer the impact of the crisis. Participation falls significantly and the negative activity rate effect over the years 2008-2010 is quite stronger than the negative unemployment rate effect. Overall, however, the female employment rate also increases over the decade (+5.1 percentage points) and the increase, like that in the male segment, is largely driven by the activity rate effect. The growth in partici- ation lowers the ratio between the weights (1 – u) and a p 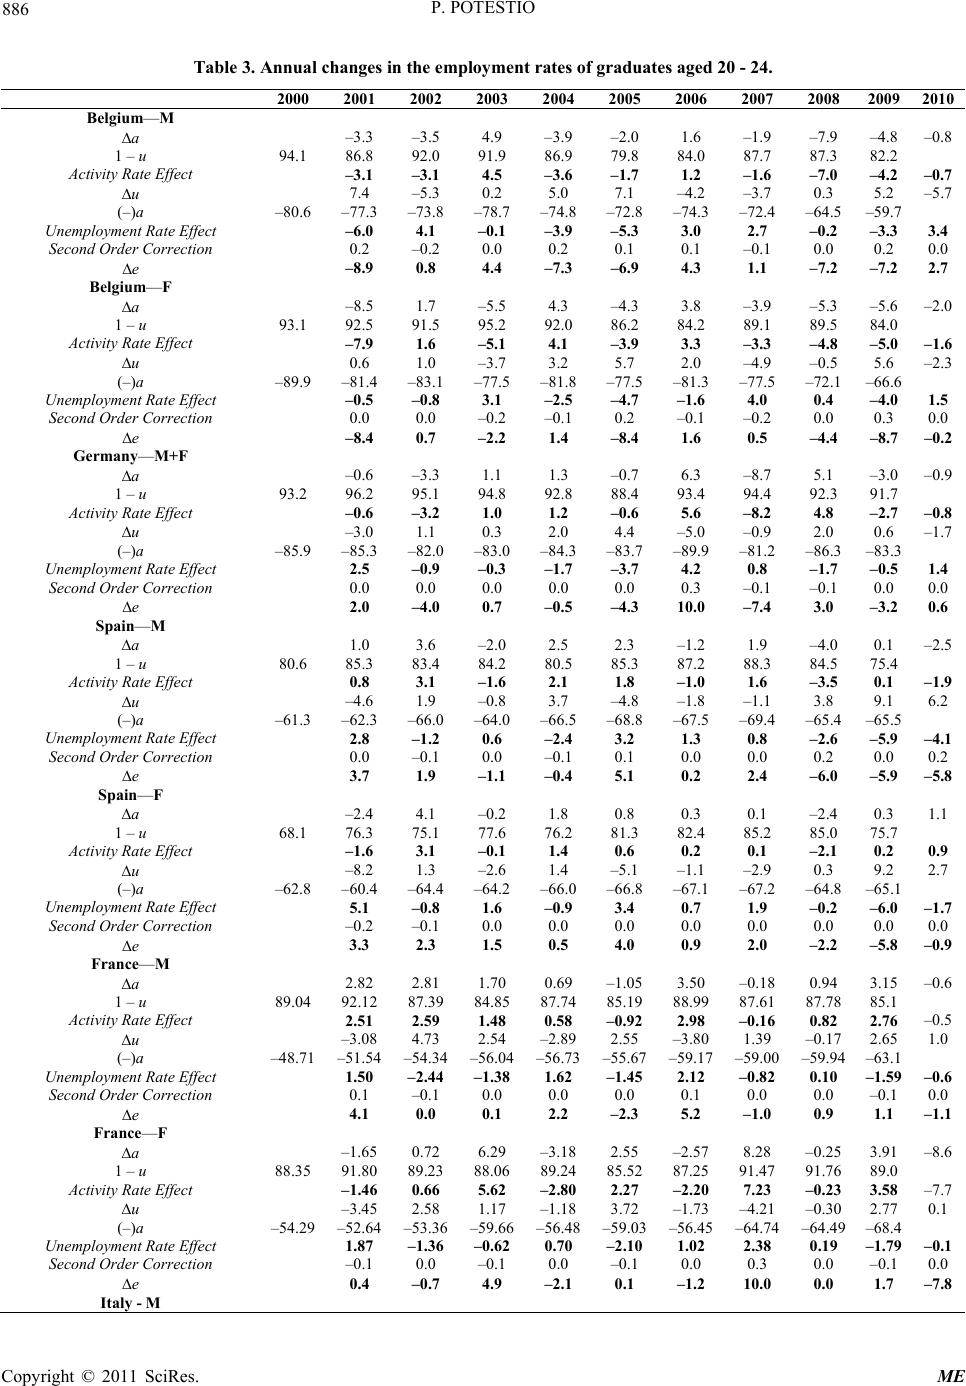 P. POTESTIO 886 Table 3. Annual changes in the employment rates of graduates aged 20 - 24. 2000 2001 2002 2003 2004 2005 2006 2007 2008 20092010 Belgium—M a –3.3 –3.5 4.9 –3.9 –2.0 1.6 –1.9 –7.9 –4.8–0.8 1 – u 94.1 86.8 92.0 91.9 86.9 79.8 84.0 87.7 87.3 82.2 Activity Rate Effect –3.1 –3.1 4.5 –3.6 –1.7 1.2 –1.6 –7.0 –4.2–0.7 u 7.4 –5.3 0.2 5.0 7.1 –4.2 –3.7 0.3 5.2 –5.7 (–)a –80.6 –77.3 –73.8–78.7–74.8–72.8–74.3–72.4 –64.5 –59.7 Unemployment Rate Effect –6.0 4.1 –0.1 –3.9 –5.3 3.0 2.7 –0.2 –3.33.4 Second Order Correction 0.2 –0.2 0.0 0.2 0.1 0.1 –0.1 0.0 0.2 0.0 e –8.9 0.8 4.4 –7.3 –6.9 4.3 1.1 –7.2 –7.22.7 Belgium—F a –8.5 1.7 –5.5 4.3 –4.3 3.8 –3.9 –5.3 –5.6–2.0 1 – u 93.1 92.5 91.5 95.2 92.0 86.2 84.2 89.1 89.5 84.0 Activity Rate Effect –7.9 1.6 –5.1 4.1 –3.9 3.3 –3.3 –4.8 –5.0–1.6 u 0.6 1.0 –3.7 3.2 5.7 2.0 –4.9 –0.5 5.6 –2.3 (–)a –89.9 –81.4 –83.1–77.5–81.8–77.5–81.3–77.5 –72.1 –66.6 Unemployment Rate Effect –0.5 –0.8 3.1 –2.5 –4.7 –1.6 4.0 0.4 –4.01.5 Second Order Correction 0.0 0.0 –0.2 –0.1 0.2 –0.1 –0.2 0.0 0.3 0.0 e –8.4 0.7 –2.2 1.4 –8.4 1.6 0.5 –4.4 –8.7–0.2 Germany—M+F a –0.6 –3.3 1.1 1.3 –0.7 6.3 –8.7 5.1 –3.0–0.9 1 – u 93.2 96.2 95.1 94.8 92.8 88.4 93.4 94.4 92.3 91.7 Activity Rate Effect –0.6 –3.2 1.0 1.2 –0.6 5.6 –8.2 4.8 –2.7–0.8 u –3.0 1.1 0.3 2.0 4.4 –5.0 –0.9 2.0 0.6 –1.7 (–)a –85.9 –85.3 –82.0–83.0–84.3–83.7–89.9–81.2 –86.3 –83.3 Unemployment Rate Effect 2.5 –0.9 –0.3 –1.7 –3.7 4.2 0.8 –1.7 –0.51.4 Second Order Correction 0.0 0.0 0.0 0.0 0.0 0.3 –0.1 –0.1 0.0 0.0 e 2.0 –4.0 0.7 –0.5 –4.3 10.0 –7.4 3.0 –3.20.6 Spain—M a 1.0 3.6 –2.0 2.5 2.3 –1.2 1.9 –4.0 0.1 –2.5 1 – u 80.6 85.3 83.4 84.2 80.5 85.3 87.2 88.3 84.5 75.4 Activity Rate Effect 0.8 3.1 –1.6 2.1 1.8 –1.0 1.6 –3.5 0.1 –1.9 u –4.6 1.9 –0.8 3.7 –4.8 –1.8 –1.1 3.8 9.1 6.2 (–)a –61.3 –62.3 –66.0–64.0–66.5–68.8–67.5–69.4 –65.4 –65.5 Unemployment Rate Effect 2.8 –1.2 0.6 –2.4 3.2 1.3 0.8 –2.6 –5.9–4.1 Second Order Correction 0.0 –0.1 0.0 –0.1 0.1 0.0 0.0 0.2 0.0 0.2 e 3.7 1.9 –1.1 –0.4 5.1 0.2 2.4 –6.0 –5.9–5.8 Spain—F a –2.4 4.1 –0.2 1.8 0.8 0.3 0.1 –2.4 0.3 1.1 1 – u 68.1 76.3 75.1 77.6 76.2 81.3 82.4 85.2 85.0 75.7 Activity Rate Effect –1.6 3.1 –0.1 1.4 0.6 0.2 0.1 –2.1 0.2 0.9 u –8.2 1.3 –2.6 1.4 –5.1 –1.1 –2.9 0.3 9.2 2.7 (–)a –62.8 –60.4 –64.4–64.2–66.0–66.8–67.1–67.2 –64.8 –65.1 Unemployment Rate Effect 5.1 –0.8 1.6 –0.9 3.4 0.7 1.9 –0.2 –6.0–1.7 Second Order Correction –0.2 –0.1 0.0 0.0 0.0 0.0 0.0 0.0 0.0 0.0 e 3.3 2.3 1.5 0.5 4.0 0.9 2.0 –2.2 –5.8–0.9 France—M a 2.82 2.81 1.70 0.69 –1.053.50 –0.18 0.94 3.15–0.6 1 – u 89.04 92.12 87.3984.8587.7485.1988.9987.61 87.78 85.1 Activity Rate Effect 2.51 2.59 1.48 0.58 –0.92 2.98 –0.16 0.82 2.76–0.5 u –3.08 4.73 2.54 –2.892.55 –3.801.39 –0.17 2.651.0 (–)a –48.71 –51.54–54.34–56.04–56.73–55.67–59.17–59.00 –59.94 –63.1 Unemployment Rate Effect 1.50 –2.44–1.38 1.62 –1.452.12 –0.82 0.10 –1.59–0.6 Second Order Correction 0.1 –0.1 0.0 0.0 0.0 0.1 0.0 0.0 –0.10.0 e 4.1 0.0 0.1 2.2 –2.3 5.2 –1.0 0.9 1.1 –1.1 France—F a –1.65 0.72 6.29 –3.182.55 –2.578.28 –0.25 3.91–8.6 1 – u 88.35 91.80 89.2388.0689.2485.5287.2591.47 91.76 89.0 Activity Rate Effect –1.46 0.66 5.62 –2.802.27 –2.207.23 –0.23 3.58–7.7 u –3.45 2.58 1.17 –1.183.72 –1.73–4.21 –0.30 2.770.1 (–)a –54.29 –52.64–53.36–59.66–56.48–59.03–56.45–64.74 –64.49 –68.4 Unemployment Rate Effect 1.87 –1.36–0.620.70 –2.101.02 2.38 0.19 –1.79–0.1 Second Order Correction –0.1 0.0 –0.1 0.0 –0.1 0.0 0.3 0.0 –0.10.0 e 0.4 –0.7 4.9 –2.1 0.1 –1.2 10.0 0.0 1.7 –7.8 Italy - M Copyright © 2011 SciRes. ME 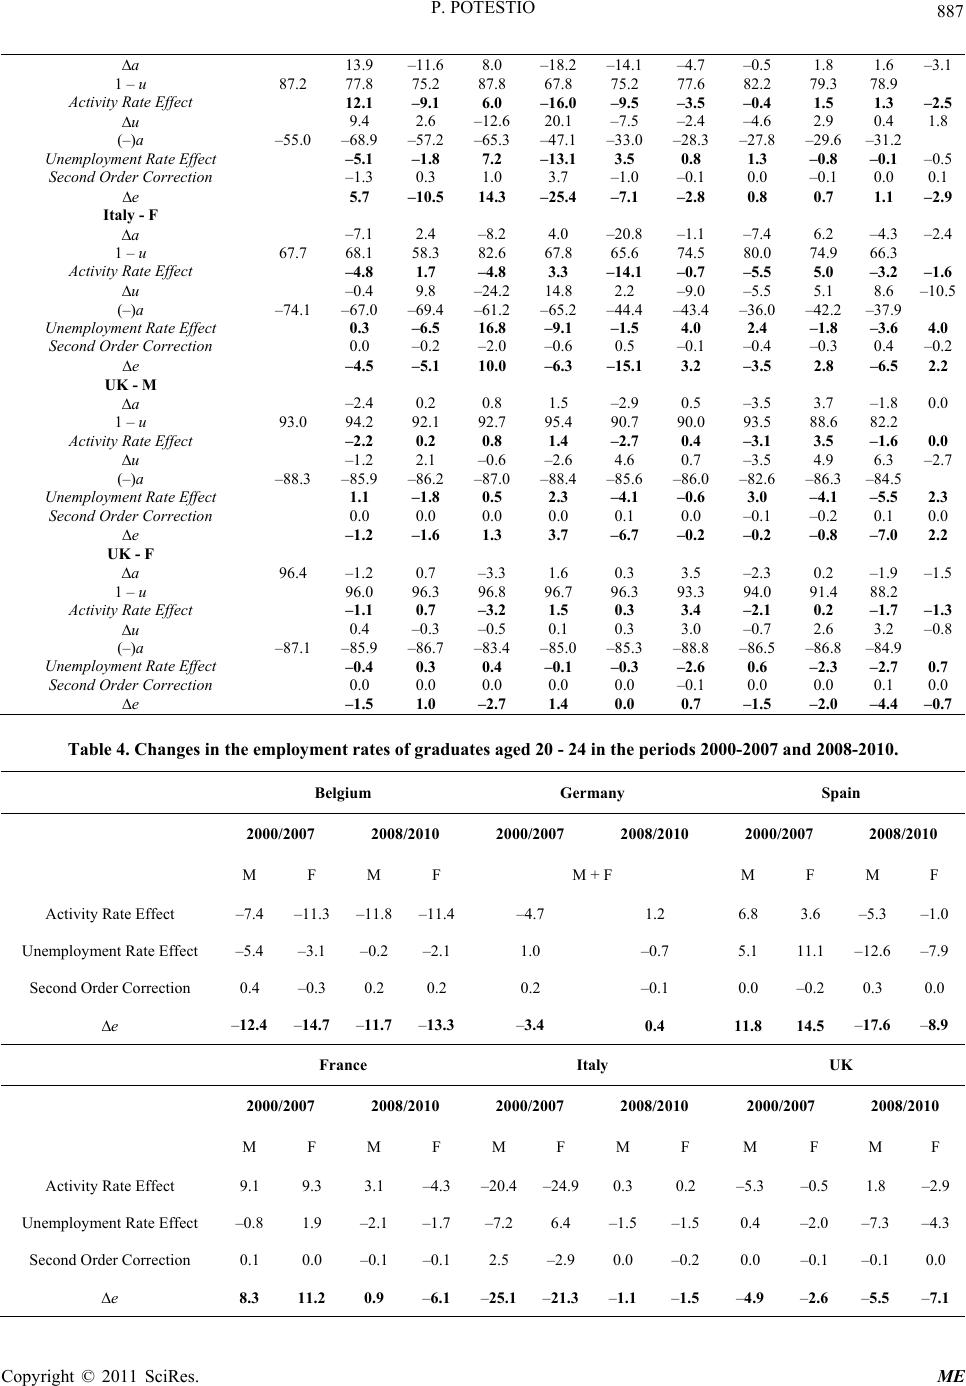 P. POTESTIO 887 a 13.9 –11.68.0 –18.2–14.1–4.7 –0.5 1.8 1.6 –3.1 1 – u 87.2 77.8 75.2 87.8 67.8 75.2 77.6 82.2 79.3 78.9 Activity Rate Effect 12.1 –9.1 6.0 –16.0–9.5 –3.5 –0.4 1.5 1.3 –2.5 u 9.4 2.6 –12.620.1 –7.5 –2.4 –4.6 2.9 0.4 1.8 (–)a –55.0 –68.9 –57.2–65.3–47.1–33.0–28.3–27.8 –29.6 –31.2 Unemployment Rate Effect –5.1 –1.8 7.2 –13.13.5 0.8 1.3 –0.8 –0.1–0.5 Second Order Correction –1.3 0.3 1.0 3.7 –1.0 –0.1 0.0 –0.1 0.0 0.1 e 5.7 –10.514.3 –25.4–7.1 –2.8 0.8 0.7 1.1 –2.9 Italy - F a –7.1 2.4 –8.2 4.0 –20.8–1.1 –7.4 6.2 –4.3–2.4 1 – u 67.7 68.1 58.3 82.6 67.8 65.6 74.5 80.0 74.9 66.3 Activity Rate Effect –4.8 1.7 –4.8 3.3 –14.1–0.7 –5.5 5.0 –3.2–1.6 u –0.4 9.8 –24.214.8 2.2 –9.0 –5.5 5.1 8.6 –10.5 (–)a –74.1 –67.0 –69.4–61.2–65.2–44.4–43.4–36.0 –42.2 –37.9 Unemployment Rate Effect 0.3 –6.5 16.8 –9.1 –1.5 4.0 2.4 –1.8 –3.64.0 Second Order Correction 0.0 –0.2 –2.0 –0.6 0.5 –0.1 –0.4 –0.3 0.4 –0.2 e –4.5 –5.1 10.0 –6.3 –15.13.2 –3.5 2.8 –6.52.2 UK - M a –2.4 0.2 0.8 1.5 –2.9 0.5 –3.5 3.7 –1.80.0 1 – u 93.0 94.2 92.1 92.7 95.4 90.7 90.0 93.5 88.6 82.2 Activity Rate Effect –2.2 0.2 0.8 1.4 –2.7 0.4 –3.1 3.5 –1.60.0 u –1.2 2.1 –0.6 –2.6 4.6 0.7 –3.5 4.9 6.3 –2.7 (–)a –88.3 –85.9 –86.2–87.0–88.4–85.6–86.0–82.6 –86.3 –84.5 Unemployment Rate Effect 1.1 –1.8 0.5 2.3 –4.1 –0.6 3.0 –4.1 –5.52.3 Second Order Correction 0.0 0.0 0.0 0.0 0.1 0.0 –0.1 –0.2 0.1 0.0 e –1.2 –1.6 1.3 3.7 –6.7 –0.2 –0.2 –0.8 –7.02.2 UK - F a 96.4 –1.2 0.7 –3.3 1.6 0.3 3.5 –2.3 0.2 –1.9–1.5 1 – u 96.0 96.3 96.8 96.7 96.3 93.3 94.0 91.4 88.2 Activity Rate Effect –1.1 0.7 –3.2 1.5 0.3 3.4 –2.1 0.2 –1.7–1.3 u 0.4 –0.3 –0.5 0.1 0.3 3.0 –0.7 2.6 3.2 –0.8 (–)a –87.1 –85.9 –86.7–83.4–85.0–85.3–88.8–86.5 –86.8 –84.9 Unemployment Rate Effect –0.4 0.3 0.4 –0.1 –0.3 –2.6 0.6 –2.3 –2.70.7 Second Order Correction 0.0 0.0 0.0 0.0 0.0 –0.1 0.0 0.0 0.1 0.0 e –1.5 1.0 –2.7 1.4 0.0 0.7 –1.5 –2.0 –4.4–0.7 Table 4. Changes in the employment rates of graduates aged 20 - 24 in the periods 2000-2007 and 2008-2010. Belgium Germany Spain 2000/2007 2008/2010 2000/2007 2008/2010 2000/2007 2008/2010 M F M F M + F M F M F Activity Rate Effect –7.4 –11.3 –11.8–11.4–4.7 1.2 6.8 3.6 –5.3 –1.0 Unemployment Rate Effect –5.4 –3.1 –0.2 –2.1 1.0 –0.7 5.1 1 1.1 –12.6–7.9 Second Order Correction 0.4 –0.3 0.2 0.2 0.2 –0.1 0.0 –0.2 0.3 0.0 e –12.4 –14.7 –11.7 –13.3 –3.4 0.4 11.8 14.5 –17.6–8.9 France Italy UK 2000/2007 2008/2010 2000/2007 2008/2010 2000/2007 2008/2010 M F M F M F M F M F M F Activity Rate Effect 9.1 9.3 3.1 –4.3 –20. 4–24.90.3 0.2 –5.3 –0.5 1.8 –2.9 Unemployment Rate Effect –0.8 1.9 –2.1 –1.7 –7.2 6.4 –1.5 –1.5 0.4 –2.0 –7.3 –4.3 Second Order Correction 0.1 0.0 –0.1 –0.1 2.5 –2.9 0.0 –0.2 0.0 –0.1 –0.1 0.0 e 8.3 11.2 0.9 –6.1 –25.1 –21.3–1.1 –1.5 –4.9 –2.6 –5.5 –7.1 Copyright © 2011 SciRes. ME  P. POTESTIO Copyright © 2011 SciRes. ME 888 in both gender segments, and the vector v moves towards the x-axis. It is worth emphasizing that the increases in participation strengthen the unemployment rate effect over the decade. French graduates make the greatest progress in mat- ching supply and demand in the young graduate labour markets. In particular, as regards the male segment, the growth in the number of graduates (+20% over the decade)7, the growth in the activity rate and absorption by the demand side have formed a rather virtuous circle. The educational system and the requirements of the demand side appear to be successfully integrated in the decade.8 By contrast, Belgium is characterised by a continuous decline in participation, with a strong accentuation in the years 2008-2010, for both gender segments. The negative activity rate effect is dominant throughout the decade. However, the unemployment rate effect also contributes significantly to th e decline in the employment rate in the period 2000-2007, while this effect shows lower values in the years 2008-2010. This evolution results in an increasing ratio in both gender segments between the weights (1 – u) and a. The vector v moves towards the y- axis and the decline in participation considerably weak- ens the unemployment rate effect. The particularly ne- gative value of both the effects over the two periods in- dicates a serious deterioration in the performance of the labour market for young graduates in Belgium. An even more particular picture emerges in Italy. Par- ticipation collapses in the mid-2000s in both gender segments. The negative activity rate effect even exceeds 20 percentage points in the years 2000-2007. Conversely, the unemployment rate effect is substantiall y different in the gender segments in this period: it is quite negativ e for male graduates and quite positive for female graduates. The impact of the crisis results in a moderately negative unemployment rate effect (–1.5 points in both gender segments in the years 2008-2010) and a further reduction of participation in 2009-2010. The fall in participation drastically increases the ratio between th e weig hts, wh ich was already comparatively higher in the male segment in 2000 (1.59). In 2009 the ratio between (1 – u) and a reaches 1.75 and 2.53 in the female and male segments, respectively. The vector v moves considerably towards the y-axis: in the male segment the normalized weights were 0.85 - 0.53 in 2000 and were 0.93 - 0.37 in 2009. Naturally, the collapse in participation weakens the un- employment rate effect. At the end of the decade, unem- ployment is over 20 percent in both gender segments, but even if the unemployment rate were to fall to zero, while the activity rate remained constant at the 2010 level, the male employment rate would increase by only 6.4 percentage points and would reach just 28%! The weakness of Italian performance at the start of 2000s worsens so much as to place Italy in a totally isolated position among the European countries.9 The main cause of the collapse in participation, which is in turn the main cause of the decline in the employment rate, has to be connected to the reform of the higher education system approved in Italy at the end of the 1990s. In a peculiar interpretation of the Bologn a process, th e reform introduced two degree levels.10 The new programmes, introduced with the so-called 3 + 2 reform, are composed of two cycles: a three-year first-level degree, called the Laurea Triennale, and a two-year second-level degree, called the Laurea Magistrale. Achieving a first-level degree is required for enrolment in the second-level. From a purely quantitative standpoint, th e sharp increase over the decade in the number of graduates aged 20 - 24 and the significant increase in the number of students who have finished tertiary education are positive results of the reform.11 But the reform has seriously failed (at least so far) to accelerate the entry of young graduates into the labour market. The first-level degrees aimed at shortening university courses for a vast majority of stu- dents have failed to achieve this acceleration. The current, massive enrolment of first-level graduates in second level university courses has de facto undermined this acceleration. To a large extent, the effect of the reform has been to lengthen degree courses (replacing the pre- vious four-year degree courses with the new 3 + 2 pro- 9The very special features of the Italian evolution in the employment o f young graduates are widely analyzed in Potestio (2 011) [10]. 10A system “based on two main cycles” was the European target in the Bologna Declaration. “Access to the second cycle—it was stated— shall require successful completion of first cycle studies, lasting a minimum of three years.The second cycle should lead to the master and/or doctorate degree as in many European countries”. A b aroque structure, rather far fro m that designed in the Bologna Declaration, has been adopted in Italy. This structure is composed by two degree levels, two master levels, each following the related degree level, and a third level, the doctorate. 11These results make Italy’s position a little less distant from the other five countries. Consider that in 2000, in the 20 - 24 age group, the number of graduates in Italy was about half that in the smaller Belgium and that in 2010 male graduates are still less than half the number in France and the UK, while female graduates are just over half. The very different position of Italy (for example, within the OECD countries) in the ranking by per capita income and in the ranking by the proportion of graduates in the population is unfortunately a question to which no p articular attention has been devoted by scholars. Today, however, a more urgent question is the possibility for Italy to achieve sustained growth in the future without more efficient university courses than those realized under the 3 + 2 reform. 7The increase in the number of female graduates is much smaller at +3%. France and Belgium are the only countries in which the gende r ratio decreases slightly in the decade (from 1.7 in 2000 to 1.5 in 2010 in Belgium and from 1.5 in 2000 to 1.3 in 2010 in France). 8The complex French higher education system, the original interpreta- tion of the Bologna Process, the strengthening of vocational pro- grammes and the success of this orientation are well documented and analyzed in [9].  P. POTESTIO 889 grammes), and thus to delay further the entry of young Italian graduates into the labour market. No single conclusion can be drawn from the compari- son between the six countries. A wide range of processes emerges in the decade. A certain decrease in the employ- ment rate in Germany and United Kingdom, due to the reduction in participation and occurred before the impact of the crisis, has contributed to reducing a few differences. The progress of the male segment in France and the fe- male segments in Spain and France are the most impor- tant gender aspects. As regards the relative importance of the two factors—participation and unemployment—the former has a major role in the observed processes. The activity rate effect supports the growth in employment rates in France and strongly depresses employment in Belgium and Italy. But this major role is not uniform. In Spain the unemployment rate effect appears dominant, both during growth and recession. The impact of and the reaction to the crisis also appear diversif ied. Spain, U n i t e d Kingdom and Belgium suffer the impact of the crisis the most. Moreover, the reduction in participation, following or joining an increase in unemploy ment, is an interesting aspect that considerably differentiates countries and gen- ders. Overall, the severity of the unemployment problem grows worse at the end of the decade, mainly among male graduates. Quite ap art from the effects of the crisis, the progress in participation is rather limited, and de- layed entry into the labour market remains a wide- spread problem. In Italy the problem is by now quite serious. 4.2. Graduates Aged 25 - 29 Turbulence in labour markets is much lower within the 25 - 29 age group. Employment rates are obviously higher (Table 5), fluctuations in activity and unemploy- ment rates are much smaller, even under the impact of the crisis, and the differences between countries are more limited. In 2000 France is in an intermediate position Table. 5 Employment rates of graduates aged 25 - 29. M + F M F 2000 20102000 2010 20002010 Belgium 91.2 87.5 89.6 86.7 92.688.0 Germany 87.5 85.9 91.0 86.9 84.185.1 Spain 71.1 71.1 74.4 70.2 68.471.9 France 82.7 84.9 84.2 86.5 81.583.5 Italy 62.2 54.2 67.2 54.4 58.554.0 UK 91.2 88.0 93.6 90.5 88.685.7 between Belgium, Germany and the UK, where employ- ment rates are around 90%, and Spain and Italy, where the rates are 71% and 61%, respectively. At the end of the decade Italy’s position is, again, quite isolated and differences among the other countries appear reduced. As regards the paths followed in the decade (Figure 2), Spain records a strong increase in the employment rate until 2007, followed by a sharp reduction that brings the rate back to its initial level. Only France shows an increase in the employment rate over the decade, while some decline is observed in Belgium and United King- dom and a significant decline in Italy. The rate fluctuates in Germany and suffers some reduction in the final years of the decade. Gender differences are significant. In Spain the growth in employment among women exactly compensates for the decrease in the male rate. By contrast, France records a similar increase in employment in both gender segments. It is also interesting to note that among the six countries the male rate increases only in France. The decline in male employment is substantial in Italy and much larger than the decrease in female employment. Some decline in both gender segments is recorded in the United King- dom and Belgium, while in Germany the decrease in the male rate is partially offset by the increase in the female rate. Except in the UK, where the male rate remains about 5 percentage points above the female rate, at the end of the decade the gender rates are rather close overall in this age group.12 To analyze the contribution of the activity and unem- ployment rate effects to the movements in employment in this age group let us concentrate on the periods 2000- 2007 and 2008-2010. For each gender segment Table 6 sums the two effects and the second order corrections in each year in the two periods. Most of the features ob- served among younger graduates are also present in the 25 - 29 age group. The size of the changes and effects are smaller almost everywhere, but the direction remains the same almost everywhere as well. Negative activity and unemployment rate effects in both gender segments accompany the decline in em- ployment in Belgium in the period 2000-2007. The im- pact of the crisis then produces a further reduction in participation among men and a further increase in unem- ployment among women. These two effects lead to an additional decline in employment rates for both genders. Some decline in male employment driven by a negative activity rate effect is observed in the United King dom in he years 2000-2007. Subsequently, the impact of the t 12Note that at the end of the decade, the gender ratio in all six countries is greaterthan unity in this age group as well. It is 1.5 in Italy, 1.4 in Germany, 1.3 in Belgium, stable at 1.2 in Spain and France, and 1.1 in the UK. Copyright © 2011 SciRes. ME  P. POTESTIO Copyright © 2011 SciRes. ME 890 Figure 2. Employment rates of graduates aged 25 - 29—M + F − 2000 = 100. Table 6. Changes in the employment rates of graduates aged 25 - 29 in the periods 2000-2007 and 2008-2010. Belgium Germany Spain 2000/2007 2008/2010 2000/2007 2008/2010 2000/2007 2008/2010 M F M F M F M F M F M F Activity Rate Effect –1.4–1.9–1.70.2 1.2 3.0 –4.0–1.8 3.6 1.3 –2.72.2 Unemployment Rate Effect –0.7–1.60.7 –1.41.0 –1.6–2.31.5 6.3 9.5 –11.6–9.4 Second Order Correction 0.2 0.1 0.0 0.0 0.1 –0.10.0 0.0 0.0 –0.1 0.1 –0.1 e –1.9 –3.4 –0.9 –1.2 2.3 1.4 –6.4 –0.3 9.8 10.7 –14.1 –7.2 France Italy UK 2000/2007 2008/2010 2000/2007 2008/2010 2000/2007 2008/2010 M F M F M F M F M F M F Activity Rate Effect 2 .8 –0.50.3 2.1 –11.7–8.4–3.6–2.2 –1.9 0.2 0.3 –0.3 Unemployment Rate Effect –1.81.4 1.1 –0.95.5 8.5 –3.2 –2.5 0.7 –0.3 –2.1 –2.4 Second Order Correction –0.1 0.0 0.0 0.0 –0.1 0.1 0.2 0.1 0.0 0.0 0.0 0.0 e 0.9 0.8 1.4 1.2 –6.2 0.2 –6.6 –4.7 –1.2 –0.1 –1.8–2.8 crisis is considerable and, again, results in a significant negative unemployment rate effect in both gender seg- ments. Again, participation does not appear affected by the crisis in the UK. Divergent patterns are observed in Germany and, par- ticularly, in Spain in the two periods. Male employment  P. POTESTIO 891 increases somewhat in Germany in the years 2000-2007, supported b y both the effects. The smaller increase in the female rate is led by a dominant, positive activity rate effect. Both effects significantly depress the male rate in the years 2008-2010. Rapid growth in both gender rates characterizes Spain in the period 2000-2007. The unemployment rate effect is the main determinant of this growth, especially in the female segment. The impact of the crisis is very strong, once again acting mainly through the unemployment rate effect. This impact is especially negativ e for male gradu- ates, and it is interesting to note that among women the activity rate effect remains positive even in 2008-2010. France is the only country in which male and female employment increases in both periods. The composition of this increase is rather different between the gender segments. In the period 2000-2007, the male employment rate is supported by the activity rate effect, while the female rate is driven by the unemployment rate effect. The opposite is recorded in 2008-2010: participation supports the increase in the female rate, while the reduction in the unemployment rate is dominant among men. A very special pattern also characterises the gender segments in Italy. A strong decline in activity in both gender segments accompanies a highly positive unem- ployment rate effect in both gender segments in the pe- riod 2000-2007, which indicates a dominant problem on the side of participation in this period. The net result of the period is a marked fall in the male rate, while the two effects offset each other among women. Subsequently, the impact of the crisis is significant both on participa- tion and unemployment. The two negative effects de- press the male rate further and give rise to a significant decrease in the female rate. The particular processes in Italy produce a ratio between the weights (1 – u) and a that is higher at the end of the decade than th ose observed in all the other countries. Naturally, this evolution wea- kens the unemployment rate effect. The very poor performance of Italian graduates even in the 25 - 29 age group is again apparently connected with the Italian reform of the higher education system. In Potestio (2011) a strong difference in the movements in participation and unemployment of first- and second- level graduates since 2004 is emphasised. Participation falls drastically among first-level graduates, while it in- creases among second-level graduates. Symmetrically, unemployment decreases significantly among second- level graduates, while it increases among first-level gra- duates, in particular among male graduates in the late 2000s. Some connection between the decline in the (male and female) participation of first-level graduates and the general lengthening of th e time spent in education on the one hand, and the major difficulties experienced by male first-level graduates in labour market placement and jobs on the other have had an important role in the poor re- sults of Italian graduates in this age group. Despite the fact that the magnitude of the changes is generally smaller, significant processes also emerge from the comparison between the six countries in the 25 - 29 age group. The activity rate effect continues to have a major role, whereas the unemployment rate effect is, again, dominant in Spain. The impact of the crisis differs appreciably between the countries. Again, an interesting aspect is the range of reactions of participation: in Ger- many, male participation falls appreciably, which con- tributes to mitigating the unemployment rate effect in th e late 2000s. In Spain, the participation of female graduates continues to grow, despite the large increase in unem- ployment. Nor does participation in both gender seg- ments in the United Kingdom appear to be affected by the crisis. Overall, etting aside the particular develop- ments in Italy, the significant reduction of differences in employment rates among the female segments is the most positive aspect of the decade. 5. Conclusions The paper has sought to assess the relative importance of participation and unemployment and the interaction between them in affecting the evolution of employment rates of young graduates in selected European countries. The investigation using the Taylor formula on the evolution of employment rates underscores very different processes and a remarkable, persistent heterogeneity in labour markets for young graduates. We conclude by summing up the main aspects and issues that emerge from our investigation. 1) Some processes of involution have occurred in young graduate labour markets, independently of the crisis of the late 2000s. A clear and rapid involution has occurred in Italy, one that appears strongly connected with the reform of the higher edu cation system at the end of 1990s. The reform has de facto slowed the entry of graduates into the labour market by extending the length of degree courses. On the other hand, problems involving labour market placement and jobs for first-level graduates (in both age groups) combine in maintaining compara- tively higher levels of unemployment in Italy. The poor results of Italian higher education policy require new interventions. Simplifying and increasing the efficiency of the organization of degree courses as well as removing restrictions on access to a range of professions for first- level graduates should be policy priorities. Belgium also experiences a severe involution (which accelerates in the late 2000s) among younger graduates. The strong perfor- Copyright © 2011 SciRes. ME  P. POTESTIO Copyright © 2011 SciRes. ME 892 mance of this segment in Belgiu m at the start of the dec- ade deteriorates sharply over the period. In both coun- tries participation has a major role in depressing em- ployment. The processes in Italy and, especially, in Bel- gium certainly remain open to further analysis. 2) Progress has been curbed to a significant extent by the crisis of the late 2000s. The impact of the crisis is particularly severe in Spain, where it has erased the re- markable progress made earlier. The crisis significantly affects the United Kingdom, but has only slowed growth in France. The growth in participation supports the in- creases in employment in France, whereas unemploy- ment has a major role in the opposite movement of em- ployment in Sp ain and in the decline in the late 2000s in the United Kingdom. A relevant aspect is the different sensitivity of participation to the crisis and to the move- ments in unemployment among countries and genders. The most common phenomenon is a significant sensitiv- ity of participation to the crisis, an aspect that could rise interesting analytical qu estions. 3) Gender differences are very interesting. On a gen- eral plane, the stronger growth of degrees among women and the widespread increase in female employment rates are recent, clearly important phenomena. How higher employment among young female graduates is charac- terizing by country, sector, field of studies and career are crucial questions, still largely open to analysis, to be ex- plored in evaluating these phenomena. In our specific comparisons, the progress in female employment in Spain and France, the particular growth of male em- ployment in France and the different effects that have supported these developments deserve special attention. Overall, apart from Italy, the narrower differences in female employment levels in the remaining five coun- tries represent the most significant progress in the dec- ade. 4) In conclusion, the heterogeneity of labour markets for young graduates in 2000 assu mes different character- istics at the end of the decade but remains substantial. The leading performance of France and the lagging per- formance of Italy are a major part of these changing characteristics. The results in both countries are signifi- cantly connected with innovations or new structures of the higher education system, which confirms the crucial role that the structure of higher education plays in facili- tating the matching of the demand for and supply of la- bour and in accelerating the entry of young graduates into labour markets. 6. References [1] OECD, “Jobs Study: Facts, Analysis, Strategies,” Paris, 1994. [2] W. Kok, “Jobs: Creating More Employment in Europe,” Report of the Employment Taskforce chained by Wim Kok, Office for Official Publications of the European Commu- nities, Luxemburg, 2003. [3] M. Gold, Ed., “Employment Policy in the European U nion,” Palgrave MacMillan, 2009. [4] H. Schomburg and U. Teichler, Eds., “Employability and Mobility of Bachelor Graduates in Europe,” Sense Pub- lishers, Rotterdam, 2011. [5] J. Allen and R. Van der Velden, Eds., “The Flexible Pro- fessional in the Knowledge Society: General Results of the REFLEX Project,” 2007. http//www.reflexproject.org [6] U. Teichler, Ed., “Careers of University Graduates. Views and Experiences in Comparative Perspective,” Springer, Berlin, 2007. [7] H. Schomburg and U. Teichler, “Higher Education and Gra d u a t e Employm e n t i n E u r ope,” S prin g e r , Berl in , 2006. [8] R. J. Barro and L. J. Wha, “International Measures of Schooling Years and Schooling Quality,” AEA Papers and Proceedings, Vol. 86, No. 2, 2001, pp. 218-223. [9] J. Giret, C. Guégnard and C. Michot, “The Vocationalisa- tion of University Programmes in France: Its Conse- quences for Employability and Mobility,” Sense Publishers, Rotterdam, 2011, pp. 111-128. [10] P. Potestio, “Delayed Entry and the Utilization of Higher Education in Italian Youth Labour Markets: Evolution and Involution,” International Conference on “Huma n Capital and Employment in the European and Mediterra- nean Area”, Alma Laurea Working Papers No. 41, Bolo- gna, 2011. http://www2.almalaurea.it/universita/pubblicazioni/wp/ |