 Vol.2, No.4, 465-476 (2011) doi:10.4236/as.2011.24060 C opyright © 2011 SciRes. Openly accessible at http://www.scirp.org/journal/AS/ Agricultural Scienc es Soybean seed protein, oil, and fatty acids are altered by S and S + N fertilizers under irrigated or non-irrigated environments* Nacer Bellaloui1#, M. Wayne Ebelhar2, Anne M. Gillen1, Daniel K. Fisher3, Hamed K. Abbas1, Alemu Mengistu4, Krishna N. Reddy3, Robert L. Paris5 1Crop Genetics Research Unit, USDA-ARS, Stoneville, USA; #Corresponding Author: nacer.bellaloui@ars.usda.gov 2Delta Research and Extension Center, Stoneville, USA; 3Crop Production Systems Research Unit, USDA-ARS, Stoneville, USA; 4Crop Genetics Research Unit, USDA-ARS, Jackson, USA; 5The American Chestnut Foundation, Beckley, USA. Received 9 August 2011; revised 22 September 2011; accepted 19 October 2011. ABSTRACT Information on the effect of sulfur (S) or sul- fur+nitrogen (S + N) on soybean seed composi- tion is scarce. Thus, the objective of this study was to investigate the effects of S, and S + N fertilizers on soybean [(Glycine max (L.) Merr.)] seed composition in the Early Soybean Produc- tion System (ESPS) under irrigated (I) and non- irrigated (NI) environments. Two separate field experiments w ere conducted from 2005 to 2007. One experiment was irrigated, and the second experiment was non-irrigated. Under I condition, S at a rate of 44.8 kg/ha alone or with N at 112 kg/ha resulted in a consistent increase in seed protein and oleic acid concentrations, and a decrease in oil and linolenic acid concentra- tions compared with the control (C). For exam- ple, in 2006 and compared with the C, applica- tion of S + N increased the percentage up to 11.4% and 48.5% for protein and oleic acid, re- spectively. However, oil c oncentration decreased by 3%. Protein and oleic acid increase were accompanied by a higher percentage of leaf and seed N and S. Under NI conditions, seed protein and oleic acid concentrations were significantly higher in C than in any S or S + N treatments, but the oil and linolenic acid concentrations were significantly lower. The results indicate that s pe- cific rate of S alone or S + N combined can alter seed composition under irrigated or nonirri- gated conditions. This knowledge may help plant breeders to develop and release cultivars to suit specific target locations to grow new value - add e d so yb e a n s o r sele c t for s p e c ifi c seed composition traits under specific environmen- tal stress factors such as drought. Keywords: Fatty Acids; Nutrition; Oil; Protein; Seed Composition; Soybean 1. INTRODUCTION Soybean is a major source of high nutritional quality protein and oil [1], and its economic value can be deter- mined by seed protein and oil content. Protein in soy- bean seed ranges from 341 to 568 g/kg with a mean of 421 g/kg, and oil ranges from 83 to 279 g/kg with a mean of 195 g/kg [2]. The concentration of saturated fatty acids in soybean oil ranges from 100 to 120 g/kg for palmitic acid and from 22 to 72 g/kg for stearic acid [3]. The mean concentration of unsaturated fatty acids in oil is 240 g/kg for oleic acid, 540 g/kg for linoleic acid, and 80 g/kg for linolenic acid [4]. In the midsouthern USA, soybean is produced under both irrigated and non-irrigated conditions, with about 50% of soybean grown in the Mississippi Delta non- irrigated. This is mainly because soybean yield varies from season to season due to varying environmental conditions such as soil type, rainfall, temperature, and management practices [5]. To avoid drought stress dur- ing late July through early September, the Early Soybean Production System (ESPS) in the midsouth was devel- oped using early maturing group cultivars (MG IV and V) planted in April through early May and harvested in August and September [6,7]. Although the yield in ESPS has been shown to be higher under both irrigated and *Mention of trade names or commercial products in this publication is solely for the purpose of providing specific information and does no imply recommendation or endorsement by the U.S. Department o Agriculture.  N. Bellaloui et al. / Agricultural Sciences 2 (2011) 465-476 Copyright © 2011 SciRes. Openly accessible at http://www.scirp.org/journal/AS/ 466 non-irrigated environments compared to the traditional production system, its effects on seed composition have not been thoroughly evaluated [8]. The change from conventional soybean production system to ESPS has shifted the time of oil and protein deposition to a warmer period, leading to possible change in the accumulation of protein, oil, and fatty acid rates. In the Mississippi Delta, USA, sulfur fertilizer is not commonly applied to the soybean crop because Delta soil has adequate nutrients. In general, 10 units of nitrogen used by the plants re- quire one unit of sulfur, therefore, continuous removal of sulfur from soil or inhibition of sulfur uptake due to drought or high temperature may alter soybean seed composition (protein, oil, and fatty acids) since both N and S are essential components in seed composition constituents. The physiological and biochemical roles of N and S have been previously reported for plants [9,10]. Seed N concentration is correlated with N availability in plants, and the contribution of N remobilization to seed N ac- counted for 80% to 90% of total N in soybean [11]. De- pending on growth stages [12], seed N content differed significantly between R5, R6, and R7 growth stage, and the mean N contents were 6.28% at R5, 6.35% at R6, and 6.68% at R7 [13]. The majority of N demand takes place at the R5 developmental stage [14-16], when seeds become the nutrient sink, and remobilization and trans- location of N from vegetative tissues into the developing seeds occurs. Relationships between seed composition and nutrient levels in soil and seed were previously reported [17]. For example, higher percentages of protein and oleic acid were accompanied by higher concentrations of N, K, B, and Zn in seed [17]. Recently, it was found that foliar boron application increased seed protein and oleic acid concentrations [18,19]. The effect of large amounts of fertilizer N on soybean protein and oil concentrations was previously studied [7]. In their study, a significant decrease in seed protein concentration (2.7% and 1.9%), an increase in oil concentration (2.2% and 2.7%), and a decrease in the protein/oil ratio (4.7% and 4.6%) under irrigated and non-irrigated environments, respectively [7] were found. In spite of the well-established role of N and S nutri- tion in plant growth and development, there is a lack of information on the effect of S alone or S + N combined on soybean seed composition in ESPS under irrigated and non-irrigated environments. Therefore, the objective of this study was to investigate the effects of S alone or S combined with N fertilizer on soybean seed protein, oil, fatty acids, and the physiological dynamics of leaf and seed S and N concentration under irrigated and non- irrigated conditions in ESPS. 2. MATERIALS AND METHODS Two field experiments were conducted at the Delta Research and Extension Center, Stoneville, MS (33˚26'N latitude) in 2005, 2006, and 2007. One experiment was irrigated (I) and the second experiment was non-irrigated (NI)), and both experiments were conducted as previ- ously described [6,20]. Experimental conditions for both studies were similar, except irrigation. Treatments were separated by border of 5 rows of soybean with an alley of 7.3 meters. Soybean cultivar AG3905, late maturity group III, was planted on 17 May 2005, 17 May 2006, and 23 April 2007. Row spacing was 0.66 m and seeding rate was 27 seeds m–1. Plots were 5 rows wide and 4.88 m long. Soybean was harvested on 14 October 2005, 3 October 2006, and 21 September 2007. When soybeans reached R8 growth stage, the middle three rows were harvested from each plot for seed [12]. The soil was a silty clay loam with a texture of 16% sand, 44% silt, and 40% clay, with 2.17% organic matter, 0.9 g N/kg, and 92.30 mg S/kg. Different rates of S and S combined with N fertilizer were supplied as follows: Control (C) = 0 kg·S/ha + 0 kg·N/ha; Treatment 1 (T1) = 22.4 kg·S/ha + 0 N; Treatment 2 (T2) = 44.8 kg·S/ha + 0 N; Treatment 3 (T3) = 67.2 kg·S/ha + 0 N; Treatment 4 (T4) = 0 kg·S + 112 kg·N/ha; Treatment 5 (T5) = 22.4 kg·S/ha + 112 kg·N/ha; Treatment 6 (T6) = 44.8 kg·S/ha + 112 kg·N/ha; Treatment 7 (T7) = 67.2 kg·S/ha + 112 kg·N/ha. Borders from each side of each plot to avoid contamination and carry-over to other plots were used. Sulfur and S + N were broadcasted at V3-V4 growth stage. The experiment was furrow irrigated as needed to avoid severe water stress soil-water potential for irri- gated soil ranged between 0 and −21 kPa over the grow- ing season. For non-irrigated plots, the soil-water poten- tial, especially during the critical stages of the crop de- velopment in June to August was as low as −191 kPa, depending on the year. 2.1. Experimental Design and Analysis Each experiment was a randomized complete block design, with S and N fertilizer levels. Four replicates in each irrigation treatment were used. Analysis of variance using Proc GLM was conducted using SAS [21], with level of significance of P ≤ 5%. 2.2. Soil and Seed Mineral Analyses Analyses of soil and seed were conducted at The University of Georgia’s Soil, Plant, and Water Labora- tory, Athens, GA. Soil mechanical analysis and organic matter, using a loss on ignition method for 3 hours at 360˚C, were conducted. Fully expanded leaves were collected at R5-R6 stage, and seed samples were col-  N. Bellaloui et al. / Agricultural Sciences 2 (2011) 465-476 Copyright © 2011 SciRes. http://www.scirp.org/journal/AS/Openly accessible at 467467 lected at full maturity. Nitrogen and S were analyzed in 0.25 g of leaf and seed samples using an elemental ana- lyzer (LECO CNS-2000, LECO Corporation, MI, USA). 2.3. Protein, Oil, and Fatty Acid Analysis Seeds were sampled from each treatment and ana- lyzed for seed composition using a near-infrared (NIR) reflectance diode array feed analyzer (Perten, Spring- field, IL) for protein, oil, and fatty acids [22,23]. The calibration equation was developed by the University of Minnesota, using Perten’s Thermo Galactic Grams PLS IQ software (Springfield, IL). The analysis was per- formed on the basis of dry matter [22,24]. Throughout the study, we used (g constituent/kg seed dry weight) to refer to “concentration” of a constituent. We used “kg constituent/ha” to refer to the total constituent based on seed yield per ha. 3. RESULTS 3.1. Analysis of Variance: Seed Yield and Seed N and S Under I conditions, there was no significant effect of S, N, or S + N supply (Fert) on yield, as expected (Table 1). Year was the main source of yield variability (Table 1). However, Fert was significant for the percentage of N and S in seed and leaf as well as, total N and S (kg/ha) (Table 1). Year was significant for seed N/S ratio and seed total S (Ta ble 1). Year × Fert interaction was sig- nificant for total N only. Under NI, there was no effect of Fert on yield. Year was significant for seed S percentage, N/S ratio, and total S and N. Fert was significant for seed N/S ratio only. There was no year × Fert interaction for seed or leaf N or S (Table 1). 3.2. Analysis of Variance: Seed Protein, Oil, and Fatty Acids Under I conditions, Fert effect was significant for protein, oil, oleic and linolenic acid concentrations (g constituent/kg seed) (Ta b le 2). Year was significant for seed protein, oil, palmitic, stearic, oleic, and linolenic acid concentrations (Table 2). Year × Fert interactions were significant for protein, oleic, and linolenic acids concentrations. Under NI, year was significant for all seed composition constituents (Table 2). Fert was sig- nificant for protein, oil, palmitic, and linolenic acid con- centrations (Ta bl e 2 ). Year × Fert interactions were sig- nificant for protein, oleic, and linolenic acids concentra- tions (Table 2). Total (kg/ha) seed composition cons Table 1 . Analysis of variance (source of variability, F value, and level of significance) for the effect of year, fertilizer [Fert (S and N supply)], and their interactions on seed N and S percent and seed N/S ratio and total seed N and S (kg·N or S/ha), and on leaf N and S percentage and leaf N/S ratio under irrigated and non-irrigated conditions at Stoneville, MS 2005-2007a. Irrigated Seed Leaves Yield N % S % ratio N (kg/ha) S (kg/ha) N % S % ratio Source F value F value F value F value F value F value F value Year 109***† ns ns 8.03** ns 8.1*** ns ns ns Fert ns 4.7***† 16.8*** 3.8* 4.8* 10.6* 6.7** 4.29* ns Year × Fert ns ns ns ns 4.8* ns ns ns ns Rep (year) 14.9*** ns ns ns ns ns ns ns ns Nonirrigated Yield N % S % ratio N (kg/ha) S (kg/ha) N % S % ratio Source F value F value F value F value F value F value F value Year 68.7***† ns 4.49* 8.94** 66.2*** 55.76*** ns ns ns Fert ns ns ns 3.03* ns ns ns ns ns Year × Fert ns ns ns ns ns ns ns ns ns Rep (year) 13.1*** ns ns ns 11.9*** 6.4*** ns ns ns a*Significance at P ≤ 0.05;**Significance at P ≤ 0.01; ***Significance at P ≤ 0.001.  N. Bellaloui et al. / Agricultural Sciences 2 (2011) 465-476 Copyright © 2011 SciRes. Openly accessible at http://www.scirp.org/journal/AS/ 468 Table 2. Analysis of variance (source of variability, F value and level of significance) for the effect of year, fertilizer [Fert (S and N supply)], and their interactions on seed protein, oil, and fatty acid concentrations (g of constituent/kg dwt) under irrigated and non-irrigated conditions at Stoneville, MS 2005-2007a. Irrigated Source Protein Oil Palmitic (C16:0) Stearic (C18:0) Oleic (C18:1) Linoleic (C18:2) Linolenic (C18:3) Year 96.4*** 11.7*** 28.9*** 300*** 12.9*** 6.9*** 53.5*** Fert 23.6*** 3.5*** ns ns 36.1*** ns 4.4*** Year × Fert 3.1*** ns ns ns 4.0*** ns 3.4*** Rep(year) 3.7*** ns ns 5.5*** ns 2.9** ns Non-irrigated Year 46.1*** 29.6*** 212*** 532*** 19.1*** 26.5*** 6.87** Fert 55.1*** 8.5*** 2.2* ns 39.6*** ns 12.1*** Year × Fert 2.0* ns ns ns 2.1* ns 3.2*** Rep (year) ns 2.5* 4.2*** ns*** ns 2.7** ns a*Significance at P ≤ 0.05;**Significance at P ≤ 0.01; ***Significance at P ≤ 0.001. Table 3. Analysis of variance (source of variability, F value, and level of significance) of the effects of year, fertilizer [Fert (S and N supply)], and their interactions for total seed protein, oil, and fatty acids (kg of constituent/ha) under irrigated and non-irrigated con- ditions for 2005, 2006, and 2007a. Irrigated Source Protein Oil Palmitic (C16:0) Stearic (C18:0)Oleic (C18:1)Linoleic (C18:2) Linolenic (C18:3) Year 114*** † 129.6*** 21.1*** 167*** 105*** 87.4*** 88.7*** Fert 3.0** ns ns ns 11.9*** ns 3.7** Year × Fert ns ns ns ns ns ns ns Rep (year) 14.0*** 14.6*** 10.2*** 9.5*** 12.7*** 15.7*** 5.2*** Non-irrigated Year 48.7*** 68.1*** 27.8*** 326*** 49.9*** 47.5*** 44.5*** Fert 2.2* ns Ns ns 6.3*** ns 5.4*** Year × Fert ns 2.0* 1.9* ns ns ns 2.9** Rep (year) 11.0*** 9.2*** 6.1*** 16.9*** 10.8*** 12.3*** 4.9*** a*Significance at P ≤ 0.05;**Significance at P ≤ 0.01; ***Significance at P ≤ 0.001. tituents showed that under I conditions, year and Fert effects were significant for total seed constituents and showed similar trend as those of concentrations, except for total oil, where Fert had no significant effect (Table 3). No year × Fert effect was shown for total seed con- stituents (Table 1). Total seed constituents under NI showed that year and Fert had similar trend as those ob- served in seed concentrations, except that Fert had no significant effect for oil and palmitic acid. Fert × year interactions were significant for oil, palmitic, and lino- lenic acid (Tabl e 3 ), differing from those of concentra- tion. 3.3. Mean Values: Yield and Seed Composition as Affected by S and S + N Supply (Fert) No clear trend or significant effects of S, N, or S + N on yield were observed under I or NI conditions (Figure 1). Under I conditions, seed protein and oleic acid con- centrations in 2005 were higher in T2 and T6 compared to C. Linolenic acid had the opposite trend of oleic acid 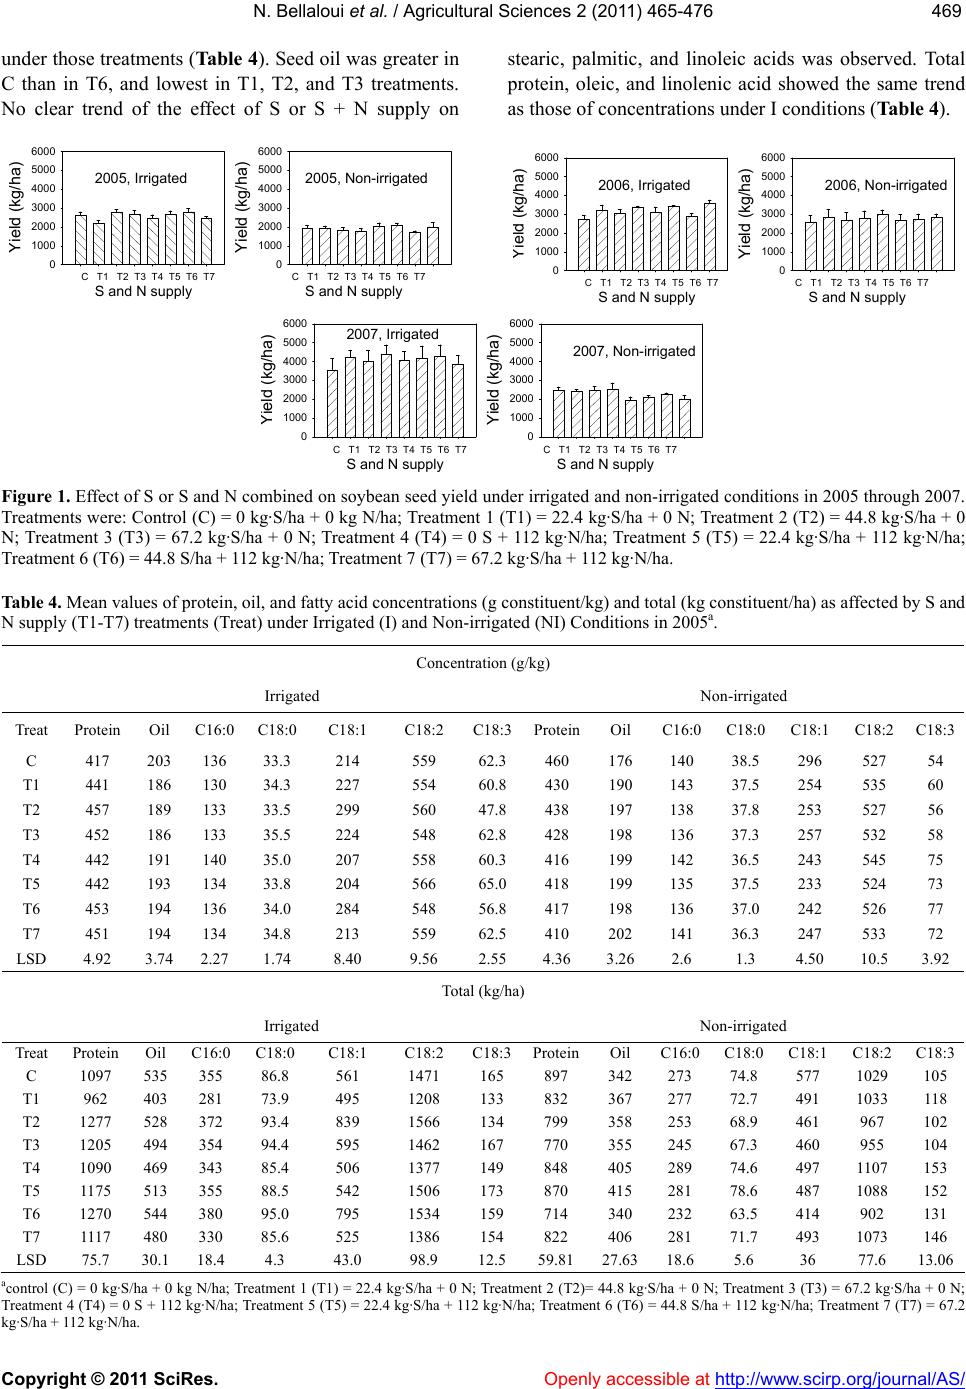 N. Bellaloui et al. / Agricultural Sciences 2 (2011) 465-476 Copyright © 2011 SciRes. Openly accessible at http://www.scirp.org/journal/AS/ 469469 under those treatments (Table 4). Seed oil was greater in C than in T6, and lowest in T1, T2, and T3 treatments. No clear trend of the effect of S or S + N supply on stearic, palmitic, and linoleic acids was observed. Total protein, oleic, and linolenic acid showed the same trend as those of concentrations under I conditions (Table 4). e g a 0 1000 2000 3000 4000 5000 6000 Yield (kg/ha) 0 1000 2000 3000 4000 5000 6000 C T1 T2 T3 T4 T5 T 6 T7 C T1 T2 T3 T4 T5 T6 T7 S and N supplyS and N supply 2005, Irrigated2005, Non-irrigated e g a 0 1000 2000 3000 4000 5000 6000 Yield (kg/ha) 0 1000 2000 3000 4000 5000 6000 C T1 T2 T3 T4 T5 T6 T7 C T1 T2 T3 T4 T5 T6 T7 S and N su l S and N su l 2006, Non-irrigated2006, Irrigated e g a 0 1000 2000 3000 4000 5000 6000 Yield (kg/ha) 0 1000 2000 3000 4000 5000 6000 C T1 T2 T3 T4 T5 T6 T7 C T1 T2 T3 T4 T5 T6 T 7 S and N supplyS and N supply 2007, Non-irrigated 2007, Irrigated Figure 1. Effect of S or S and N combined on soybean seed yield under irrigated and non-irrigated conditions in 2005 through 2007. Treatments were: Control (C) = 0 kg·S/ha + 0 kg N/ha; Treatment 1 (T1) = 22.4 kg·S/ha + 0 N; Treatment 2 (T2) = 44.8 kg·S/ha + 0 N; Treatment 3 (T3) = 67.2 kg·S/ha + 0 N; Treatment 4 (T4) = 0 S + 112 kg·N/ha; Treatment 5 (T5) = 22.4 kg·S/ha + 112 kg·N/ha; Treatment 6 (T6) = 44.8 S/ha + 112 kg·N/ha; Treatment 7 (T7) = 67.2 kg·S/ha + 112 kg·N/ha. Table 4. Mean values of protein, oil, and fatty acid concentrations (g constituent/kg) and total (kg constituent/ha) as affected by S and N supply (T1-T7) treatments (Treat) under Irrigated (I) and Non-irrigated (NI) Conditions in 2005a. Concentration (g/kg) Irrigated Non-irrigated Treat Protein Oil C16:0 C18:0 C18:1 C18:2 C18:3ProteinOil C16:0C18:0 C18:1 C18:2C18:3 C 417 203 136 33.3 214 559 62.3 460 176 140 38.5 296 527 54 T1 441 186 130 34.3 227 554 60.8 430 190 143 37.5 254 535 60 T2 457 189 133 33.5 299 560 47.8 438 197 138 37.8 253 527 56 T3 452 186 133 35.5 224 548 62.8 428 198 136 37.3 257 532 58 T4 442 191 140 35.0 207 558 60.3 416 199 142 36.5 243 545 75 T5 442 193 134 33.8 204 566 65.0 418 199 135 37.5 233 524 73 T6 453 194 136 34.0 284 548 56.8 417 198 136 37.0 242 526 77 T7 451 194 134 34.8 213 559 62.5 410 202 141 36.3 247 533 72 LSD 4.92 3.74 2.27 1.74 8.40 9.56 2.55 4.36 3.26 2.6 1.3 4.50 10.5 3.92 Total (kg/ha) Irrigated Non-irrigated Treat Protein Oil C16:0 C18:0 C18:1 C18:2 C18:3ProteinOil C16:0C18:0 C18:1 C18:2C18:3 C 1097 535 355 86.8 561 1471 165 897 342 273 74.8 577 1029 105 T1 962 403 281 73.9 495 1208 133 832 367 277 72.7 491 1033 118 T2 1277 528 372 93.4 839 1566 134 799 358 253 68.9 461 967 102 T3 1205 494 354 94.4 595 1462 167 770 355 245 67.3 460 955 104 T4 1090 469 343 85.4 506 1377 149 848 405 289 74.6 497 1107 153 T5 1175 513 355 88.5 542 1506 173 870 415 281 78.6 487 1088 152 T6 1270 544 380 95.0 795 1534 159 714 340 232 63.5 414 902 131 T7 1117 480 330 85.6 525 1386 154 822 406 281 71.7 493 1073 146 LSD 75.7 30.1 18.4 4.3 43.0 98.9 12.5 59.81 27.6318.65.6 36 77.6 13.06 acontrol (C) = 0 kg·S/ha + 0 kg N/ha; Treatment 1 (T1) = 22.4 kg·S/ha + 0 N; Treatment 2 (T2)= 44.8 kg·S/ha + 0 N; Treatment 3 (T3) = 67.2 kg·S/ha + 0 N; Treatment 4 (T4) = 0 S + 112 kg·N/ha; Treatment 5 (T5) = 22.4 kg·S/ha + 112 kg·N/ha; Treatment 6 (T6) = 44.8 S/ha + 112 kg·N/ha; Treatment 7 (T7) = 67.2 kg·S/ha + 112 kg·N/ha.  N. Bellaloui et al. / Agricultural Sciences 2 (2011) 465-476 Copyright © 2011 SciRes. Openly accessible at http://www.scirp.org/journal/AS/ 470 In 2006 and under I, protein and oleic acid concentra- tions were higher when 44.8 kg·S/ha was used (T2 and T6) compared to C or other treatments (Table 5), fol- lowing the same pattern as those in 2005. Linolenic acid was the lowest in T2, T6, and T7. It is clear that both protein and oleic acid followed the same trend of that of 2005, but the trend of oil, linoleic and linolenic acids was inconsistent with those of 2005 (Table 5). Mean values for total seed protein and oleic acid under I con- ditions were the lowest in C compared with any of S or S + N treatments (Table 5). In 2007 and under I, protein concentration was higher in all Fert treatments compared to C, and T2 and T6 had the highest protein concentrations (Tab le 6 ). Oleic acid was highest in T2, T6, and T7. Total seed protein and total oleic acid showed similar trends as those of protein and oleic acid concentrations (Table 6). Under NI, protein concentration was higher in C compared to all S or S + N treatments. For example, in 2005, depending on the S or S + N treatment, the per- centage increase from the control ranged from 4.8 to 10.9% for protein and from 14.2% to 21.3% for oleic acid. The decrease in oil ranged from 8% to 14.8% and from 0% - 42.6% for linolenic acid. This trend was also consistent for 2006 and 2007 (Tables 5 and 6). Total protein and oleic acid showed the same trend as those of concentrations (Tables 4-6). Table 5 . Mean values of protein, oil, and fatty acid yield (g constituent/kg) and total (kg/ha) as affected by S and N Supply (T1-T7) Treatments (Treat) † under Irrigated (I) and Non-irrigated (NI) Conditions in 2006a. Concentration (g/kg) Irrigated Non-irrigated Treat Protein Oil C16:0 C18:0 C18:1 C18:2 C18:3ProteinOil C16:0C18:0 C18:1 C18:2C18:3 C 402 198 132 48.8 214 48.8 102 453 174 107 55.0 292 508 55.5 T1 411 200 133 50.0 211 50.0 103 404 199 118 55.0 257 509 59.5 T2 447 191 129 49.0 290 49.0 98.9 421 211 116 56.3 258 508 62.0 T3 411 189 140 50.5 200 47.0 105 400 198 114 55.3 240 497 89.5 T4 401 193 130 50.0 218 50.0 95.8 394 202 124 54.2 235 509 90.0 T5 412 193 115 50.0 228 50.0 91.0 400 201 106 54.5 222 517 82.5 T6 448 192 125 49.5 318 49.5 83.5 394 207 116 54.8 219 521 72.8 T7 421 193 125 47.0 222 47.0 68.8 397 209 108 54.0 223 518 70.0 LSD 5.7 3.6 4.8 1.7 10.3 1.7 4.4 4.41 4.59 5.9 1.3 6.36 7.1 4.68 Total (kg/ha) Irrigated Non-irrigated Treat Protein Oil C16:0 C18:0 C18:1 C18:2 C18:3ProteinOil C16:0C18:0 C18:1 C18:2C18:3 C 1093 540 358 133 583 1438 275 1167 451 274 142 751 1315 145 T1 1317 637 417 158 676 1707 323 1147 565 334 156 723 1449 173 T2 1354 579 388 149 870 1585 297 1140 567 311 150 693 1380 166 T3 1384 637 472 170 675 1781 353 1112 556 315 154 675 1395 254 T4 1255 601 404 156 686 1653 301 1177 601 367 162 708 1528 265 T5 1398 655 390 170 775 1831 309 1072 536 279 146 598 1400 221 T6 1289 553 359 141 914 1506 240 1070 564 314 148 596 1421 198 T7 1504 690 447 168 797 1949 245 1118 587 305 152 630 1459 196 LSD 88.8 40.9 21.2 10.4 58.9 104 19.4 126.2 60.5 32.6 15.7 77.3 171 24.8 acontrol (C) = 0 kg·S/ha + 0 kg·N/ha; Treatment 1 (T1) = 22.4 kg·S/ha + 0 N; Treatment 2 (T2)= 44.8 kg·S/ha + 0 N; Treatment 3 (T3) = 67.2 kg·S/ha + 0 N; Treatment 4 (T4) = 0 S + 112 kg·N/ha; Treatment 5 (T5) = 22.4 kg·S/ha + 112 kg·N/ha; Treatment 6 (T6) = 44.8 S/ha + 112 kg·N/ha; Treatment 7 (T7) = 67.2 kg·S/ha + 112 kg·N/ha.  N. Bellaloui et al. / Agricultural Sciences 2 (2011) 465-476 Copyright © 2011 SciRes. Openly accessible at http://www.scirp.org/journal/AS/ 471471 Table 6. Mean values of protein, oil, and fatty acids concentration (g constituent/kg) and total (kg constituent/ha) as affected by S and N supply (T1-T7) treatments (Treat) under Irrigated (I) and Non-irrigated (NI) conditions in 2007a. Concentration (g/kg) Irrigated Non-irrigated Treat Protein Oil C16:0 C18:0 C18:1 C18:2 C18:3ProteinOil C16:0C18:0 C18:1 C18:2C18:3 C 428 217 109 43.0 227 537 60.0 451 205 104 44.0 293 536 47.5 T1 455 200 105 41.8 217 549 54.8 428 205 104 43.3 231 535 78.3 T2 459 204 110 43.0 307 529 62.8 415 219 103 43.5 221 545 78.3 T3 444 200 110 43,5 238 568 70.8 409 210 106 44.3 227 533 71.8 T4 442 199 131 45.3 233 568 62.3 405 224 108 44.5 229 536 77.8 T5 453 198 105 42.3 247 545 56.0 403 214 105 43.8 224 529 82.5 T6 464 198 119 44.8 287 564 48.0 406 214 108 43.8 224 535 74.0 T7 448 195 103 41.3 305 547 62.5 391 211 102 43.8 228 537 77.8 LSD 4.9 4.5 9.5 0.94 10.3 23.5 5.1 3.65 6.55 2.2 0.5 6.51 4.4 4.32 Total (kg/ha) Irrigated Non-irrigated Treat Protein Oil C16:0 C18:0 C18:1 C18:2 C18:3ProteinOil C16:0C18:0 C18:1 C18:2C18:3 C 1522 779 394 153 794 1919 216 1108 504 255 108 719 1316 115 T1 1924 844 446 177 922 2330 229 1035 496 252 105 560 1295 190 T2 1844 808 443 171 1057 2137 252 1027 536 254 108 547 1351 192 T3 1947 871 490 192 1057 2497 318 1041 531 273 113 584 1362 185 T4 1804 810 560 186 965 2360 254 792 433 211 87.0 448 1051 154 T5 1884 815 436 173 1019 2292 227 857 454 223 93.0 477 1123 176 T6 1978 838 511 191 1222 2436 204 910 480 241 98.2 504 1202 167 T7 1738 765 403 159 1192 2132 237 790 427 206 88.5 459 1092 158 LSD 228 99.0 81.6 21.3 149 332 37.0 72.10 32.3420.2 7.7 45.48 100.4 16.89 acontrol (C) = 0 kg·S/ha +0 kg·N/ha; Treatment 1 (T1) = 22.4 kg·S/ha + 0 N; Treatment 2 (T2) = 44.8 kg·S/ha + 0 N; Treatment 3 (T3) = 67.2 kg·S/ha + 0 N; Treatment 4 (T4) = 0 S + 112 kg·N/ha; Treatment 5 (T5) = 22.4 kg·S/ha + 112 kg·N/ha; Treatment 6 (T6) = 44.8 S/ha + 112 kg·N/ha; Treatment 7 (T7) = 67.2 kg·S/ha + 112 kg·N/ha. 3.4. Mean Values: Seed and Leaf S and N as Affected by S and S + N Supply Under I, percentage (%) and total N and S (kg·N or S/ha) in leaf tissue and seed were higher in both T2 and T6 samples compared to C in 2005 and 2006 (Ta b l e s 7 and 8). N/S ratio was generally higher in C than T2 or T6. The opposite trend of N/S ratio in leaf was observed, i.e., N/S ratio was generally higher in T2 and T6 com- pared to the C (Tabl e 7 ). Under NI, seed S percentage was higher in T2 and T6 than in C in 2005 and 2006, but seed N percentage was inconsistent across years (Table 7). Under NI, leaf N percentage in C was higher than other S or S + N treatments, and leaf S percentage was inconsistent across years (Table 7). 4. DISCUSSION Seed Yield and Seed N and S Year was the main source for yield variability, indi- cating that yield is affected by yearly seasonal environ- mental factors such as drought and heat. There was no significant yield difference due to S, N, or S + N appli- cation in each year, but significant seed composition quality differences were observed under irrigated or non- irrigated. Year, Fert, and year × Fert interactions were the main source for protein, oleic, and linolenic concen- trations variability under both I and NI conditions, indi- cating that the effect of S or S + N supply on seed com- position depended on the environmental factors and S or  N. Bellaloui et al. / Agricultural Sciences 2 (2011) 465-476 Copyright © 2011 SciRes. Openly accessible at http://www.scirp.org/journal/AS/ 472 S + N management in each year. These environmental factors influencing seed constituents could be irriga- tion/drought or temperature [25-27]. No consistency effects of fertilizer treatments were noticed on seed composition constituents, except for T2 and T6. This could be that a specific rate of S or S + N supply is required to result in seed composition changes. The increase of seed protein and oleic acid under I con- ditions in T2 and T6 compared to the C in 2005, 2006, and 2007 indicates that applying the rates (44.8 kg·S/ha alone or with N at 112 kg·N/ha) increased the concentra- tions and total seed protein and oleic acid. This may be due to the indirect effect of S on enzymes involved in de novo protein and oleic synthesis or enzyme activities, especially fatty acid desaturases. Also, S may have an indirect effect on S and N uptake and translocation from leaf tissues to seed at vegetative stages. It was reported that seed protein requires a high mobilization of stored vegetative N [28,29] and S [30] to seed. This observa- tion may be supported by the current results of S and N status in seed and leaves. For example, under I, concen- trations of N and S in leaf tissue and seed (Table 7) were higher in both T2 and T6 seed compared to C, possibly due to enhanced uptake and mobility of N and S resulted from S and S + N application. The consistent higher N/S ratio in 2005 and 2006 indicates that, compared to the C, the rate of increase of seed S in T2 and T6 was higher than the rate of increase in seed N in T2 and T6. For example, compared to C in 2005, the rate of increase in seed S was 5% in T2 and 40% in T6. However, the rate of increase in seed N was 22% in T2 and 20% in T6. The same general trend was noticed in 2006. The opposite trend of N/S ratio in leaf and seed indicates that the rate of leaf N increase in T2 and T6 was higher than the rate of leaf S increase. For example, the rate of increase in N in T2 was 36%, and in T6 was 44% compared to the increase of S in T2 (23%) and in T6 (17%). The dynam- ics of S and N status in leaves and seed indicate that there is a minimum level of both S and N required in tissues to impact seed S and N, and as a result, influenc- ing seed protein, oleic acid, and linolenic concentrations. Therefore, the consistent higher seed protein and oleic acid in T2 and T6 than the C under I conditions indicate the significance of S or S + N application in altering seed constituents under irrigated conditions in ESPS in the Midsouth. Our results are consistent with the obser- vation that seed protein required a high demand of mobi- lization of vegetative N [28,29] and S [30] to seed. Since the level of N and S concentrations in leaf could limit seed constituent concentrations, especially protein and oleic acid, maintaining N and S concentration in leaf tissue at vegetative stage is important for higher total seed protein and oleic acid, especially under I condi- tions. Under NI, N/S ratio did not change in S and N treat- ments compared to the C because N did not change in seed, although a small percentage of seed S increase in T2 and T6 was observed. The rate of increase in leaf S was higher in T2 and T6 compared to the C, but no leaf N change was observed, reflecting that the application of N may not lead to higher N in seed under non-irrigated. This may be due to lower uptake and mobility of N un- der NI conditions due to water stress. The inverse rela- tionship between oleic and linolenic acid concentrations was expected, as it has been shown in previous research [25,27], and emphasized that the increase in seed quality for protein and oleic acid occurred at the expenses of oil and linolenic acid. Table 7. Percentage (%) of seed and leaf N and S, and N:S ratio as affected by S and N supply treatments (Treat)† under Irrigated (I) and Non-irrigated (NI) conditions in 2005 and 2006. Leaf refers to the fully expanded leaf at R5-R6 stagesa. 2005 2006 Seed 2005 2006 I I NI NI Treat N S N:S ratio N S N:S ratioN S N:S ratioN S N:S ratio C 5.1 0.43 12.3 4.6 0.46 10.2 6.7 0.33 6.7 6.3 0.36 17.9 T2 6.2 0.58 10.8 5.2 0.63 8.3 6.7 0.37 6.7 6.0 0.41 14.5 T4 5.2 0.43 12.2 5.8 0.52 11.2 6.4 0.34 6.4 6.6 0.39 17.1 T6 6.1 0.60 10.3 5.6 0.57 9.9 6.6 0.38 6.6 6.5 0.40 16.4 LSD 0.21 0.03 0.72 0.35 0.03 0.70 0.12 0.020 0.12 0.27 0.022 1.08 2005 2006 Leaf 2005 2006 I I NI NI Treat N S N:S ratio N S N:S ratioN S N:S ratioN S N:S ratio C 3.6 0.35 10.4 4.2 0.35 12.4 4.8 0.38 12.9 4.9 0.33 14.8 T2 4.9 0.43 11.6 5.2 0.41 12.7 3.9 0.34 11.5 4.3 0.35 12.2 T4 5.4 0.40 13.7 5.1 0.41 12.5 4.3 0.33 14.1 4.2 0.36 12.7 T6 5.2 0.41 12.8 5.1 0.37 14.0 3.9 0.36 11.0 4.2 0.34 13.0 LSD 0.29 0.013 0.92 0.36 0.030 1.44 0.30 0.026 1.46 0.3 0.030 1.96 acontrol (C) = 0 kg·S/ha + 0 kg·N/ha; Treatment 2 (T2) = 44.8 kg·S/ha + 0 N; Treatment 4 (T4) = 0 S+112 kg·N/ha; Treatment 6 (T6) = 44.8 S/ha + 112 kg·N/ha. 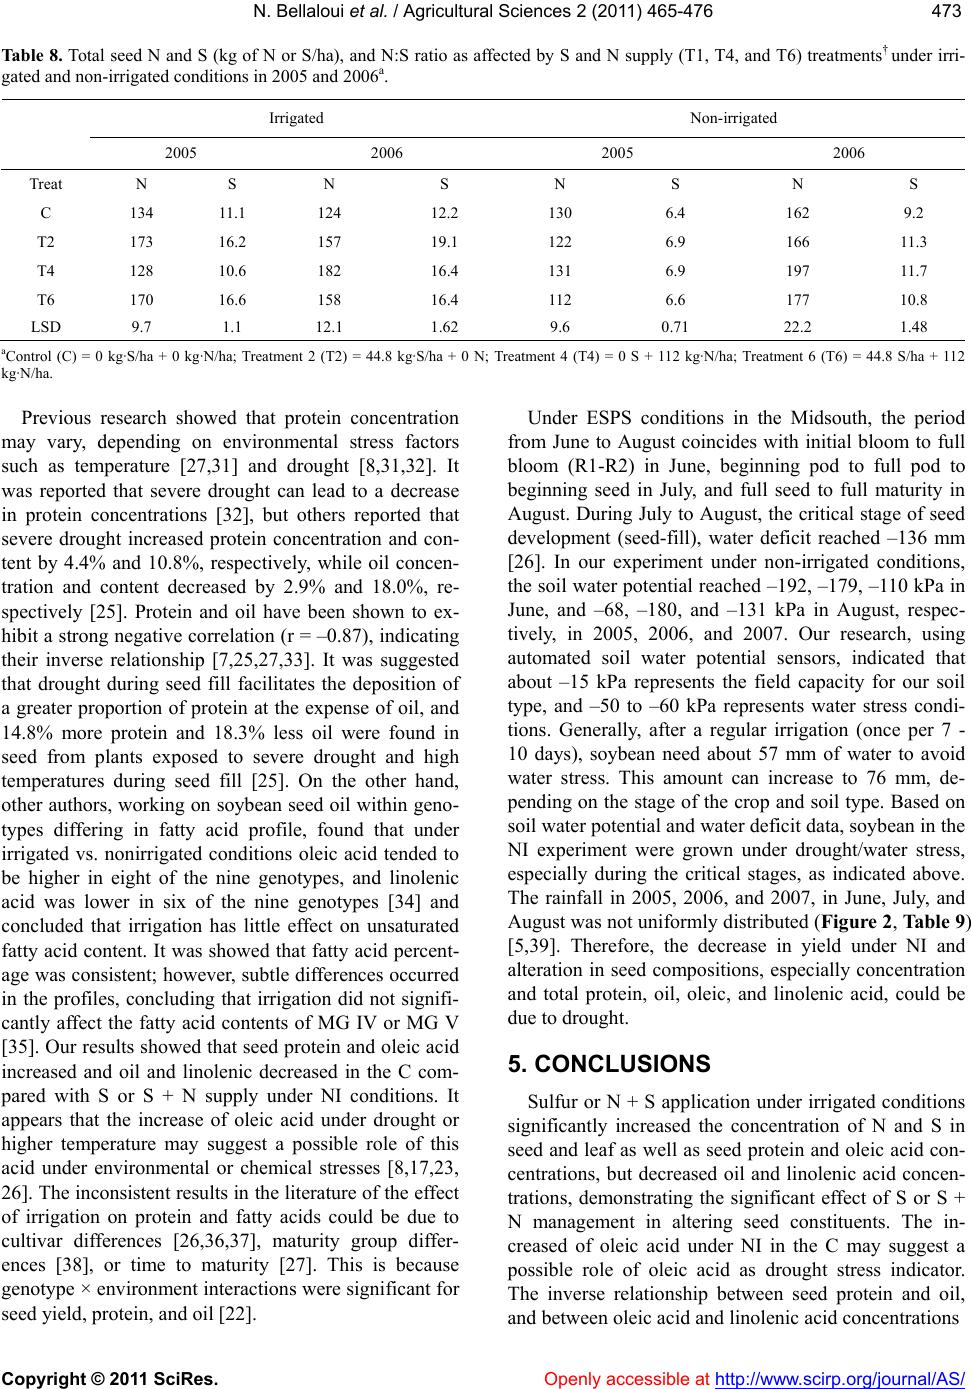 N. Bellaloui et al. / Agricultural Sciences 2 (2011) 465-476 Copyright © 2011 SciRes. Openly accessible at http://www.scirp.org/journal/AS/ 473473 Table 8. Total seed N and S (kg of N or S/ha), and N:S ratio as affected by S and N supply (T1, T4, and T6) treatments† under irri- gated and non-irrigated conditions in 2005 and 2006a. Irrigated Non-irrigated 2005 2006 2005 2006 Treat N S N S N S N S C 134 11.1 124 12.2 130 6.4 162 9.2 T2 173 16.2 157 19.1 122 6.9 166 11.3 T4 128 10.6 182 16.4 131 6.9 197 11.7 T6 170 16.6 158 16.4 112 6.6 177 10.8 LSD 9.7 1.1 12.1 1.62 9.6 0.71 22.2 1.48 aControl (C) = 0 kg·S/ha + 0 kg·N/ha; Treatment 2 (T2) = 44.8 kg·S/ha + 0 N; Treatment 4 (T4) = 0 S + 112 kg·N/ha; Treatment 6 (T6) = 44.8 S/ha + 112 kg·N/ha. Previous research showed that protein concentration may vary, depending on environmental stress factors such as temperature [27,31] and drought [8,31,32]. It was reported that severe drought can lead to a decrease in protein concentrations [32], but others reported that severe drought increased protein concentration and con- tent by 4.4% and 10.8%, respectively, while oil concen- tration and content decreased by 2.9% and 18.0%, re- spectively [25]. Protein and oil have been shown to ex- hibit a strong negative correlation (r = –0.87), indicating their inverse relationship [7,25,27,33]. It was suggested that drought during seed fill facilitates the deposition of a greater proportion of protein at the expense of oil, and 14.8% more protein and 18.3% less oil were found in seed from plants exposed to severe drought and high temperatures during seed fill [25]. On the other hand, other authors, working on soybean seed oil within geno- types differing in fatty acid profile, found that under irrigated vs. nonirrigated conditions oleic acid tended to be higher in eight of the nine genotypes, and linolenic acid was lower in six of the nine genotypes [34] and concluded that irrigation has little effect on unsaturated fatty acid content. It was showed that fatty acid percent- age was consistent; however, subtle differences occurred in the profiles, concluding that irrigation did not signifi- cantly affect the fatty acid contents of MG IV or MG V [35]. Our results showed that seed protein and oleic acid increased and oil and linolenic decreased in the C com- pared with S or S + N supply under NI conditions. It appears that the increase of oleic acid under drought or higher temperature may suggest a possible role of this acid under environmental or chemical stresses [8,17,23, 26]. The inconsistent results in the literature of the effect of irrigation on protein and fatty acids could be due to cultivar differences [26,36,37], maturity group differ- ences [38], or time to maturity [27]. This is because genotype × environment interactions were significant for seed yield, protein, and oil [22]. Under ESPS conditions in the Midsouth, the period from June to August coincides with initial bloom to full bloom (R1-R2) in June, beginning pod to full pod to beginning seed in July, and full seed to full maturity in August. During July to August, the critical stage of seed development (seed-fill), water deficit reached –136 mm [26]. In our experiment under non-irrigated conditions, the soil water potential reached –192, –179, –110 kPa in June, and –68, –180, and –131 kPa in August, respec- tively, in 2005, 2006, and 2007. Our research, using automated soil water potential sensors, indicated that about –15 kPa represents the field capacity for our soil type, and –50 to –60 kPa represents water stress condi- tions. Generally, after a regular irrigation (once per 7 - 10 days), soybean need about 57 mm of water to avoid water stress. This amount can increase to 76 mm, de- pending on the stage of the crop and soil type. Based on soil water potential and water deficit data, soybean in the NI experiment were grown under drought/water stress, especially during the critical stages, as indicated above. The rainfall in 2005, 2006, and 2007, in June, July, and August was not uniformly distributed (Figure 2, Table 9) [5,39]. Therefore, the decrease in yield under NI and alteration in seed compositions, especially concentration and total protein, oil, oleic, and linolenic acid, could be due to drought. 5. CONCLUSIONS Sulfur or N + S application under irrigated conditions significantly increased the concentration of N and S in seed and leaf as well as seed protein and oleic acid con- centrations, but decreased oil and linolenic acid concen- trations, demonstrating the significant effect of S or S + N management in altering seed constituents. The in- creased of oleic acid under NI in the C may suggest a possible role of oleic acid as drought stress indicator. The inverse relationship between seed protein and oil, and between oleic acid and linolenic acid concentrations 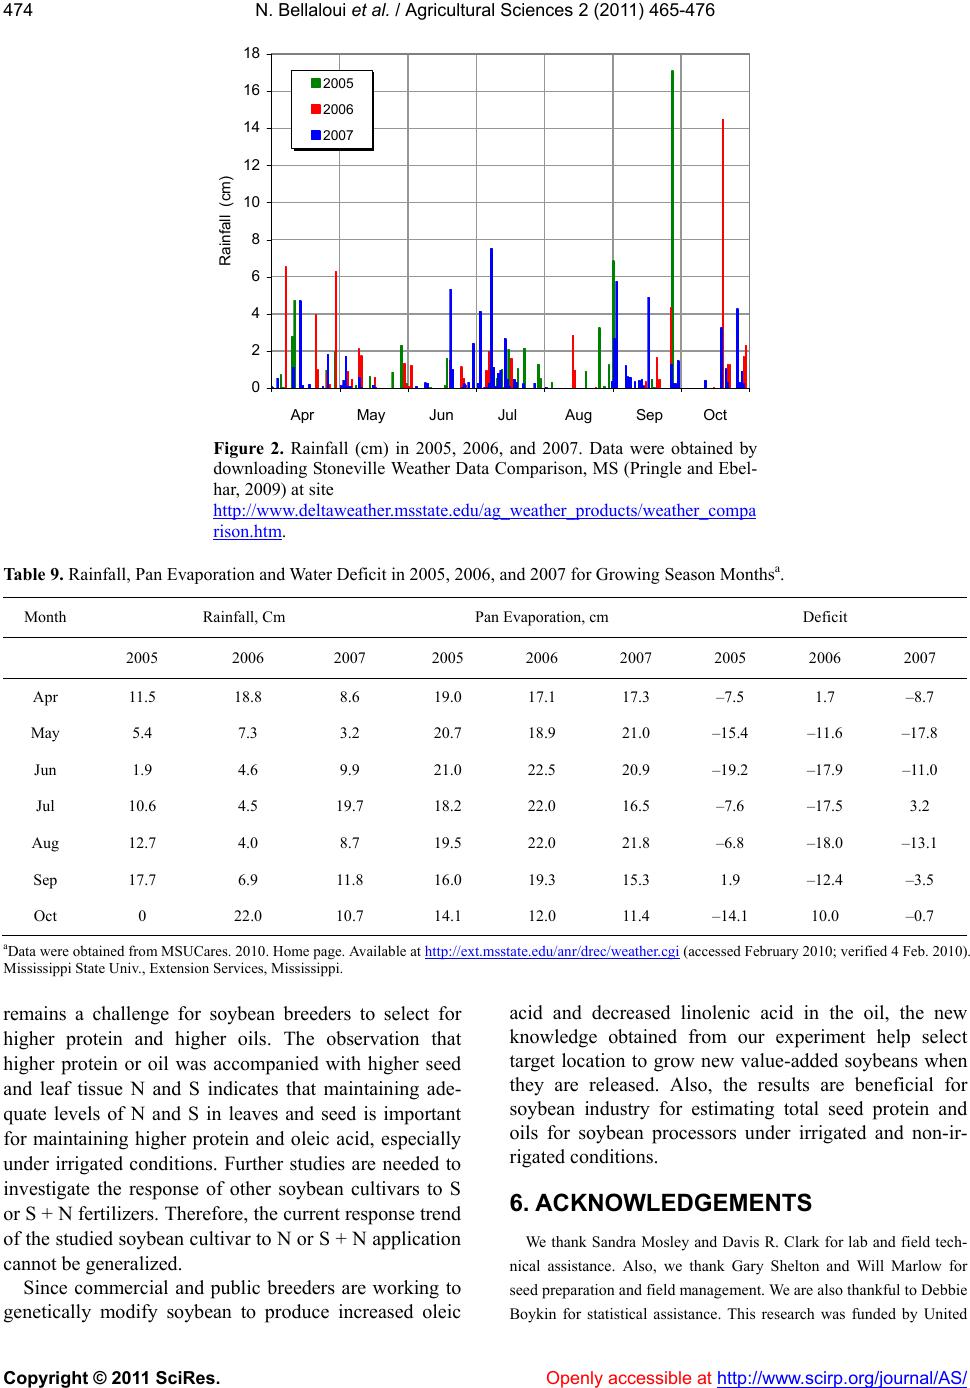 N. Bellaloui et al. / Agricultural Sciences 2 (2011) 465-476 Copyright © 2011 SciRes. Openly accessible at http://www.scirp.org/journal/AS/ 474 0 2 4 6 8 10 12 14 16 18 4 Rainfall (cm) 2005 2006 2007 May JunJul Apr AugSep Oct Figure 2. Rainfall (cm) in 2005, 2006, and 2007. Data were obtained by downloading Stoneville Weather Data Comparison, MS (Pringle and Ebel- har, 2009) at site http://www.deltaweather.msstate.edu/ag_weather_products/weather_compa rison.htm. Table 9. Rainfall, Pan Evaporation and Water Deficit in 2005, 2006, and 2007 for Growing Season Monthsa. Month Rainfall, Cm Pan Evaporation, cm Deficit 2005 2006 2007 2005 2006 2007 2005 2006 2007 Apr 11.5 18.8 8.6 19.0 17.1 17.3 –7.5 1.7 –8.7 May 5.4 7.3 3.2 20.7 18.9 21.0 –15.4 –11.6 –17.8 Jun 1.9 4.6 9.9 21.0 22.5 20.9 –19.2 –17.9 –11.0 Jul 10.6 4.5 19.7 18.2 22.0 16.5 –7.6 –17.5 3.2 Aug 12.7 4.0 8.7 19.5 22.0 21.8 –6.8 –18.0 –13.1 Sep 17.7 6.9 11.8 16.0 19.3 15.3 1.9 –12.4 –3.5 Oct 0 22.0 10.7 14.1 12.0 11.4 –14.1 10.0 –0.7 aData were obtained from MSUCares. 2010. Home page. Available at http://ext.msstate.edu/anr/drec/weather.cgi (accessed February 2010; verified 4 Feb. 2010). Mississippi State Univ., Extension Services, Mississippi. remains a challenge for soybean breeders to select for higher protein and higher oils. The observation that higher protein or oil was accompanied with higher seed and leaf tissue N and S indicates that maintaining ade- quate levels of N and S in leaves and seed is important for maintaining higher protein and oleic acid, especially under irrigated conditions. Further studies are needed to investigate the response of other soybean cultivars to S or S + N fertilizers. Therefore, the current response trend of the studied soybean cultivar to N or S + N application cannot be generalized. Since commercial and public breeders are working to genetically modify soybean to produce increased oleic acid and decreased linolenic acid in the oil, the new knowledge obtained from our experiment help select target location to grow new value-added soybeans when they are released. Also, the results are beneficial for soybean industry for estimating total seed protein and oils for soybean processors under irrigated and non-ir- rigated conditions. 6. ACKNOWLEDGEMENTS We thank Sandra Mosley and Davis R. Clark for lab and field tech- nical assistance. Also, we thank Gary Shelton and Will Marlow for seed preparation and field management. We are also thankful to Debbie Boykin for statistical assistance. This research was funded by United  N. Bellaloui et al. / Agricultural Sciences 2 (2011) 465-476 Copyright © 2011 SciRes. Openly accessible at http://www.scirp.org/journal/AS/ 475475 States Department of Agriculture, Agricultural Research Service, pro- ject number 6402-21000-034-00D. REFERENCES [1] Grieshop, C.M. and Fahey, G.C.Jr. (2001) Comparison of quality characteristics of soybeans from Brazil, China, and the United States. Journal of Agriculture and Food Chemistry, 49, 2669-2673. doi:10.1021/jf0014009 [2] Wilson, R.F. (2004) Seed composition,. In: Boerma, H.R. and Specht, J.E., Eds., Soybeans: Improvement, Produc- tion, and Uses, American Society of Agronomy, Inc., Crop Science Society of America, Inc., Soil Science So- ciety of America, Inc., 621-668. [3] Cherry, J.H., Bishop, L., Hasegawa, P.M. and LeZer, H.R. (1985) Differences in the fatty acid composition of soy- bean seed produced in northern and southern areas of the USA. Phytochemistry , 24, 237-241. doi:10.1016/S0031-9422(00)83527-X [4] Schnebly, S.R. and Fehr, W.R. (1993) Effect of years and planting dates on fatty acid composition of soybean genotypes. Crop Science, 33, 716-719. doi:10.2135/cropsci1993.0011183X003300040016x [5] MSUCares (2011) Home page. Mississippi State Univer- sity, Extension Services, Oktibbeha County. http://ext.msstate.edu/anr/drec/weather.cgi [6] Heatherly, L.G. (1999) Soybean irrigation. In: Heatherly, L.G. and Hodges, H.F., Eds., Soybean Production in the Midsouth, CRC, New York, 119-141. [7] Ray, J.D., Heatherly, L.G. and Fritschi, F.B. (2006) In- fluence of large amounts of nitrogen on nonirrigated and irrigated soybean. Crop Science, 46, 52-60. doi:10.2135/cropsci2005.0043 [8] Bellaloui, N., Mengistu, A. and Paris, R.L. (2008) Soy- bean seed composition in cultivars differing in resistance to charcoal rot (Macrophomina phaseolina). Journal of Agriculture Science, 146, 1-9. doi:10.1017/S0021859608007971 [9] Marschner, H. (1995) Mineral nutrition of higher plants. Academic Press, San Diego, 379-396. [10] Mengel, K. and Kirkby, E.A. (1982) Principle of plant nutrition. International Potash Institute Worblaufen-Bern, Bern, 335-508. [11] Warembourg, F.R. and Fernandez, M.P. (1985) Distribu- tion and remobilization of symbiotically fixed nitrogen in soybean (Glycine max). Physiologia Plantarum, 65, 281- 286. doi:10.1111/j.1399-3054.1985.tb02396.x [12] Fehr, W.R. and Caviness, C.E. (1977) Stages of soybean development. Special Report 80, Iowa Agricultural Ex- periment Station, Iowa Cooperative External Series, Iowa State University, Ames. [13] Panthee, D.R., Pantalone, V.R., Sams, C.E., Saxton, A.M., West, D.R. and Rayford, W.E. (2004) Genomic regions governing soybean seed nitrogen accumulation. Journal of the American Oil Chemists’ Society, 81, 1. [14] Harper, J.E. (1987) Nitrogen metabolism, In: Wilcox, J.R., Ed., Soybeans: Improvements, Production and Uses. Agron. Monogr. 16. ASA, CSSA, and SSSA, Madison, 497-533. [15] Herman, J.C. (1997) How a soybean plant develops. Spec. Report No. 53, Iowa State University, Cooperative Extension Service, Ames. [16] Holshouser, D.L. (1998) Virginia soybean production guide, VA Coop. Ext. Tidewater Agric. Res. and Ext. Cntr. Info. Ser., Blacksburg, No. 408. [17] Bellaloui, N., Hanks, J.E., Fisher, D.K. and Mengistu, A. (2009) Soybean seed composition is influenced by within-field variability in soil nutrients. Crop Manage- ment. http://www.plantmanagementnetwork.org/cm/ [18] Bellaloui, N, Abbas, H.K., Gillen, A.M. and Abel, C.A. (2009) Effect of glyphosate-boron application on seed composition and nitrogen metabolism in glyphosate-re- sistant soybean. Journal of Agriculture and Food Che- mistry, 57, 9050-9056. [19] Bellaloui, N., Reddy, K.N., Gillen, A.M. and Abel, C.A. (2010) Nitrogen metabolism and seed composition as in- fluenced by foliar boron application in soybean. Plant and Soil, 336, 143-155. doi:10.1007/s11104-010-0455-6 [20] Heatherly, L.G., Elmore, C.D., Wesley, R.A. and Spur- lock, S.R. (2001) Row spacing and weed management systems for nonirrigated early soybean production sys- tem planting dates in the midsouthern USA. Crop Sci- ence, 41, 84-791. doi:10.2135/cropsci2001.413784x [21] SAS Institute (2001) SAS 9.1 TS LeVel 1M3, Windows Version 5.1.2600. Cary. doi:10.2135/cropsci2001.41111x [22] Wilcox, J.R. and Shibles, R.M. (2001) Interrelationships among seed quality attributes in soybean. Crop Science, 41, 11-14. [23] Bellaloui, N., Reddy, K.N., Zablotowicz, R.M. and Mengistu, A. (2006) Simulated glyphosate drift influ- ences nitrate assimilation and nitrogen fixation in non- glyphosate-resistant soybean. Journal of Agriculture and Food Chemistry, 54, 3357-3364. doi:10.1021/jf053198l [24] Boydak, E., Alpaslan, M., Hayta, M., Gercek, S. and Simsek, M. (2002) Seed composition of soybeans grown in the Harran region of Turkey as affected by row spac- ing and irrigation. Journal of Agriculture and Food Chemistry, 50, 4718-4720. doi:10.1021/jf0255331 [25] Dornbos, D.L. and Mullen, R.E. (1992) Soybean seed protein and oil contents and fatty-acid composition ad- justments by drought and temperature. Journal of the American Oil Chemists’ Society, 69, 228-231. [26] Bellaloui, N. and Mengistu, A. (2008) Seed composition is influenced by irrigation regimes and cultivar differ- rences in soybean. Irrigation Science, 26, 261-268. doi:10.1007/s00271-007-0091-y [27] Bellaloui, N., Smith, J.R., Ray, J.D. and Gillen, A.M. (2009) Effect of maturity on seed composition in the Early Soybean Production System as measured on near- isogenic soybean lines. Crop Science, 49, 608-620. doi:10.2135/cropsci2008.04.0192 [28] Sinclair, T.R. and DeWitt, C.T. (1975) Photosynthate and nitrogen requirements for seed production by various crops. Science, 189, 565-567. doi:10.1126/science.189.4202.565 [29] Shibles, R. and Sundberg, D.N. (1998) Relation of leaf nitrogen content and other traits with seed yield of soy- bean, Plant Production Science, 1, 3-7. doi:10.1626/pps.1.3 [30] Anderson, J.W. and M.A. (2001) Fitzgerald, physio- logical and metabolic origin of sulfur for the synthesis of seed storage proteins. Journal of Plant Physiology, 158, 447-456. doi:10.1078/0176-1617-00356  N. Bellaloui et al. / Agricultural Sciences 2 (2011) 465-476 Copyright © 2011 SciRes. http://www.scirp.org/journal/AS/Openly accessible at 476 [31] Howell, R.W. and Carter, J.L. (1958) Physiological fac- tors affecting composition of soybeans. II. Response of oil and other constituents of soybeans to temperature un- der controlled conditions. Agronomy Journal, 50, 64-667. doi:10.2134/agronj1958.00021962005000110007x [32] Specht, J.E., Chase, K., Macrander, M., Graef, G.L., Chung, J., Markwell, J.P., Orf, H.H. and Lark, K.G. (2001) Soybean response to water: A QTL analysis of drought tolerance. Crop Science, 41, 493-509. doi:10.2135/cropsci2001.412493x [33] Burton, J.W. (1985) Breeding soybean for improved protein quantity and quality, In: Shibles, R., Ed., World Soybean Research Conference III: Proceedings, Ames, IA. Westview Press, Boulder, 12-17 August, 361-367, [34] Lee, J.D., Oliva, M.L., Sleper, D.A. and Shannon, J.G. (2008) Irrigation has little effect on unsaturated fatty acid content in soya bean seed oil within genotypes differing in fatty acid profile. Journal of Agronomy and Crop Sci- ence, 194, 320-324. doi:10.1111/j.1439-037X.2008.00315.x [35] Bennett, J.O., Yu, O., Heatherly, L.G. and Krishnan, H.B. (2004) Accumulation of genistein and daidzein, soybean isoflavones implicated in promoting human health, is significantly elevated by irrigation. Journal of Agricul- ture and Food Chemistry, 52, 7574-7579. doi:10.1021/jf049133k [36] Maestri, D.M., Labuckas, D.O., Meriles, J.M., Lamar- ques, A.L., Zygadlo, J.A. and Guzman, C.A. (1998) Seed composition of soybean cultivars evaluated in different environmental regions. Journal of the Science of Food and Agriculture, 77, 494-498. doi:10.1002/(SICI)1097-0010(199808)77:4<494::AID-JS FA69>3.0.CO;2-B [37] Piper, E.L. and Boote, K.J. (1999) Temperature and cul- tivar effects on soybean seed oil and protein concentra- tions. Journal of the American Oil Chemists’ Society, 76, 1233-1242. [38] Zhang, M., Kang, M.S., Reese, P.F. and Bhardwaj, H.L. (2005) Soybean cultivar evaluation via GGE biplot ana- lysis. Journal of New Seed, 7, 37-50. doi:10.1300/J153v07n04_03 [39] H.C.III. Pringle and M.W. Ebelhar (2010) Stoneville weather data comparison. Delta Research and Extension Center, Stoneville. http://www.deltaweather.msstate.edu/ag_weather_produc ts/weather_comparison.htm
|