Modern Economy, 2011, 2, 874-879
doi:10.4236/me.2011.25098 Published Online November 2011 (http://www.SciRP.org/journal/me)
Copyright © 2011 SciRes. ME
Security and Development in Developing Countries
Minh Quang Dao
Economics Department, Eastern Illinois University, Charleston, USA
E-mail: mqdao@eiu.edu
Received August 19, 2011; revised Septembe r 25, 2011; accepted Octo ber 10, 2011
Abstract
This paper examines the impact of security on economic development in developing countries. Based on data
from the World Bank, we use a sample of thirty-eight developing economies and find that security does af-
fect development in these countries. We observe that the coefficient estimates of two explanatory variables
do not have their anticipated sign due possibly to the slight degree of multicollinearity between them. Re-
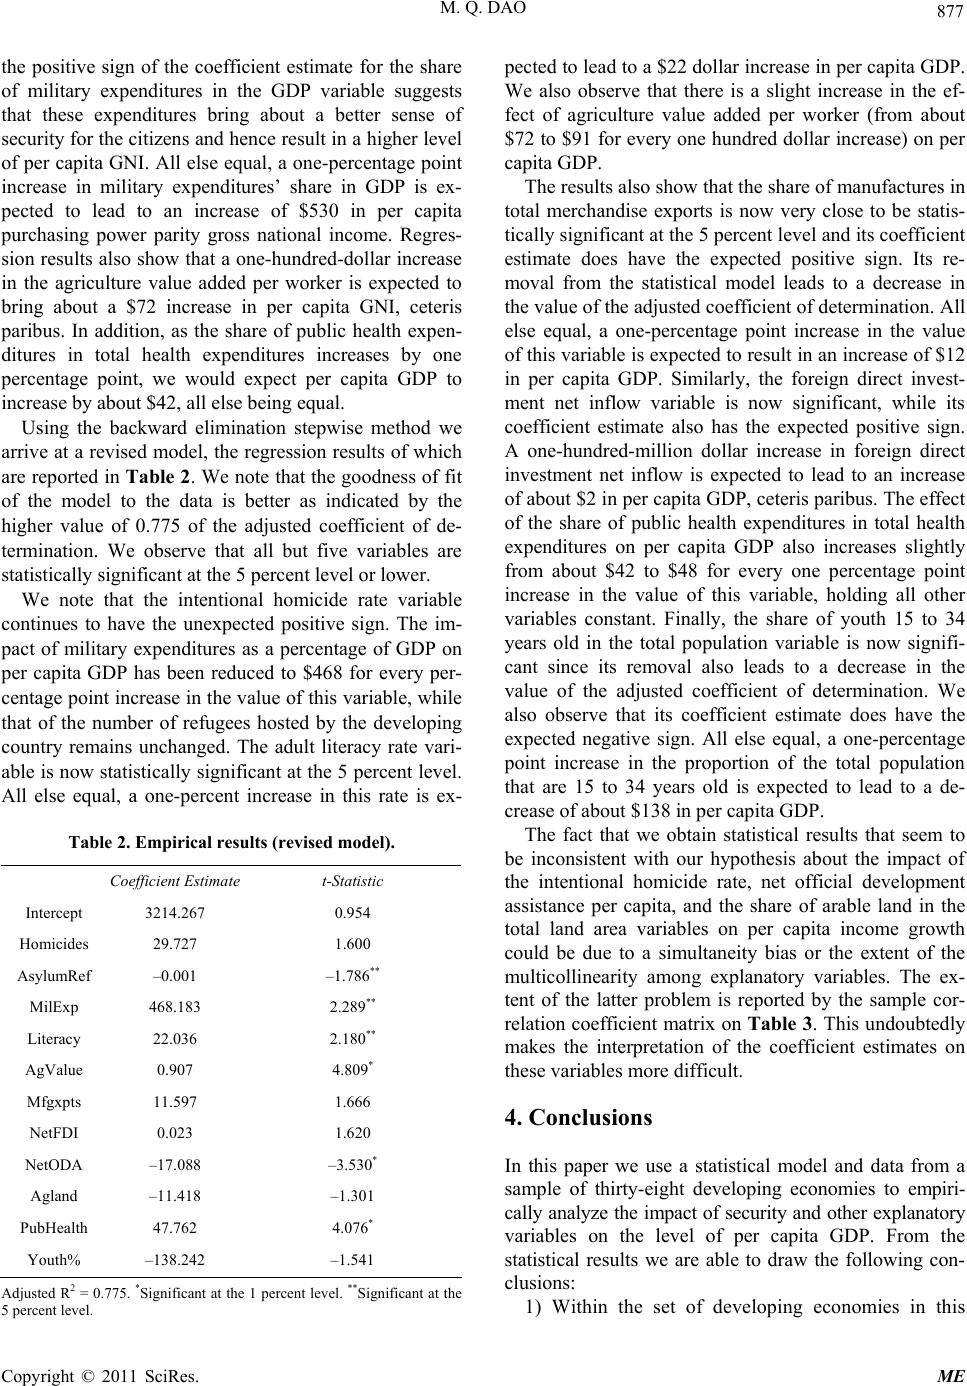
gression results show that over three-quarters of cross-developing country variations in purchasing power
parity per capita gross national income can be explained by its linear dependency on the number of inten-
tional homicides, the number of refugees hosted by a country, military expenditures as a percentage of GDP,
the adult literacy rate, the agricultural value added per worker, the share of manufactures in total merchan-
dise exports, net foreign direct investment, net official development assistance, the share of agricultural land
in the total land area, the share of public health expenditures in total health expenditures, and the share of
youths 15 to 34 years old in the total population. Statistical results of such empirical examination will assist
governments in developing countries identify security and other issues that need to be effectively dealt with
in order to stimulate economic development.
Keywords: Security, Purchasing Power Parity per Capita GNI, Adult Literacy Rate, Intentional Homicides,
Developing Countries, Refugees by Country of Asylum, Military Expenditures.
1. Introduction
The issue of the effect of security on economic develop-
ment has not received sufficient attention in the develop-
ment economics literature. Murdoch and Sandler quantify
the impact of civil wars on economic growth in the home
and neighboring countries [1]. They find that in general
distance measures provide better measures of the diffu-
sion of the negative economic impacts of civil wars on
other countries. They also find that both th e duration and
the timing of civil wars have an economic effect. On the
other hand, Bayer and Rupert examine the effect of civil
war in one country on the total bilateral trade between
the affected country and its trading partners [2]. Using
data for 120 countries between 1950 and 1992 they find
that civil wars reduce bilateral trade among countries by
one-third. Furthermore, these effects also are felt in
neighboring states as well. For each neighbo r in conflict,
a country on its path to development such as Tanzania,
experiences an estimated loss of 0.7 percent of GDP.A
more recent study of 18 Western European countries by
Gaibulloev and Sandler reveals that each additional
transnational terrorist incident decreases their economic
growth by 0.4 of a percentage point each year [3]. De
Groot analyzes the influence of conflict on the econo-
mies of neighboring countries and concludes that conflict
actually has two opposing effects [4]. On the one hand,
directly contiguous countries and conflict countries them-
selves suffer from the negative consequences of proxi-
mate conflict. However, there is also a positive spillover
effect on non-contiguous countries and this effect is lar-
ger for countries that are closer to the conflict country.
De Groot cautions that his results for the most part hold
for the most violent type of conflict. The 2011 World
Development Report offers some advices on how to
move beyond conflict and fragility and secure devel-
opment. One of them is investing in citizen security, jus-
tice, and jobs in order to reduce violence. Thus, the cur-
rent study empirically examines the effect of security on
economic development. Using data from the World Bank
for a sample of thirty-eight1 developing economies for
1The sample consists of the following countries: Armenia, Bangladesh,
Bolivia, Burkina Faso, Cameroon, China, Côte d’Ivoire, Ecuador,
Egypt, El Salvador, Ethiopia, Ghana, Georgia, Guatemala, India, Indo-
nesia, Jordan, Kenya, Moldova, Mongolia, Morocco, Nepal, Nicaragua,
Pakistan, Paraguay, Philippines, Rwanda, Senegal, Sri Lanka, Syrian
Arab Republic, Swaziland, Tanzania, Thailand, Tunisia, Uganda,
Ukraine, Vietnam, and Zambia.
875
M. Q. DAO
the period from 2000 to 2009, we find that neither the
proportion of a coun try’ s popu latio n th at is employed nor
the percentage of male youth population 15 to 34 years
old out of the total population is statistically significant
in explaining economic development in these countries.
We are able to show that over three-quarters of cross-
developing country variations in purchasing power parity
per capita gross national income can be explained by its
linear dependency on the number of intentional homi-
cides, the number of refugees hosted by a country, mili-
tary expenditures as a percentage of GDP, the adult lit-
eracy rate, the agricultural value added per worker, the
share of manufactures in total merchandise exports, net
foreign direct investment, net official development as-
sistance, the share of agricultural land in the total land
area, the share of public health expenditures in total
health expenditures, and the share of youths 15 to 34
years old in the total population. Statistical results of
such empirical examination will help governments in
developing countries identify areas that need special at-
tention in order to foster economic development. This
paper is organized as follows. In the next section, the
formulation of a statistical model to be estimated is dis-
cussed. Theoretical underpinnings for the inclusion of
explanatory variables are presented in this section. Sta-
tistical results are reported in the subsequent section. A
final section gives concluding remarks as well as policy
recommendations.
2. The Statistical Model
If we assume that various exogenous factors linearly af-
fect the level of per capita GDP in a developing country,
we can state the following statistical model:
 
  
 
 
 
01 2
345
?
678
?
910 11
12 13
PPPGNIDeath Homicides
AsylumRefOriginRefMilExp
YouthMaleLiteracyAgValue
GrossKMfgxptsNetFDI
NetODAEmpl
 


 







 


 
14
15 16
oy Agland
PubHealthYouth%



(1)
where PPPGNI = Purchasing Power Parity GNI per
capita, in dollars in 2009.
Death = Number of battle-related deaths in civil wars,
2000-2008.
Homicides = Intentional homicide rate per 100,000
people, for the latest year that data are available, 2000-
2009.
AsylumRef = Number of refug ees hosted by a country
as at the end of 2009.
OriginRef = Number of refugees originating from each
country at the end of 2009.
MilExp = Military expenditure as a percentage of
GDP, in 2009.
YouthMale = Percentage of male youth population 15
to 34 years old, in 2009.
Literacy = Adult literacy rate, in 2008.
AgValue = Agriculture value added per worker,
measured in 2000 dollars, 2005-2007.
GrossK = Gross capital formation as a percentage of
GDP, in 2009.
Mfgxpts = Manufactured exports as a percentage of
total exports, in 2009.
NetFDI = Foreign direct investment net inflows, in
millions of dollars, in 2009.
NetODA = Net official development assistance per
capita, in dollars, in 2008.
Employ = Proportion of a country’s population that is
employed, in 2008.
Agland = Share of land that is arable under permanent
crops and pastures, in 2008.
PubHealth = Public health expenditure as a percent of
total health expend iture, in 2009.
Youth% = Percentage of youth population 15 to 34
years old, in 2009.
From a theoretical standpoint, civil wars adversely
affect per capita income by cutting down the labor force.
To capture this effect we use the number of battle-related
deaths in civil wars as well as the intentional homicide
rate per 100,000 people and expect the coefficient esti-
mate for both these variables to have a negative sign.
Per capita income is also adversely affected when
neighboring countries end up hosting refugees who have
been displaced when the latter had to leave their homes
and thus became a burden for hosting countries. On the
other hand, civil wars also cause natives to seek asylum
elsewhere and in the process reduce the size of the labor
force. We thus expect that the coefficient estimate on
both these variables to have a negative sign.
The effect of military expenditures on per capita GNI
may be ambiguous. On one hand, as government expen-
ditures from productive social overhead capital such as
roads, schools, and bridges are rechanneled to less pro-
ductive defense spending, leading to a decline in per
capita GNI. However, if military expenditures bring
about more citizen security and foster investment in both
human and physical capital, the effect would be an
improvement in the leve l of per cap ita output.
Generally speaking, a developing country with a high
percentage of its population being young usually has a
Copyright © 2011 SciRes. ME
M. Q. DAO
876
lower per capita level of income because labor producti-
vity due to the acq uisition of skills and the accumulation
of human capital tends to vary positively with a work er’s
age. As a result, we expect the coefficient estimate on
this variable to have a negative sign. On the other hand,
the effect of the male youth population on per capita
GDP (or GNI) may be ambiguous since in developing
countries young males tend to participate in the labor
force at an early age and hence contribute positively to
output but at the same time may be a source of militants
and thus engage in activities that may lead to a lower
level of per capita income such as joining gan gs that may
go around extorting businesses or destroying private
property.
To capture the effect of human capital on per capita
GDP we use two variables: the adult literacy rate and the
share of public health expenditures in total health exp en-
ditures. We expect that both these variables will make a
positive impact on the level of per capita income.
Since agriculture still plays an important role in terms
of value added as a percentage of GDP in developing
countries, we choose to include two variables to capture
the contribution of this sector to the economy: the
agricultural value added per worker and the share of total
land area that is arable under permanent crops and
permanent pastures. We expect that these two variables
will exert a positive influence on per capita GDP in a
developing country, all else being equal.
Ideally, we would have liked to use the physical
capital stock as regressor since this is an input used to
produce aggregate output. Unfortunately, data on this
variable is not readily available. As a result, we choose
to include gross capital formation as a percentage of
GDP instead. Since labor is another input used in the
aggregate production function, we use the proportion of a
country’s population that is employed as another expla-
natory variable and expect that this variable and gross
capital formation to have a positive impact on the level
of per capita GDP.
Since it is often the case that developing countries
experience shortages of loanable funds due to their low
saving-to-income ratio, they often need to look beyond
their borders in search of these funds. We thus choose to
include foreign direct investment (FDI) net inflows and
per capita net official development assistance (ODA) to
capture the effect of these external sources of funding on
per capita GDP. We expect that the coefficient estimate
on both these variables to have a positive sign2.
Finally, in order to capture the externality effects of
exports on output in terms of more efficient use of
resources, scale economies, and labor training and “de-
monstration effects”, we add the share of manufactures
in total exports as input in the aggregate production
function and exp ect that this variab le will ex ert a positiv e
impact on per capita GDP. Data for all variables are from
the 2011 World Development Report and the 2011 World
Development Indicators [5,6].
3. Empirical Results
Table 1 gives least-squares estimates of regression coef-
ficients in Equation (1) for a sample of thirty-eight
developing countries. The goodness of fit of the model to
the data is very good as indicated by the value of 0.742
of the adjusted coefficient of determination. We observe
that only six explanatory variables are significant, the
coefficient estimates of two of which do not have the
anticipated sign, namely the intentional homicide rate
and net official development assistance per capita. As the
number of refugees hosted by a developing country
increases by 1000, we would expect a one-dollar de-
crease in purchasing power parity gross national income
per capita, other things being equal. On the other hand,
Table 1. Empirical results (full model).
Coefficient Estimate t-Statistic
Intercept 5148.467 1.008
Battle –0.038 –1.094
Homicides 41.792 1.846**
AsylumRef –0.001 –1.714**
OriginRef –0.001 –0.233
MilExp 530.200 2.186**
YouthMale 282.923 0.607
Literacy 16.688 1.275
AgValue 0.718 2.570*
GrossK 15.031 0.549
Mfgxpts 11.698 1.339
NetFDI 0.017 0.865
NetODA –20.470 –3.464*
Employ –14.228 –0.517
Agland –9.250 –0.930
PubHealth 41.659 3.016*
Youth% –293.839 –1.154
2It is worth noting that Burnside and Dollar find that foreign aid has a
p
ositive effect on growth in developing countries with good fiscal,
monetary, and trade policies while having little effect when poor poli-
cies are present. Our study, rather than looks at the effect of aid on
growth, focuses on its effect on the development, as measured by per
capita GDP [7]. Adjusted R2 = 0.742. *Significant at the 1 percent level. **Significant at the
5 percent level.
Copyright © 2011 SciRes. ME
877
M. Q. DAO
the positive sign of the coefficient estimate for the share
of military expenditures in the GDP variable suggests
that these expenditures bring about a better sense of
security for the citizens and hence resu lt in a higher level
of per capita GNI. All else equal, a one-percentage point
increase in military expenditures’ share in GDP is ex-
pected to lead to an increase of $530 in per capita
purchasing power parity gross national income. Regres-
sion results also show that a on e-hundred-dollar in crease
in the agriculture value added per worker is expected to
bring about a $72 increase in per capita GNI, ceteris
paribus. In addition, as the share of public health expen-
ditures in total health expenditures increases by one
percentage point, we would expect per capita GDP to
increase by about $42, all else being equal.
Using the backward elimination stepwise method we
arrive at a revised model, the regression results of which
are reported in Table 2. We note that the goodness of fit
of the model to the data is better as indicated by the
higher value of 0.775 of the adjusted coefficient of de-
termination. We observe that all but five variables are
statistically significant at the 5 percent level or lower.
We note that the intentional homicide rate variable
continues to have the unexpected positive sign. The im-
pact of military expenditures as a percentage of GDP on
per capita GDP has been reduced to $468 for every per-
centage point increase in the value of th is variable, while
that of the number of refugees hosted by the developing
country remains unchanged. The adult literacy rate vari-
able is now statistically significant at the 5 percent level.
All else equal, a one-percent increase in this rate is ex-
Table 2. Empirical results (revised model).
Coefficient Estimatet-Statistic
Intercept 3214.267 0.954
Homicides 29.727 1.600
AsylumRef –0.001 –1.786**
MilExp 468.183 2.289**
Literacy 22.036 2.180**
AgValue 0.907 4.809*
Mfgxpts 11.597 1.666
NetFDI 0.023 1.620
NetODA –17.088 –3.530*
Agland –11.418 –1.301
PubHealth 47.762 4.076*
Youth% –138.242 –1.541
Adjusted R2 = 0.775. *Sign ificant at the 1 per cent level. **Significant at the
5 percent level.
pected to lead to a $22 dollar increase in per capita GDP.
We also observe that there is a slight increase in the ef-
fect of agriculture value added per worker (from about
$72 to $91 for every on e hundred dollar increase) on per
capita GDP.
The results also show that the share of manufactures in
total merchandise exports is now very close to be statis-
tically significant at the 5 percent level and its coefficient
estimate does have the expected positive sign. Its re-
moval from the statistical model leads to a decrease in
the value of the adjusted coefficien t o f determin atio n. All
else equal, a one-percentage point increase in the value
of this variable is expected to result in an increase of $12
in per capita GDP. Similarly, the foreign direct invest-
ment net inflow variable is now significant, while its
coefficient estimate also has the expected positive sign.
A one-hundred-million dollar increase in foreign direct
investment net inflow is expected to lead to an increase
of about $2 in per capita GDP, ceteris paribus. The effect
of the share of public health expenditures in total health
expenditures on per capita GDP also increases slightly
from about $42 to $48 for every one percentage point
increase in the value of this variable, holding all other
variables constant. Finally, the share of youth 15 to 34
years old in the total population variable is now signifi-
cant since its removal also leads to a decrease in the
value of the adjusted coefficient of determination. We
also observe that its coefficient estimate does have the
expected negative sign. All else equal, a one-percentage
point increase in the proportion of the total population
that are 15 to 34 years old is expected to lead to a de-
crease of about $138 in per capita GDP.
The fact that we obtain statistical results that seem to
be inconsistent with our hypothesis about the impact of
the intentional homicide rate, net official development
assistance per capita, and the share of arable land in the
total land area variables on per capita income growth
could be due to a simultaneity bias or the extent of the
multicollinearity among explanatory variables. The ex-
tent of the latter problem is reported by the sample cor-
relation coefficient matrix on Table 3. This undoubtedly
makes the interpretation of the coefficient estimates on
these variables more difficult.
4. Conclusions
In this paper we use a statistical model and data from a
sample of thirty-eight developing economies to empiri-
cally analyze the impact of security and other explanatory
variables on the level of per capita GDP. From the
statistical results we are able to draw the following con-
clusions:
1) Within the set of developing economies in this
Copyright © 2011 SciRes. ME
M. Q. DAO
Copyright © 2011 SciRes. ME
878
Table 3. Sample correlation coefficient matrix.
Homicides AsylumRef MilExpLiteracyAgValueNetFDINetODAPubHealth Agland Youth%
Homicides 1
AsylumRef –0.105 1
–0.633
MilExp –0.264 0.326 1
–1.646
2.066
Literacy 0.121 –0.170 0.214 1
0.733 –1.034 1.315
AgValue 0.246 0.107 0.367 0.339 1
1.523 0.648
2.368 2.163
NetFDI –0.144 0.092 0.052 0.106 –0.145 1
–0.871 0.552 0.314 0.639 –0.877
NetODA 0.004 –0.232 0.319 0.090 0.134 –0.2821
0.025 –1.430
2.020 0.539 0.810 –1.763
PubHealth 0.107 –0.228 –0.1680.110 –0.003 –0.0110.191 1
0.646 –1.408 –1.0240.663 –0.017 –0.0691.165
Agland 0.074 –0.073 –0.1720.100 0.125 0.045 –0.001 –0.017 1
0.445 –0.440 –1.0480.606 0.757 0.269 –0.008 –0.099
Youth% –0.084 0.104 –0.201–0.026 0.213 –0.2530.027 0.115 0.057 1
–0.506 0.628 –1.234–0.157 1.310 –1.5690.161 0.692 0.344
Note: Bold t-statistics imply statistical significance at the 10 percent or lower leve l.
study, citizen security does play a vital role in foster-
ing economic development. Governments in these coun-
tries need to devise program aimed at lowering the inten-
tional homicide rate while ensuring that their military
expendi- tures are used to provide more security for their
citizens.
2) The international community needs to play an ac-
tive role in helping countries avoid conflict including
civil wars so as to minimize the number of refugees that
are hosted by developing countries since refugee inflows
have the tendency of draining a government’s resources,
while at the same time increasing population growth,
which may lead to a reduction in per capita income.
3) Governments in developing countries need to in-
crease the level of human capital by investing in educa-
tion to improve the adult literacy rate and by playing a
more active role in providing their citizens with an ade-
quate level o f health status. Efforts should also be aimed
at increasing labor productivity in agriculture as well as
enlarging areas of arable land relative to the total land
mass.
4) Governments in these countries also need to solicit
foreign direct investment and encourage a larger share of
manufactures in total merchandise exports. In addition,
programs aimed at controlling population growth through
family planning may result in a lower dependency ratio
and thus bring about more economic development.
5. Acknowledgements
I would like to thank Thi Minh Chi Le for her support
during the completion of this paper.
6. References
[1] J. C. Murdoch, and T. Sandler, “Civil Wars and Eco-
nomic Growth: Spatial Dispersion,” American Journal of
Political Science, Vol. 48, No. 1, 2004, pp. 138-151.
doi:10.1111/j.0092-5853.2004.00061.x
[2] R. Bayer and M. Rupert, “Effects of Civil Wars on Inter-
nationa l Trade,” Journal of Peace Research, Vol. 41, No.
6, 2004, pp. 699-713. doi:10.1177/0022343304047433
[3] K. Gaibulloev and T. Sandler, “Growth Consequences of
Terrorism in Europe,” Kyklos, Vol. 61, No. 3, 2008, pp.
411-424. doi:10.1111/j.1467-6435.2008.00409.x
[4] O. De Groot, “The Spillover Effects of Conflict on Eco-
nomic Growth in Neighboring Countries in Africa,” De-
fence and Peace Economics, Vol. 21, No. 2, 2010, pp.
149-164.
879
M. Q. DAO
[5] World Bank, “World Development Report 2011: Conflict,
Security and Development,” Oxford University Press,
New York, 2011.
[6] World Bank, “World Development Indicators 2011,”
Oxford University Press, New York, 2011.
[7] C. Burnside and D. Dollar, “Aid, Policies, and Growth,”
American Economic Review, Vol. 90, No. 4, 2000, pp.
847-868. doi:10.1257/aer.90.4.847
Copyright © 2011 SciRes. ME