 Modern Economy, 2011, 2, 769-779 doi:10.4236/me.2011.25085 Published Online November 2011 (http://www.SciRP.org/journal/me) Copyright © 2011 SciRes. ME 769 Valuing Watershed Services in Mexico’s Temperate Forests Gustavo Perez-Verdin1*, Jose Navar-Chaidez1, Yeon-Su Kim2; Ramon Silva-Flores3 1Instituto Politécnico Nacional, CIIDIR, Sigma 119, Durango, Mexico 2Northern Arizona University, School of Forestry, Flagstaff, USA 3Forest Consultant, Durango, Mexico E-mail: *guperezv@ipn.mx Received August 11, 2011; revised Septe mber 14, 2011; accepted October 15, 2011 Abstract Water resources are highly valuable in arid, semiarid, or high-altitude areas where the sources are restricted to groundwater or flash floods occurred in short periods of time. In this paper, we present a case study where water is economically valued through nonmarket valuation techniques. A follow-up review of similarly- conducted case studies in Mexico was carried out to evaluate the potential relationships that elevation, mois- ture index, and human development index have over the economic value of water. The main factors influ- encing the value of water in our case study were income, education, age, and family size. Bivariate correla- tions of the case studies in the country suggest that there is no a significant relationship between water value and elevation, although there is some relationship between water value, moisture index, and the human de- velopment index. Dryer areas and more developed communities tend to pay more for an improvement in current water resources conditions. These results can help decision-makers to consider regional policies aimed to improve water management conditions in semiarid and less-developed communities in Mexico. Keywords: Durango, Contingent Valuation, Non-Market Valuation, Moisture Index, Water Scarcity 1. Introduction Water scarcity tends to be critical in high-altitude and semiarid environments [1]. The available water in semi- arid areas is restricted to groundwater, in the form of wells or springs, or flash floods during short periods of time. If natural availability of available water falls below 1000 m3 per capita per year, then critical water scarcity is observed, and constraints to economic development emerge [2]. To spatially represent water availability, [3] modified a moisture measure that Thornthwaite and Mather created in 1955 to identify water scarcity regions. This modified, dimensionless climatic moisture index is a measure of the balance between annual precipitation and potential evapotranspiration and ranges from +1 to –1 with wet climates showing positive values and dry climates negative values. The majority of Mexico’s land area, dominated by mountain scenarios, is classified as semiarid with some areas, particularly in southern Mex- ico, as humid or sub-humid areas [3]. High-elevation areas fulfill important ecological and economic functions for surrounding lowlands. Highlands, (e.g., areas situated 1000 meters above sea level, [4]), provide a range of environmental services to lowlands including irrigation, drinking water, biodiversity, and carbon sequestration, among others, but little is used right there in the highlands [5]. The use of these envi- ronmental services is even more constrained if an area is found in low water availability environments. As indi- cated by Messerli et al., “… the world’s most significant water towers [mountains] are found in arid and semiarid environments.” [6, page 30]. This is particularly true in arid or semiarid areas where the contributions of moun- tains to total discharge accounts for more than 50%, while in humid areas this contribution is less than 50% [4]. Runoff in mountain-based areas is characterized by an extraordinary heterogeneity of topography, vegetation and soils, spatially and temporally differentiated levels of precipitation, as well as annual climate variability [6]. These characteristics make somewhat difficult for high- land residents to retain and use water for domestic, in- dustrial purposes. In many cases, these residents have to pay to bring back products, such as potable water, food, and electricity, when ironically the main input is gener- ated where they live. The economic theory suggests that when more resource inputs are required to supply water to end users, its price rises. It is therefore necessary to 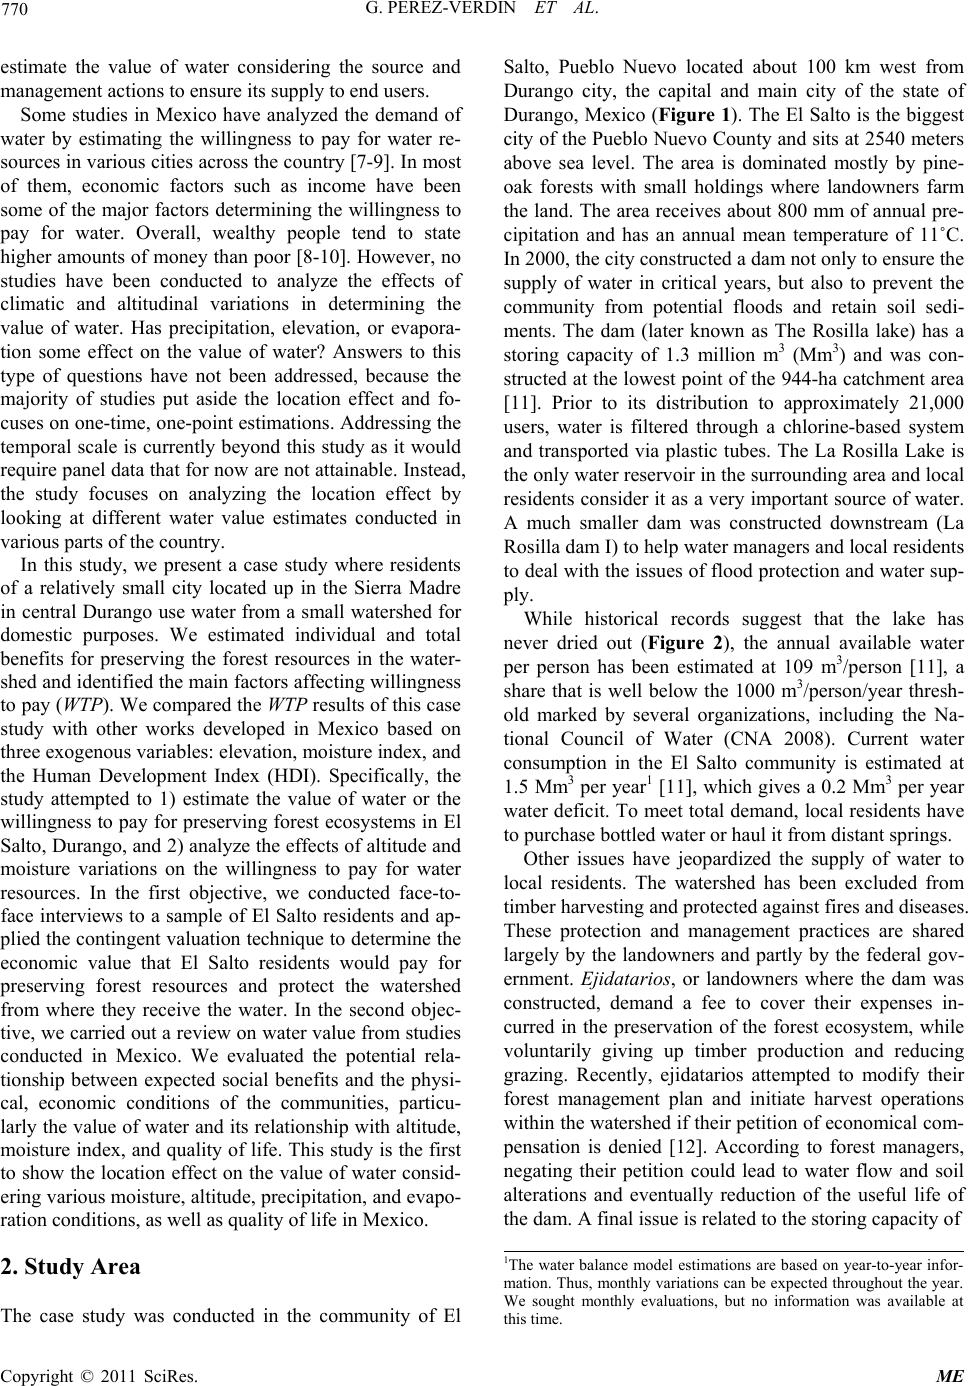 G. PEREZ-VERDIN ET AL. 770 estimate the value of water considering the source and management actions to ensure its supply to end users. Some studies in Mexico have analyzed the demand of water by estimating the willingness to pay for water re- sources in various cities across the country [7-9]. In most of them, economic factors such as income have been some of the major factors determining the willingness to pay for water. Overall, wealthy people tend to state higher amounts of money than poor [8-10]. However, no studies have been conducted to analyze the effects of climatic and altitudinal variations in determining the value of water. Has precipitation, elevation, or evapora- tion some effect on the value of water? Answers to this type of questions have not been addressed, because the majority of studies put aside the location effect and fo- cuses on one-time, one-point estimations. Addressing the temporal scale is currently beyond this study as it would require panel data that for now are not attainable. Instead, the study focuses on analyzing the location effect by looking at different water value estimates conducted in various parts of the country. In this study, we present a case study where residents of a relatively small city located up in the Sierra Madre in central Durango use water from a small watershed for domestic purposes. We estimated individual and total benefits for preserving the forest resources in the water- shed and identified the main factors affecting willingness to pay (WTP). We compared the WTP results of this case study with other works developed in Mexico based on three exogenous variables: elevation, moisture index, and the Human Development Index (HDI). Specifically, the study attempted to 1) estimate the value of water or the willingness to pay for preserving forest ecosystems in El Salto, Durango, and 2) analyze the effects of altitude and moisture variations on the willingness to pay for water resources. In the first objective, we conducted face-to- face interviews to a sample of El Salto residents and ap- plied the contingent valuation technique to determine the economic value that El Salto residents would pay for preserving forest resources and protect the watershed from where they receive the water. In the second objec- tive, we carried out a review on water value from studies conducted in Mexico. We evaluated the potential rela- tionship between expected social benefits and the physi- cal, economic conditions of the communities, particu- larly the value of water and its relationship with altitude, moisture index, and quality of life. This study is the first to show the location effect on the value of water consid- ering various moisture, altitude, precipitation, and evapo- ration conditions, as well as quality of life in Mexico. 2. Study Area The case study was conducted in the community of El Salto, Pueblo Nuevo located about 100 km west from Durango city, the capital and main city of the state of Durango, Mexico (Figure 1). The El Salto is the biggest city of the Pueblo Nuevo County and sits at 2540 meters above sea level. The area is dominated mostly by pine- oak forests with small holdings where landowners farm the land. The area receives about 800 mm of annual pre- cipitation and has an annual mean temperature of 11˚C. In 2000, the city constructed a dam not only to ensure the supply of water in critical years, but also to prevent the community from potential floods and retain soil sedi- ments. The dam (later known as The Rosilla lake) has a storing capacity of 1.3 million m3 (Mm3) and was con- structed at the lowest point of the 944-ha catchment area [11]. Prior to its distribution to approximately 21,000 users, water is filtered through a chlorine-based system and transported via plastic tubes. The La Rosilla Lake is the only water reservoir in the surrounding area and local residents consider it as a very important source of water. A much smaller dam was constructed downstream (La Rosilla dam I) to help water managers and local residents to deal with the issues of flood protection and water sup- ply. While historical records suggest that the lake has never dried out (Figure 2), the annual available water per person has been estimated at 109 m3/person [11], a share that is well below the 1000 m3/person/year thresh- old marked by several organizations, including the Na- tional Council of Water (CNA 2008). Current water consumption in the El Salto community is estimated at 1.5 Mm3 per year1 [11], which gives a 0.2 Mm3 per year water deficit. To meet total demand, local residents have to purchase bottled water or haul it from distant springs. Other issues have jeopardized the supply of water to local residents. The watershed has been excluded from timber harvesting and protected against fires and diseases. These protection and management practices are shared largely by the landowners and partly by the federal gov- ernment. Ejidatarios, or landowners where the dam was constructed, demand a fee to cover their expenses in- curred in the preservation of the forest ecosystem, while voluntarily giving up timber production and reducing grazing. Recently, ejidatarios attempted to modify their forest management plan and initiate harvest operations within the watershed if their petition of economical com- pensation is denied [12]. According to forest managers, negating their petition could lead to water flow and soil alterations and eventually reduction of the useful life of he dam. A final issue is related to the storing capacity of t 1The water balance model estimations are based on year-to-year infor- mation. Thus, monthly variations can be expected throughout the year. We sought monthly evaluations, but no information was available at this time. Copyright © 2011 SciRes. ME  G. PEREZ-VERDIN ET AL. Copyright © 2011 SciRes. ME 771 Figure 1. Location of the El Salto community, Durango. The figure also shows the cities with WTP studies on water resource s in Mexico (see Table 3 for corresponding names). Figure 2. Historical water balance for the La Rosilla lake, near El Salto, Dgo., Mexico. The water balance means the difference between inputs (precipitation) and outputs (eva- poration, infiltration, runoff, etc.). Source: [2] and authors’ research. the lake, which is not enough to cover increased water demand. This concern has been discussed in public meet- ings and ideas such as elevating the dam have been con- sidered [12]. So far, no studies or projects to address this concern have been conducted. 3. Estimating the Value of Water Benefits Research has focused on how to estimate an economic value to environmental services to redirect policies ori- ented for sustainable water management. The intention is to help landowners to reduce the impact of externalities by giving monetary resources and implement best man- agement practices to regulate the quality/quantity of wa- ter [5,13]. The need of economic valuation of water benefits stems from their quasi-public and non-rivalry nature, the presence of externalities, and scales of pro- duction [14,15]. If economic valuation is absent, water benefits will not be provided at optimal levels. The non- exclusive, non-rivalry nature implies that it is difficult, if not impossible, to exclude an individual from using wa- ter benefits (e.g. aquatic habitats, recreation), and several individuals can use the services simultaneously without diminishing each other’s use values. The presence of externalities means that the economic profit of users of these services will not be deviated to compensate pro- viders. And regarding the scale of production, these ser- vices are characterized by economies of scale in produc- tion; the larger the watershed, the lower the marginal costs [16]. The value of water benefits was estimated using the Contingent Valuation (CV) approach. CV is a nonmarket valuation technique used to estimate societal values for public goods [17]. The CV approach employs survey- based techniques to directly elicit households’ prefer- ences and build a contingent market through which re-  G. PEREZ-VERDIN ET AL. 772 spondents may state their willingness to pay/accept for a specified provision change in a particular service [18]. The CV approach first involves describing the current situation of a non-market service, how it can be im- proved, and then asking respondents whether or not they would pay/accept for an improvement/compensation of the specific good [19]. It is called contingent valuation, because people are asked to state their willingness to pay/accept, contingent on a specific hypothetical sce- nario and description of the environmental good [20]. The willingness-to-pay results can then be used by deci- sion makers to weigh policy options. The CV method has been extensively applied to esti- mate water value in many parts of the world. In Mexico, only a few cases can be outlined for altitudinal and cli- mate differences. Among these are the Gutierrez-Villal- pando work in the city of San Cristobal de las Casas, Chiapas, located in southern Mexico, in which they evaluated willingness to pay for an improvement of the riparian ecosystem that supplies water to the city [21]. Also, López-Paniagua et al. used CV to assess the feasi- bility of the development of an environmental market for water in the upper watershed of Rio Tapalpa, Jalisco. This area is located in the Neovolcanic Axis and sits at 1950 m above sea level [7]. A more recent study was finished in 2008 in the city of Ciudad Obregon, Son, near to the Mexico-US border where they evaluated the value of instream flows in the Yaqui river [22]. 3.1. Sample Size and Characteristics of Respondents To estimate the social benefit of an improvement of cur- rent conditions of the Rosilla watershed, we surveyed a sample of local residents of El Salto city. A sample size was calculated using the standard equation for variables subjected to proportions [23]. The sample size was esti- mated at 242 households, with an error proportion of ± 6% and 95% of confidence. Each household was ran- domly selected using a city map and in each household a person, older than 18, was invited to participate in a face- to-face interview2. The questionnaire included three types of general questions: level of knowledge of the quality of the service, willingness to pay (WTP) for a hypothetical scenario, and socioeconomic background of respondents. An open-ended question format was used to elicit local residents’ willingness to pay. The open-ended question was designed in such a way that each respondent openly stated their closest preference towards an improvement of the watershed conditions or not. The reason to use open-ended question (as opposed to referendum format) was because it allows zero value responses which often- times are fairly robust to alternative assumptions made about respondent beliefs [20]. In addition, while there is some evidence that referendum format may minimize hypothetical bias, it is not clear that this format alone can completely eliminate potential bias [24]. Carson and Groves suggest that the choice between open-ended or referendum format, or between bias and variance, comes down to the researcher’s objectives [20]. After providing with information of the watershed and hypothetical scenarios of action and no action in the area, it followed the WTP question, which was stated as fol- lows: “It is important to protect the forests in the Rosilla watershed so they can ensure water supply to El Salto residents. Would you be willing to pay a monthly extra fee to keep preserving the area and secure water supply? Yes/No”. Then, respondents provided their WTP amount of money. The information was collected in 2007 and some of the socioeconomic characteristics of respondents are presented in Table 1. The sample closely resembles the characteristics of the total population of the city. Differ- ences were observed in age, sex, occupation, and marital status. Part of these differences can be explained to sur- vey procedures including the time when the interviews were conducted. The questionnaires were applied during work hours and responded by the person most commonly found in the household at such time. In the majority of cases (62%), the respondents were women, whose char- acteristics increased age and marital status data, but de- creased percentage of occupation3. Table 1. Characteristics of sampled and total population of El Salto residents. Variable Sample (n = 242) El Salto city (N = 21,793)a Percentage of women 62.0 51.4 Average age (years) 41.6 26.6 Household family size (# of people) 5.0 4.6 Average household income (MX$/month) 2988 2937 Gini coefficient 0.34 0.482b Percentage with high school education 21.0 16.7 Percentage of occupation 51.6 68.0 Percentage of married people 73.0 62.9 aSource: Conteo de Población y Vivienda 2005 [25]. bCorresponds to the 2008 national average. 2With random sampling, each household in the city had the same prob- ability of being selected. This characteristic avoided issues related to selection bias and enabled use of statistical theory to make valid infer- ences from the sample to the targeted population [26]. 3Occupation in this study was considered as the type of employment rovided by a public institution or private entrepreneur in which a worker continuously receives a wage. Copyright © 2011 SciRes. ME  773 G. PEREZ-VERDIN ET AL. 3.2. Model Specification to Estimate Water Economic Value We used the ordinary least squares method to fit the pa- rameters included in the model. We first analyzed whether predictors met the restrictions imposed to linear regres- sion models and found that some variables required loga- rithm transformations. We then decided to use a log- linear model to mitigate problems associated with het- erocedasticity, skewness, and high variability of predic- tors [26]. The log functional form with k + 1 predictors was expressed as: 0 Log( )kk wtp x (1) where xk are the predictors, 0 is the intercept, and k is the parameter associated with xk. The mean WTP estimate was given by: 1ˆ m i i WTPeWTP m (2) where is the predicted WT P for person i and m is the number of respondents. Confidence intervals (CI) for ˆ WTP WTP at a 95% confidence level can be calculated using the standard error and applying the typical formula in which CI= 1.96WTP se WTP . Also, for logarithm-trans- formed predictors, the percentage change (∆) (i.e., semi- elasticity) of WTP evaluated at the mean of predictor i was calculated as k ˆ % WTP . For non-transformed predictors, we used the following expression [26]: ˆ ˆ % 100exp1 WTPk k x (3) Equations (1) and (2) were used to estimate the amount of money that person i would be willing to pay for im- proving actual watershed conditions and identify the main variables influencing the choice. Among the factors included in the analysis were income, age, family size, and education. No prior expectations of signs were as- sumed, except for income, in which literature suggests that the probability and amount of WTP increase as in- come also increases [8,9,22]. In order to know not only the expected value of the WTP but also the distribution of the benefits from this potential change, we estimated a probability distribution function of predicted WTP. The fitted probability distri- bution function also allowed us to identify differences between the mean and median due to sample distribution and eventually to choose the best statistics and draw more general conclusions. If non-normal or asymmetric probability distribution functions are expected, the choice between the mean and median has large implications for the desirability of undertaking the provision of the water service and the method of financing it [18]. In this case, the mean WTP was calculated as the area under the probability distribution function and the median was the amount of money in which the probability of accepting such an improvement is 0.5. To do this, we tested various probability functions for predicted WTP and selected the best using the Kolmogorov-Smirnov test [26]. Following Kristrom, the equation that represents the mean for pre- dicted WTP is given by [27] 0 01WTP WTP WTPFA AFA A (4) where is the mean of the predicted WTP, FWTP is a continuous, non-decreasing function (such as the logit or log-logistic model) and A the amount to pay. The me- dian WTP (WTP M) is obtained by solving for A+ in the following equation: WTP 0.5 WTP WTP MFA (5) 3.3. Review of WTP Studies in Mexico In recent years, several studies have been conducted in Mexico to estimate the value of water using non-market valuation techniques. We searched various information sources and found that some studies, which covered from the northern state of Sonora to the southern state of Chiapas (Figure 1), used the CV method to estimate social benefits from water resources. The first informa- tion source involved a literature search from all available databases (e.g. Web of Science) and the web for non- market valuation studies. A brief review of the abstracts and introductions served to select articles directly related to water values and CV. Second, all articles relating to the topic were thoroughly reviewed to identify ecological, social and economic factors that needed to be considered. We also reviewed the citations of published articles to find any unpublished data or papers. The factors identi- fied were coded, georeferenced, and compiled in a data- base. The reason to review WTP studies across the country was to analyze the potential relationship between WTP and the physical, economic conditions of the community. These included the location (altitude), natural availability of water, and quality of life. To the best of our knowl- edge, no studies have been conducted to analyze these types of relationships. Attempting to compare WTP studies was cumbersome due to a diversity of objectives: some estimate the value of water for recreation amenities, others for ecosystem preservation and environmental attributes, and others for improving residential services. Some even were fussy in terms of defining what specific public service was being evaluated. We discarded those studies with multiple objectives and overall WTP esti- mations, and retained those where water value was inde- Copyright © 2011 SciRes. ME  G. PEREZ-VERDIN ET AL. Copyright © 2011 SciRes. ME 774 4. Results pendently, explicitly estimated. We recognized that com- parison across water-related valuation studies may not be appropriate if WTPs from these studies were payments for different purposes (e.g., improving residential service or environmental attributes). But, our goal was to con- sider the diversity of water benefits and compare use and non-use values [28]. 4.1. Willingness to Pay Survey results indicate that the vast majority of respon- dents (90% of the sample) were willing to pay for pre- serving watershed conditions. The amounts ranged from MEX$ 5 to MEX$ 200 per month. The main variables affecting the probability of paying for an improvement were education, age, family size, water bill, and income (Table 2). Older and richer people were more likely to pay more for an improvement of the watershed whereas the amount decreased as respondents had bigger families. Though not significant, there was a slight, positive cor- relation between monthly income and water bill, which suggests in part that people who are now paying more are willing to pay even more, that is, the WTP amount increases as the water bill increases too. Contrary to other studies [8,9], the WTP amount decreased as people are more educated. A possible explanation of this finding is that 70% of the sample reported secondary education as their maximum level of education. In this community, many people drop off school to get a job to contribute to their family’s economy. Being this a rural community, many of these jobs are directly or indirectly related to the forest. We believe that high levels of perception of wa- tershed protection to ensure water supply in less edu- cated people are due to the living experiences in forest- related jobs. During the survey, we asked respondents about the importance of forests in providing the water they consume; the answer, on a scale from 1 (not impor- tant) to 10 (very important), was 4% higher in those who had low-levels of education than those with higher lev- els. In reviewing these works, we tried to find out the value of water benefits based on the main priorities of users and non-market valuation techniques. We focused on the characteristics of local (physical and economic) conditions and the stated amount of money residents gave to water for personal or environmental uses. The physical and socioeconomic conditions were grouped into three variables: elevation, moisture index, and a Human Development Index (HDI). Elevation is meas- ured in meters above sea level while the moisture index is based on both monthly precipitation (PT) and evapora- tion (EV) data [3]. The expression used to calculate the moisture index (MI) was: 1vT IEP (6) The closer the MI gets to +1, the wetter the area. Data of elevation and moisture index were obtained from a spatially-published database by the National Institute of Geography. The HDI is a common measure used to rank societies as a function of life expectancy, education, and per capita gross domestic product [29,30]. Even though the HDI measure has been criticized because it fails to address ecological factors, it has been used as a standard measure to classify economies based on their individual perform- ance [31]. The HDI index goes from 0 to 1, where higher values mean higher economic development. The HDI data were taken from the National Council of Population [32]. To have a better perspective of the model, we esti- mated the elasticity of predictors. These coefficients are Table 2. Ordinary least squares estimates of the log-linear functional form for El Salto residents. Variable MeanCoefficient t-ratio Elasticity (%) Constant –0.905 –0.856 Age (# of years) 41.010.013 2.52 1.34 Education (1 primary; 2 secondary: 3 high school; 4 college; 5 posgrade) 2.48–0.112 –2.41 –10.62 Family size (# of individuals) 4.98–0.071 –2.08 –6.84 Water bill (MX$) 33.180.008 2.92 0.803 Log Income (MX$) 7.850.455 3.41 0.455 Number of observations 242 Adjusted R2 0.14  775 G. PEREZ-VERDIN ET AL. interpreted as percentages of change of the independent variable on WTP (Equation (3)). For example, a one per- cent increase in family size, ceteris paribus, the WTP amount decreased by 6.8%. Also, one percent increase in the age of respondents also increased the amount by 1.3%. Increases or decreases in the water bill have a mar- ginal impact on WTP. The income effect is also signifi- cant but marginal; after taking off the logarithm effect, a unit increase in the mean income, holding all else con- stant, increases the WTP amount by 0.45%. Mean WTP estimated through Equation (2) resulted in MEX$ 19.24 with a confidence interval of MEX$ 17.86 to 20.61 per month. Other statistics showed that pre- dicted WTP values had some asymmetric distribution (skewness = 3.7 and kurtosis = 21.5), which strengthened our idea of taking a closer look at the measures of central tendency. To get the best probability distribution func- tion of predicted WTP, we simulated various probability functions and obtained the best fit using the Kolmo- gorov-Smirnov test. Results indicate that the best fit was obtained through the log-logistic model. Using Equations (4) and (5), mean and median WTP for predicted WTP were MEX$ 19.20 and 17.11 per month, respectively (Figure 3). The mean WTP is the area under the distribu- tion function whereas the median WTP represents the probability that half of the sample accept an improve- ment, i.e. when the probability of saying yes is 50%. Note that the mean WTP is practically the same in both procedures. Differences between the mean and median are due to an asymmetric distribution of benefits of the water ser- vice improvement [33]. In this case, a portion of the sam- ple did not see substantial benefits with the policy change, but the rest is willing to pay considerable amounts to keep preserving the ecosystem watershed. There have been various studies debating about which measure should be used in contingent valuation studies [34-37]. The mean is very sensitive to the right tail of the distribution; that is, to responses of higher bidders [35]. Hanemann suggests that if the mean is to be used, a probability distribution function estimation such as the one used here, is to be applied [36]. In addition, the mean WTP is recommendable when it is necessary to estimate a total value and when benefits are being compared with opportunity costs [33]. Due to these reasons, the WTP for this study was based on the mean value (Figure 3). The total benefits for the whole city, considering 5689 occupied households [25], was MEX$ 1.31 million/year (US$ 100,826/year) with a confidence interval of MEX$ 1.22 and MEX$ 1.41 million/year. 4.2. The Value of Water in Other Environments We found some differences between our WTP results and those obtained elsewhere in Mexico. The overall WTP mean was MEX $73 while El Salto gave MEX $19. Figure 3. Log-logistic probability distribution function of predicted WTP for El Salto Residents. The Kolmogorov-Smirnov statistics was 0.036 with p = 0.95, thus the null hypothesis of data coming from the specified distribution cannot be rejected. lso shown the values of the three parameters estimated in the fitting. A Copyright © 2011 SciRes. ME  G. PEREZ-VERDIN ET AL. 776 Mean elevation, MI, and HDI were 1498 m, 0.781, and 0.117, whereas for El Salto were 2540 m, 0.774, and 0.25, respectively (Table 3). To evaluate a potential rela- tionship between water value and each of the factors, and considering the low number of case studies, we per- formed simple bivariate correlations (Figure 4). Overall, no significant association was found between WTP and elevation (r = –0.27, p = 0.37). The lack of significant correlation between elevation and WTP can be explained in part by the great diversity of topographic conditions where large cities, such as Mexico City, located in high altitude areas, have high levels of demand, and probably are willing to pay large amounts of money for the water they use. Mexico City residents for example consume water at a rate of 64 cubic meters per second (m3/s) while the supply has been estimated at 54 m3/s [8]. Their WTP estimates suggest a high latent demand and value percep- tion over policies aimed to improve water service4. The moisture index (MI), a measure of dryness, had a significant inverse correlation with WTP (r = –0.64, p = 0.02). Cities located in dryer environments tend to pay higher values for water services than wetter cities. This finding coincides with that of the economic theory in which individuals pay higher amounts of money for scarce resources. In contrast, the HDI, a measure of the quality of life, has a direct relationship with WTP (r = 0.64, p = 0.02). Cities with better quality of life standards tend to give higher values than less-developed cities. Figure 4 shows individual relationships between WTP and each factor. The exploratory results of these types of relationships can help resource managers to consider regional-aimed policies to improve water management conditions in arid and less-developed communities in Mexico. 5. Conclusions This research presented a case study where water is eco- nomically valued using non-market valuation methods. Residents of a rural community in Durango, Mexico par- ticipated in face-to-face interviews to help estimating total social benefits about the preservation of the forest ecosystem from which they obtain their potable water. Contingent valuation was used to estimate the amount of money residents were willing to pay for preserving the forests of the Rosilla watershed. A log-linear model and probability density function were used to estimate mean WTP. Results showed that the majority of respondents (90% of the sample) are willing to pay for preserving watershed conditions. Mean WTP estimated using Equa- tion (2) was estimated at MEX$ 19.2/month (US$ 1.5/ month) with a confidence interval of MEX$ 17.86 to 20.61. The main factors influencing acceptance of the payment were income, education, age, family size, and water bill. The total benefit for the entire population was estimated at MEX$ 1.31 million/year (US$ 100,826/ year). Based on the analysis of WTP studies developed so far in Mexico, there was no significant relationship between elevation and WTP. The analysis was based on several cities distributed in an altitudinal gradient from 10 to 2540 m above sea level including Mexico City, the world’s third largest metropolitan area, located at 2240 m. According to the national water agency, a moderate pro- portion of high-altitude areas in Mexico shows similar deficits of water supply [2] and their residents, as evi- denced by the Mexico City case, are probably willing to pay large amounts of money to compensate for these deficits. Large WTP amounts were also registered in low- altitude cities such as La Paz and Alamos. Based on our analysis, the topographic heterogeneity of the country, where almost 55% of the total population lives above the 1000-m elevation line [25], made elevation not impor- tant to determine the value of water. Results provided evidence that the moisture and hu- man development indexes are statistically correlated with WTP. Dryer areas and more developed communities tend to pay more for improved water resources. The moisture index finding coincides with basic economic theory which suggests that scarce resources are more appreci- ated. Regarding HDI finding, there is an increasing de- bate whether communities with better quality of life are more likely to contribute to ecosystem preservation. Some argue that economic growth and conservation are incompatible goals, but others say that wealthier com- munities have the luxury of investing more heavily in efforts to ecosystem conservation [44,45]. To have a more comprehensive conclusion it is necessary more studies that analyze the relationship between WTP and human development index or other type of economic growth metrics. The analysis presented in this explorative study moti- vates us to continue investigating the relationship be- tween water value and exogenous variables based on non-market valuation methods in Mexico. Adding more studies should reinforce the decision-making process of correctly allocating financial resources for different pur- poses such as improving current management and distri- bution systems, protecting high-value watersheds, or providing water to low-income families. 6. Acknowledgements 4Water in Mexico City is pumped from a 1600-m to 2200-m elevation differential to reach users [2]. We thank CONACYT and the Instituto Politecnico Na- Copyright © 2011 SciRes. ME  777 G. PEREZ-VERDIN ET AL. Table 3. Cities with WTP estimations for water in Mexico. Study site Water attributea Elevation (meters) Moisture indexb Human Development Indexc Adjusted WTP (US$/month)d Source of WTP estimations 1. Ciudad Obregon, SON E, R 35 0.146 0.834 6.12 [22] 2. San Luis Rio Colorado, SON E 40 0.055 0.826 6.39 [38] 3. Parral, CHIH R 1,620 0.089 0.810 8.915e [9] 4. El Salto, DGO E 2,540 0.250 0.733 2.08 This study 5. Tapalpa, JAL E 1,950 0.135 0.732 9.10f [7] 6. Mexico City, DF R 2,240 0.064 0.849 15.81g [8] 7. San Cristobal de las Casas, CHIS R, E 2,120 0.306 0.752 1.82 [21] 8. Tepetlaoxtoc, EDOMEX E 2300 0.088 0.751 4.98 [39] 9. Oaxaca, OAX E 1555 0.105 0.834 3.11 [40] 10. Tlaxco, TLAX E 2588 0.074 0.743 1.83 [41] 11. Metztitlan, HGO E 2080 0.091 0.686 0.45 [42] 12. Alamos, SON E 400 0.046 0.706 8.23 [43] 13. La Paz, BCS R 10 0.048 0.817 10.15 [10] aWater use: E: Environmental/protection; R: Residential service. bBased on average precipitation and evaporation data. cBased on county-level estimations by CONAPO (National Council of Population). dFebrurary-2010 price levels (US$ 1 = MEX$ 13, average annual inflation rate = 4.4%). eOpen-ended question. No certainty correctionf Includes domestic sector only. gAverage across five income groups and improvement scheme. (a) (b) (c) Figure 4. Relationships between WTP and (a) elevation, (b) moistur e inde x, and (c) human development index. cional for partially funding this study. The ejido La Vic- toria and CNA provided valuable forest inventory and climatic data, respectively. Our thanks also go to El Salto residents for participating in the interviews. Part of this study was presented at the 2010 ACES conference in Phoenix, AZ. We thank attendees for constructive inputs. 7. References [1] K. Froehlich and Y. Yurtserver, “Isotope Techniques for Water Resources in Arid and Semiarid Regions. Applica- tion of Tracers in Arid Zone Hydrology,” Proceedings of the Vienna Symposium, August 1994, Vol. 232, 1995, pp. 3-12. [2] CNA (Comisión Nacional del Agua), “Estadísticas del Agua en México. Edición 2008. SEMARNAT,” Talleres Gráficos, México, 2008 [3] C. J. Willmott and J. J. Feddema, “A More Rational Cli- matic Moisture Index,” The Professional Geographer, Vol. 44, No. 1, 1992, pp. 84-88. doi:10.1111/j.0033-0124.1992.00084.x [4] D. Vivirolli, R. Weingartner and B. Messerli, “Assessing the Hydrological Significance of the World’s Moun- tains,” Mountain Research and Development, Vol. 23, No. 1, 2003, pp. 32-40. [5] S. Pagiola, J. Bishop and N. Landell-Mills, “La Venta de Servicios Ambientales. Mecanismos Basados en el Mercado Para la Conservación y Desarrollo,” INE-SEMARNAT, Mexico, 2003. [6] B. Messerli, D. Viviroli and R. Weingartner, “Mountains of the World: Vulnerable Water Towers for the 21st Century,” Ambio, Vol. 33, No. 13, 2004, pp. 29-34. [7] C. Lopez-Paniagua, M. J. González-Guillén, J. R. Valdez-Lazalde and H. M. de los Santos, “Demanda, Disponibilidad de Pago y Costo de Oportunidad Hídrica en la Cuenca Tapalpa, Jalisco,” Madera y Bosques, Vol. 13, No. 1, 2007, pp. 3-23. [8] M. G. Soto and I. J. Bateman, “Scope Sensitivity in Households’ Willingness to Pay for Maintained and Im- proved Water Supplies in a Developing World Urban Copyright © 2011 SciRes. ME  G. PEREZ-VERDIN ET AL. 778 Area: Investigating the Influence of Baseline Supply Quality and Income Distribution upon Stated Preferences in Mexico City,” Water Resources Research, Vol. 42, 2006, pp. 1-15. [9] W. F. Vasquez, P. Mozumder, J. Hernandez-Arce and R. P. Berrens, “Willingness to Pay for Safe Drinking Water: Evidence from Parral, Mexico,” Journal of Environmental Management, Vol. 90, No. 11, 2009, pp. 3391-3400. doi:10.1016/j.jenvman.2009.05.009 [10] G. Aviles-Polanco, L. Huato-Soberanis, E. Troyo-Dieguez, B. Murillo-Amador, J. L. Garcia-Hernandez and L. F. Beltran-Morales, “Valoración Económica del Servicio Hidrológico del Acuífero de La Paz, B.C.S.: Una Valora- Ción Contingente del Uso de Agua Municipal,” Frontera Norte, Vol. 22, No. 43, 2010, pp. 103-128. [11] R. Silva-Flores, G. Perez-Verdin and J. J. Navar-Chaidez,. “Valoración Económica de los Servicios Ambientales Hidrológicos en El Salto, P.N., Durango,” Madera y Bosques, Vol. 16, No. 1, 2010, pp. 31-49. [12] R. Silva-Flores, “Valoración Económica de Los Servicios Ambientales Hidrológicos en el Ejido La Victoria, Pueblo Nuevo, Dgo,” Tesis Maestría, Instituto Politécnico Nacio- nal, CIIDIR—DGO, Durango, 2007. [13] C. Muñoz-Piña, A. Guevara and J. M. T. y J. Braña, “Paying for the Hydrological Services of Mexico’s For- ests: Analysis, Negotiations and Results,” Ecological Economics, Vol. 65, No. 4, 2008, pp. 725-736. doi:10.1016/j.ecolecon.2007.07.031 [14] K. A. Brauman, C. Gretchen, T. K. Duarte and H. M. Mooney, “The Nature and Value of Ecosystem Services: An Overview Highlighting Hydrologic Services,” Annual Review of Environmental and Resources, Vol. 32, 2007, pp. 67-98. doi:10.1146/annurev.energy.32.031306.102758 [15] E. Plottu and B. Plottu, “The Concept of Total Economic Value of Environment: A Reconsideration within a Hier- archical Rationality,” Ecological Economics , Vol. 61, No. 1, 2007, pp. 52-61. doi:10.1016/j.ecolecon.2006.09.027 [16] S. K. Pattanayak, “Valuing Watershed Services: Concepts and Empirics from Southeast Asia,” Agriculture, Ecosys- tems and Environment, Vol. 104, No. 1, 2004, pp. 171- 184. doi:10.1016/j.agee.2004.01.016 [17] F. Schlapfer, “Contingent Valuation: A New Perspective,” Ecological Economics, Vol. 64, No. 4, 2008, pp. 729-740. doi:10.1016/j.ecolecon.2007.10.010 [18] R. C. Mitchell and R. T. Carson, “Using Surveys to Value Public Goods: The Contingent Valuation Method,” Re- sources for the Future, Washington, DC, 1989. [19] K. J. Boyle, “Contingent Valuation in Practice”. In: P. A. Champ, K. J. Boyle and T. C. Brown, Eds., A Primer on Nonmarket Valuation, Kluger Academic Publishers, Nor- well, 2003, pp. 111-169. doi:10.1007/978-94-007-0826-6_5 [20] R. T. Carson and T. Groves, “Incentive and Informational Properties of Preference Questions,” Environmental & Resource Economi cs, Vol. 37, No. 1, 2007, pp. 181-210. doi:10.1007/s10640-007-9124-5 [21] V. Gutierrez-Villalpando, “Valoración Económica del Agua Potable en la Zona Urbana de San Cristóbal de las Casas, Chiapas,” Tesis de Maestría, El Colegio de la Frontera Sur, San Cristóbal de las Casas, 2006 [22] M. I. Ojeda, A. S. Mayer and B. D. Solomon, “Economic Valuation of Environmental Services Sustained by the Yaqui River Delta,” Ecological Economics, Vol. 65, No. 1, 2008, pp. 155-166. doi:10.1016/j.ecolecon.2007.06.006 [23] M. L. Rea and R. A. Parker, “Designing and Conducting Survey Research: A Comprehensive Guide,” Jossey-Bass Publishers, San Francisco, 1992. [24] J. Murphy, G. Allen and T. Stevens, “A Meta-Analysis of Hypothetical Bias in Stated Preference Valuation,” Envi- ronmental and Resource Economics, Vol. 30, No. 3, 2005, pp. 313-325. doi:10.1007/s10640-004-3332-z [25] INEGI (Instituto Nacional de Estadística, Geografía e Informática), “II Conteo de Población y Vivienda por Localidad,” Disco Compacto, México, 2005 [26] J. M. Woolridge, “Introductory Econometrics, a Modern Approach,” Thomson South-Western, Mason, 2006. [27] B. Kristrom, “Spike Models in Contingent Valuation,” American Journal of Agricultural Economics, Vol. 79, No. 3, 1997, pp. 1013-1023. doi:10.2307/1244440 [28] A. M. Freeman III, “The Measurement of Environmental and Resource Values. Theory and Methods,” Resources for the Future Press, Washington, DC, 2003. [29] UNDP (United Nations Development Programme), “In- dice de Desarrollo Humano Municipal en Mexico,” Mex- ico, 2010. http://www.undp.org.mx/desarrollohmano/eventos/images/ CuadernilloIDHMM.pdf [30] UNDP (United Nations Development Programme), “Hu- man Development Report. Overcoming Barriers: Human Mobility and Development,” Palgrave Macmillan, New York, 2009. [31] A. D. Sagar and A. Najam, “The Human Development Index: A Critical Review,” Ecological Economics, Vol. 25, No. 3, 1998, pp. 249-264. doi:10.1016/S0921-8009(97)00168-7 [32] CONAPO (Consejo Nacional de la Población) “Indices de Desarrollo Humano 2000,” Mexico, 2010. http://www.conapo.gob.mx/publicaciones/indicesoc/IDH 2000/dh_Indices.pdf [33] M. Kniivila, V. Ovaskainen and O. Saastaimoinen, “Costs and Benefits of Forest Conservation: Regional and Local Comparisons in Eastern Finland,” Journal of Forest Economics, Vol. 8, No. 2, 2002, pp. 131-150. doi:10.1078/1104-6899-00008 [34] W. M. Hanemann, “Welfare Evaluations in Contingent Valuation Experiments with Discrete Responses,” American Journal of Agricultural Economics, Vol. 66, No. 3, 1984, pp. 332-341. doi:10.2307/1240800 [35] W. M. Hanemann, “Valuing the Environment through Contingent Valuation,” The Journal of Economic Perspec- tives, Vol. 8, No. 4, 1994, pp. 19-43. doi:10.1257/jep.8.4.19 Copyright © 2011 SciRes. ME  G. PEREZ-VERDIN ET AL. Copyright © 2011 SciRes. ME 779 [36] W. M. Hanemann and B. Kanninen, “The Statistical Analysis of Discrete-Response CV Data,” In: I. J. Bate- man and K. G. Willis, Eds., Valuing Environmental Pref- erences: Theory and Practice of the Contingent Valuation Method in the US, EU, and Developing Countries, Ox- ford University Press, New York, 1999, pp. 302-441. [37] E. Camacho-Cuena, A. Garcıa-Gallego, N. Georgantzıs and G. Sabater-Grande, “An Experimental Test of Re- sponse Consistency in Contingent Valuation,” Ecological Economics, Vol. 47, No. 2-3, 2003, pp.167-182. doi:10.1016/S0921-8009(03)00192-7 [38] E. Sanjurjo, “Aplicación de la Metodología de Valoración Contingente Para Determinar el Valor que Asignan los Habitantes de San Luís Río Colorado a la Existencia de Flujos de Agua en la Zona del Delta del Río Colorado,” Dirección de Economía Ambiental, INE-SEMARNAT, Mexico, 2006 [39] M. J. Jimenez-Moreno, “Valoración de Algunos Recursos Naturales, Para Conocer la Disponibilidad de Pago por Servicios Ambientales en el Municipio de Tepetlaoxtoc,” Tesis, Universidad Autónoma Chapingo, Chapingo, 2004. [40] A. Garcia-Angeles, “Valoración Económica de los Servi- Cios Ambientales de Santa Catarina Ixtepeji, Distrito de Ixtlán, Oaxaca,” Tesis, Universidad Autónoma Chapingo, Chapingo, 2006. [41] L. M. Orozco-Paredes, “Balance Hidrológico y Valoración Económica de la Producción de agua en la Microcuenca del Río Zahuapan, Tlaxco, Tlax,” Tesis, Universidad Autónoma Chapingo, Chapingo, 2006. [42] R. Monroy-Hernandez, “Valoración Económica del Servicio Ambiental Hidrológico en la Reserva de la Biosfera Barranca de Metztitlán, Hidalgo,” Tesis, Universidad Autónoma Chapingo, Chapingo, 2008. [43] L. B. Chan-Yam, “Valoración Económica del Agua Para Conocer la Disponibilidad de Pago en Comunidades Pre- sentes en ÁPFF Sierra Álamos—Rio Cuchujaqui, Álamos, Sonora,” Tesis, Universidad Autónoma Chapingo, Cha- pingo, 2007. [44] S. Dietz and W. N. Adger, “Economic Growth, Biodiver- Sity Loss and Conservation Effort,” Journal of Environ- mental Management, Vol. 68, No. 1, 2003, pp. 23-35. doi:10.1016/S0301-4797(02)00231-1 [45] J. Mills and T. A. Waite, “Economic Prosperity, Biodi- versity Conservations, and the Environmental Kuznets Curve,” Ecological Economics, Vol. 68, No. 7, 2009, pp. 2087-2095. doi:10.1016/j.ecolecon.2009.01.017
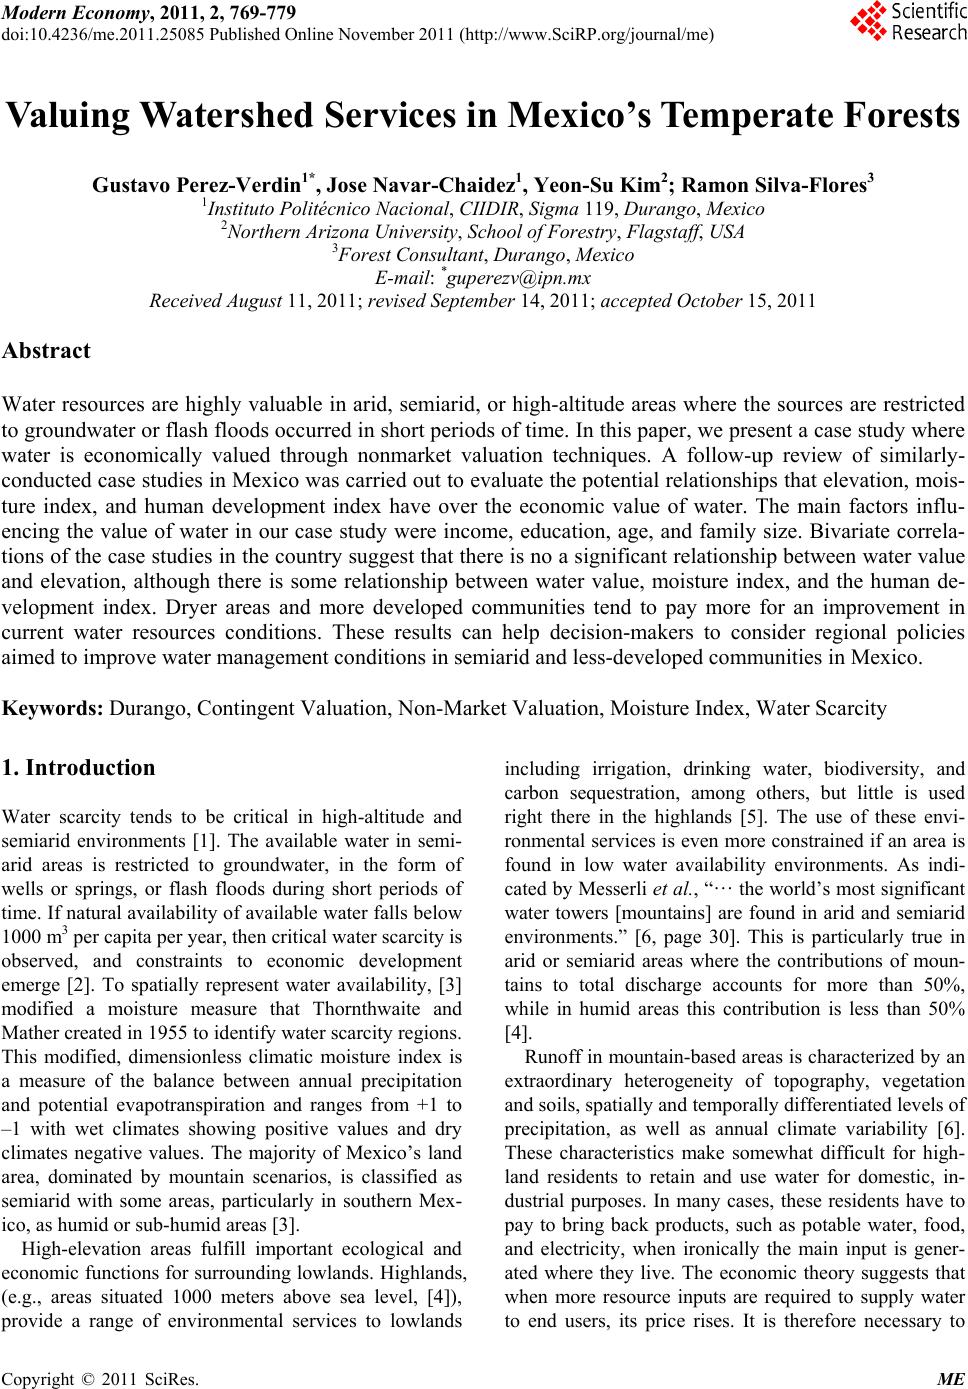
|