 Modern Economy, 2011, 2, 743-756 doi:10.4236/me.2011.25083 Published Online November 2011 (http://www.SciRP.org/journal/me) Copyright © 2011 SciRes. ME 743 Interest-Rate Setting at the ECB Following the Financial and Sovereign Debt Crises, in Real-Time Florence Bouvet1, Sharmila King2 1Department o f Eco nomics, Sonom a St at e Un iversi t y, Rohnert Park, USA 2Department o f Eco nomics, University of the Pacific, Stockton, USA E-mail: bouvet@sonoma.edu, sking 1@pacific.edu Received August 13, 2011; revised Septe mber 16, 2011; accepted October 26, 2011 Abstract We analyse European Central Bank (ECB) policy by estimating a forward-looking, augmented Taylor rule using expectations data. Specifically, we investigate the impact of the financial and sovereign debt crises on ECB policy. We find the European Overnight Index Average (EONIA) rises when expected economic activ- ity is strong. Regardless of the inflation measure, inflation is not associated with the EONIA. Using a recur- sive estimation and a Chow test, we identify a policy shift in December 2008. The more generally accepted starting date of the crisis, August 2007, does not correspond to a statistically significant shift in the ECB policy. Using December 2008 for a policy shift, general financial market sentiment, as measured by VSTOXX, is not significant in explaining EONIA movements. The ECB’s response to a shock to economic activity has been more moderate since the crises. However, the EONIA increases as Greek sovereign risk rises, possibly from increasing demand for liquidity by banks. Keywords: Taylor Rule, EONIA, ECB, Financial Crisis, Sovereign Debt Crisis 1. Introduction The purpose of this paper is to investigate the interest- rate setting process of the European Central Bank (ECB) between January 1999 and May 2011 and more specifi- cally its inter-bank interest-rate response to the recent financial and sovereign debt crises. The magnitude of the recent crises has led the Federal Reserve and ECB to undertake unprecedented measures to mitigate the effects of the crises [1]. For instance, the ECB relaxed its collat- eral rules by accepting Greek government bonds, despite their credit-rating downgrade. According to Article 127 of the Lisbon Treaty on the Functioning of the European Union, the primary objec- tive for the ECB is medium-term price stability.1 The ECB’s Governing Council defines price stability as a year-on-year increase in the Harmonized Index of Con- sumer Prices (HICP) for the euro area of below, but close to 2%. Given that monetary policy affects the economy with lags, to maintain price stability, ECB acts in a for- ward-looking manner [2].2 ECB policy is tailored to the changing economic landscape of the euro area and may be altered according to economic shocks hitting the euro- wide economy. Since policy decisions at the ECB are often opaque and the minutes from the policy meetings are not pub- licly available, estimating the ECB’s reaction function to macroeconomic conditions should provide insight into its behaviour. Numerous papers have estimated a Taylor policy rule for the ECB, but many of these papers’ esti- mates are based on limited time-series data. Longer time series data should provide a more accurate estimate of the ECB’s rule with greater variation in the ECB’s re- sponse to economic shocks [3-5]. In this paper, we analyze the ECB interest-rate policy and its responses to economic shocks, specifically to the recent 2007-2009 financial crisis and the current sover- eign debt crisis. We use the Euro Over-Night Index Av- erage (EONIA) rate as a proxy for the ECB’s policy be- haviour. The EONIA rate is the weighted average of in- ter-bank offer rates on inter-bank loans, which the ECB 1Formerly Article 105 (1) in the Maastricht Treaty. 2Decisions are achieved by cross-checking two pillars: monetary analy- sis and economic analysis. Monetary analysis is based on the idea that inflation is primarily an excess money phenomenon and the analysis involves monitoring monetary conditions in the euro area. The second illar, “economic analysis” consists of reviewing a wide range of eco- nomic and financial indicators, such as overall output, fiscal policy, wages, inflation forecasts, yield curve, exchange rate, business and consumer surveys, and asset prices.  F. BOUVET ET AL. 744 controls. It is a benchmark rate for the unsecured money market and it is the rate most closely linked to the repo rate. We develop a forward-looking generalized method of moments (GMM) model that we estimate using ex- pectations data from the ECB, European Commission, and The Economist. In particular, we examine whether these two crises have affected the importance of several macroeconomic variables in the ECB’s interest-rate set- ting. Our main contributions to the literature are the exami- nation of interest-rate setting following the financial and sovereign-debt crises and identifying whether these two crises induced structural breaks in ECB policy-making. We analyze the possible effects of the crises in three dis- tinct ways. First, we control for the financial crisis using a general market sentiment indicator, the European “fear index” VSTOXX. Second, we test for the impact of the sovereign debt crisis on ECB interest-rate setting using sovereign risk premia for Greece and Ireland. Finally, in order to identify parameter shifts, we run a rolling esti- mation of our Taylor rule specification. Through this visual exercise, we identify a possible shift occurring in December 2008. We then test for this shift in ECB policy by adding to our specification interaction terms with a crisis dummy variable. We choose two starting points for the crisis: December 2008 and August 2007 which Trichet [1] describes as the beginning of the financial turmoil. We find that the EONIA moves with expected eco- nomic activity. In addition, regardless of whether we use the expected inflation rate or consumer inflation expecta- tions, the EONIA is not strongly associated with the in- flation rate. This is in contrast to other papers that use the 3-month EURIBOR [6,7]. We argue that the 3-month EURIBOR encompasses inflationary expectations (infla- tion risk) since it has a 3 month-term to maturity on in- ter-bank loans compared to the overnight inter-bank loans rate (EONIA). To identify a structural break in the data we run a recursive estimation on our model and find a parameter shift in December 2008, not August 2007. This result is consistent with the events unfolding in the euro-area at the time. We also find that the EONIA rises as Greek risk rises, reflecting perhaps an increase in banks' liquidity preference. However, the EONIA falls as Irish risk rises. We argue that our results reflect the un- derlying difference behind the debt crises for Greece and Ireland. Given the focus of this paper, we do not examine the ECB’s recent use of non-conventional monetary in- struments to mitigate the effects of the financial and sov- ereign crises. However, as we proceed to argue, some of these non-conventional ECB interventions are captured by movements in the EONIA. This paper proceeds as follows: in Section 2 we pro- vide a brief perspective of contributions to this topic in the U.S. and in Europe. In Section 3 we discuss our em- pirical methodology and data. Our results are reported in Section 4. Finally, the last section summarizes and con- cludes. 2. Previous Work 2.1. Background on Interest Rate Rules There has been a shift in empirical research towards pol- icy rules describing central bank behavior, such as the Taylor rule [8], specifically: ** π πππ ttttytt ir yy (1) where i is the target nominal interest rate, r is the real equilibrium interest rate at full employment, π* is the inflation target and y* is potential real GDP and π , are positive parameters. Taylor postulated that * t πr , and π 2 0.5 y . In fact, comparisons between the interest rate predicted by Taylor’s rule mirrors the actual federal funds rate for the 1987-1992 period. Numerous additional studies have been generated mo- difying Taylor’s original monetary policy rule. Clarida, Gali and Gertler [9] propose a forward-looking Taylor rule by replacing the current inflation, rate, πt, with the expected inflation rate 12 months ahead, Et[πt+12] (see Equation (2) below). The key justifications for the for- ward-looking Taylor rule are the long and variable lags in the monetary policy transmission mechanism.3 t ** π12 12 π[π]π[] tttttytt irEEy y (2) Orphanides [10] notes, however, that forecasts using ex post or revised data would not yield the same esti- mates associated with data available to the Federal Open Market Committee (FOMC) at the time when policy is decided. Instead, the FOMC uses Greenbook forecasts4 or real-time data5 to set the Federal Funds rate. Specifi- cally, estimates derived using real-time data point to a forward-looking rule as the correct specification and not a backward looking rule. In addition to modifications of the Taylor rule, the es- timated coefficients’ reliability has been called into ques- tion. Central banks typically adjust interest rates in smaller increments than implied by the rule.6 The debate in the literature is whether the statistical significance of a 3For a survey of the literature see the Journal of Economic Perspectives symposium: Journa l o f Economic Perspectives 9 (Fall 1995). 4The Greenbook is produced before each meeting of the Federal Open Market Committee. Given assumptions on monetary policy, the Board of Governors prepares projections on future economic activity. 5Real-time data reflects, at each date (say May 2002), exactly what the macroeconomic data looked like at that date, May 2002. Copyright © 2011 SciRes. ME  745 t F. BOUVET ET AL. lagged dependent variable in the policy rule is due to “interest rate smoothing” or due to the central bank’s response to serially correlated exogenous shocks [11]. 2.2. Monetary Policy Rules and Central Bank Behaviour in Europe Monetary policy rules have also been estimated for Eu- ropean central banks. Prior to the introduction of the euro, researchers estimated rules for national central banks in the European Union (EU): some examined the effect of Bundesbank policy on monetary policy in other Euro- pean nations [12,13]; while others compiled “euro-area data” using GDP weights for participating countries [5]. Following research developments on the Federal Re- serve policy rule, the focus of research in Europe shifted to developing forward-looking policy rules for the ECB [3,4,6,13]. Most papers found that the nominal interest rate rises by more than the increase in the inflation rate (an inflation stabilizing policy), and that the output gap is a significant factor in setting the short-term interest rate. Further, in accordance with Orphanides [10], studies estimating the ECB’s reaction function have used Euro- pean real-time [5,6,14]. Consistent with Orphanides [10], they find that estimates derived from ex post data provide unrealistic or biased estimates of actual historical policy. While many papers estimating a forward-looking rule simply included a 12-month lead of inflation and of the output gap in the policy rule, Gerlach [9,15] and Gorter et al. [6] use 12-month expectations data for inflation and output growth. For example, Gerlach [9] uses an economic sentiment indicator (ESI) as the measure for real economic activity because he notes that the ECB Monthly Bulletins never mention an output gap but rather business and consumer confidence. Previous studies7 on European policy rules typically use the European Over-Night Index Average (EONIA) as the ECB’s indicator of monetary policy. This average interest rate is calculated from banks participating in the inter-bank euro-zone market (these maybe EU banks or non-EU banks). Like the U.S. Federal Funds rate, this interest rate is serves as a benchmark for other interest rates. There are a few exceptions however. Carstensen [16] and Gerlach [9] use the repo rate, the main refi- nancing operations (MRO) rate as their policy indicator8 and Gorter et al. [6] use the 3-month EURIBOR. The 3- month EURIBOR is simply the inter-bank rate on inter- bank loans with a 3-month maturity. There have been a few studies examining the effects of the recent financial crisis on ECB policy. In most cases, the empirical analysis of the crisis consists of identifying the starting month of the financial crisis and to assess whether the crisis induced a structural shift in the ECB monetary policy rule. Gerlach [15] estimates an ordered logit model and splits his sample in June 2008 to exam- ine the shift in ECB policy during the financial crisis. He finds that the ECB employed steep cuts in the repo rate that were mostly due to a decline in economic activity and a shift in the ECB’s reaction function. Gorter et al. [7] split their sample June 1998-December 2007 and June 1998-August 2010. They find no evidence of a shift in policy and but find that the ECB focuses more on in- flation in the post-crisis sample compared to the pre- crisis sample period. Belke and Klose [17] extend the standard Taylor rule to include credit growth, yield curve, and stock price inflation. They split their sample from January 1999-January 2007 and August 2007-June 2009.9 They find that the ECB does react to changes in credit growth and the yield curve during the post-crisis period compared to the pre-crisis period. One drawback of their analysis is the relatively short time period (23 observa- tions) in the post-crisis sample. To examine ECB behaviour during the crisis, we use a different set of variables and methodologies that proxy the developments of the financial and sovereign debt crises. Furthermore, our sample extends from January 1999-May 2011 so we can better capture the on-going developments in Greece and Ireland. 3. Data and Empirical Methodology 3.1. Empirical Methodology Besides controlling for economic activity and inflation developments, we augment the baseline Taylor rule model with an interest-rate smoothing term [18] and other economic variables which proxy the economic shocks of the financial crisis and sovereign debt crisis which might affect the interest setting policy of the cen- tral bank.10 01 π12 12 [π][] tttt ytttx ii EEy X [3] where t is the EONIA. 12 , 12t, t iπty denote re- spectively the expected inflation rate, expected real eco- nomic activity, and other economic variables used to 6This is perhaps due to minimized excessive volatility in short term rates to encourage capital market stability and to raise central ban credibility. During 2001, the Federal Reserve lowered the Federal Funds Rate eleven times from 6.5% to 1.75%. 7Such as Fendel and Frenkel [4], Sauer and Sturm [3], Belke and Klose [15]. 8Since the repo rate is adjusted in increments of 25 basis points an ordered probit or logit model is warranted. 9They do not use data from February 2007 to July 2007 to distinguish the pre-crisis sample from the post-crisis sample. 10Castelnuovo [18] shows that the lagged interest rate in the euro area is due to interest rate smoothing rather than omitted economic shocks. Copyright © 2011 SciRes. ME  F. BOUVET ET AL. 746 assess expectations about other economic and financial developments. We estimate our model using Generalized Method of Moments (GMM). To check the validity of the GMM estimation, we test the endogeneity of the instrumented variables (if the test statistic is significant, the variables being tested must be treated as endogenous). Our set of instrumental variables for the expected inflation rate and economic activity include lagged values of these two variables (lag 2, t-2) which are known to the ECB at the time monetary policy is decided. Additional lags of the endogenous variables as instruments are redundant.11 In the empirical analysis that follows, we test for the presence of unit roots in the data. We find that, although the presence of a unit root cannot be rejected for all the variables (with the exception of VSTOXX), it can how- ever be explained in terms of structural breaks. We therefore follow the convention adopted in the existing literature and assume stationarity for all the variables used in the estimations. Gorter et al. [6] also find evi- dence of non-stationarity and treat their variables as sta- tionary, arguing that “from an economic point of view, the arguments for stationarity are very strong, as there has been a stable monetary regime in place with a fixed inflation objective”. We do not run our model in first differences, so our estimates are directly comparable to previous work in the literature. 3.2. Data We use monthly data spanning from January 1999 to May 2011, but some of the series are only available until February 2011 (see Table 1). Our dependent variable is the EONIA. The EONIA rate is the weighted average of inter-bank offer rates on inter-bank loans, which the ECB controls. As shown in Figure 1, it is more closely linked to the repo rate than the 3-month EURIBOR used in other papers, and it signals the stance of monetary policy in the euro-area [20]. While the EONIA is not directly set by the ECB, the EONIA co-moves with the repo rate during normal economic times. For example, before Au- gust 2007, the correlation coefficient between the repo rate and the EONIA was 0.99. After May 2009 the cor- relation drops to 0.75. The ECB maintained the repo rate at 1% between April 2009 and April 2011, i.e . during the unfolding of the European sovereign debt crisis however, the EONIA continued to fall well below 1% and began to track the ECB deposit rate of 0.25% [21], thus causing the correlation between the interest rates to drop. Despite this drop in the correlation, we still believe the EONIA remains a better proxy of the ECB’s interest rate policy Figure 1. Interest rates in the Euro Area (changing compo- sition), January 1999-June 2011. Source: elaboration on data from ECB website. than the repo rate. Using the repo rate to examine the effects of the financial and sovereign debt crises on ECB policy is problematic since the ECB does not alter this rate while the crisis is developing. Instead, the ECB has extended unlimited liquidity to banks in need of liquidity to ensure the smooth functioning of financial system. Consequently, the EONIA is a more useful indicator of monetary policy and better captures the impact of the ECB’s unlimited liquidity-provision on the money mar- ket. Figure 2 shows data on the EONIA and the mone- tary base for the euro-area. The graph shows the drop in the EONIA, while the monetary base rises erratically following the liquidity-provisions extended by the ECB. Real-time, expectations data (the Economic Sentiment Index and Consumer Confidence Indicator) are obtained from two main sources: the ECB and the European Commission. This is an experimental dataset constructed to provide historical vintages of data published in the Monthly Bulletin [22]. The dataset includes monthly data available to the ECB on the working day preceding each first monthly Governing Council’s meeting.12 Expected 11Excluded instruments are redundant if the asymptotic efficiency o the estimation is not improved by using them (Baum et al., [19]). Figure 2. EONIA and Monetary Base), January 1999-June 011. Source: elaboration on data from ECB website. 2 Copyright © 2011 SciRes. ME 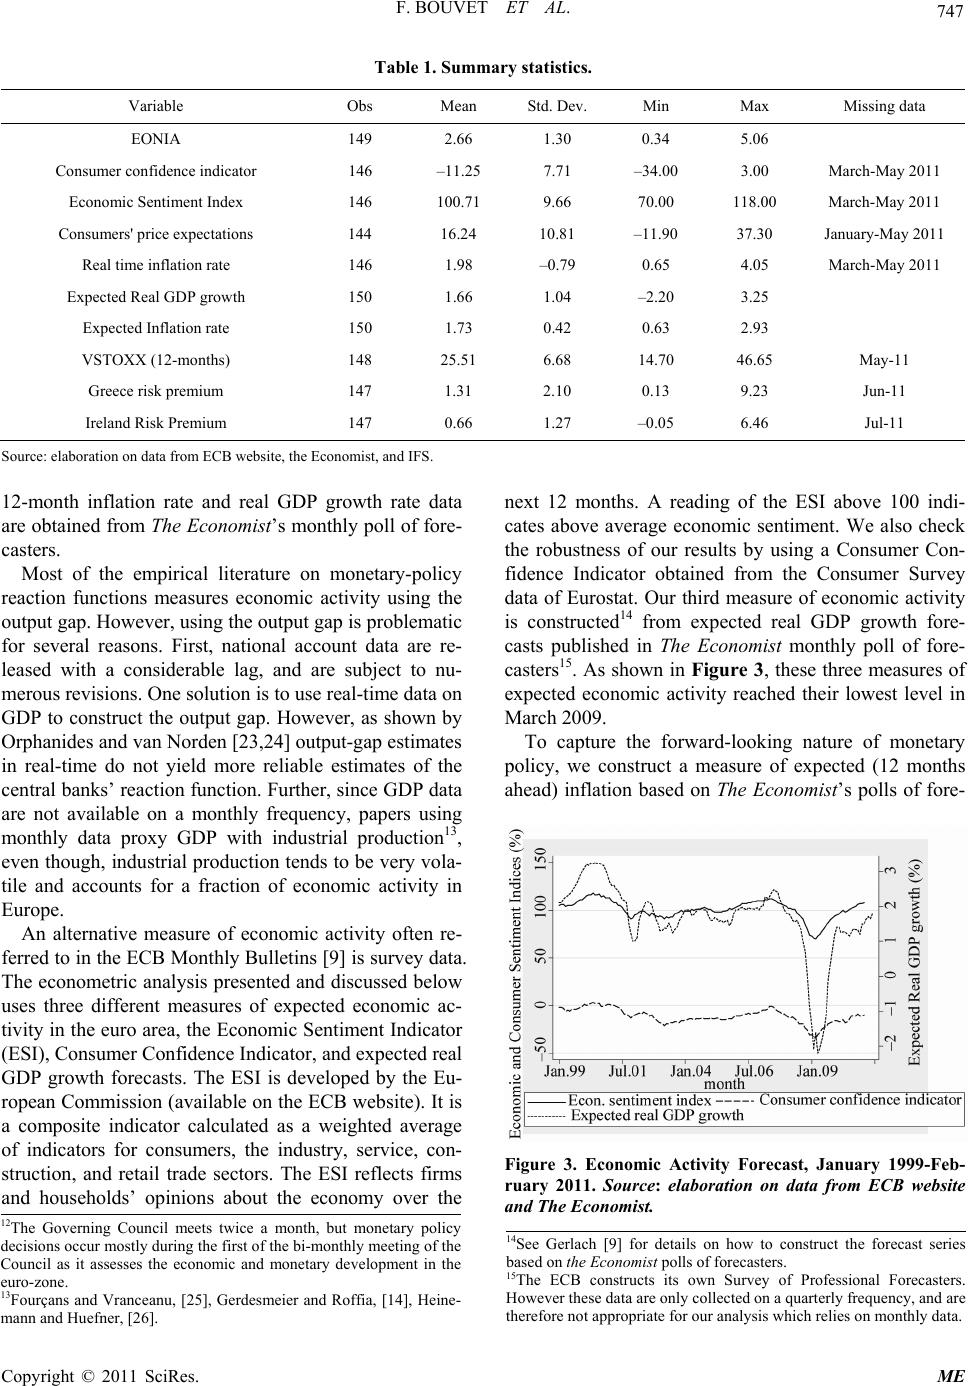 F. BOUVET ET AL. Copyright © 2011 SciRes. ME 747 Table 1. Summary statistics. Variable Obs Min Max Missing data Mean Std. Dev. EONIA 149 2.66 1.30 0.34 5.06 Consumer e indicator – March-My 2011 1 C Eh Ma11 confidenc146 11.25 7.71 –34.00 3.00 a Economic Sentiment Index 146 100.71 9.66 70.00 18.00 March-May 2011 onsumers' price expectations144 16.24 10.81 –11.90 37.30 January-May 2011 Real time inflation rate 146 1.98 –0.79 0.65 4.05 March-May 2011 xpected Real GDP growt150 1.66 1.04 –2.20 3.25 Expected Inflation rate 150 1.73 0.42 0.63 2.93 VSTOXX (12-months) 148 25.51 6.68 14.70 46.65 y- Greece risk premium 147 1.31 2.10 0.13 9.23 Jun-11 Ireland Risk Premium 147 0.66 1.27 –0.05 6.46 Jul-11 Source: elabowebsite, the Econnd IFS. next 12 months. A reading of the ESI above 100 indi- ration on data from ECB omist, a 12-month inflation rate and real GDP growth rate data are obtained from The Economist’s monthly poll of fore- casters. Most of the empirical literature on monetary-policy reaction functions measures economic activity using the output gap. However, using the output gap is problematic for several reasons. First, national account data are re- leased with a considerable lag, and are subject to nu- merous revisions. One solution is to use real-time data on GDP to construct the output gap. However, as shown by Orphanides and van Norden [23,24] output-gap estimates in real-time do not yield more reliable estimates of the central banks’ reaction function. Further, since GDP data are not available on a monthly frequency, papers using monthly data proxy GDP with industrial production13, even though, industrial production tends to be very vola- tile and accounts for a fraction of economic activity in Europe. An alternative measure of economic activity often re- ferred to in the ECB Monthly Bulletins [9] is survey data. The econometric analysis presented and discussed below uses three different measures of expected economic ac- tivity in the euro area, the Economic Sentiment Indicator (ESI), Consumer Confidence Indicator, and expected real GDP growth forecasts. The ESI is developed by the Eu- ropean Commission (available on the ECB website). It is a composite indicator calculated as a weighted average of indicators for consumers, the industry, service, con- struction, and retail trade sectors. The ESI reflects firms and households’ opinions about the economy over the cates above average economic sentiment. We also check the robustness of our results by using a Consumer Con- fidence Indicator obtained from the Consumer Survey data of Eurostat. Our third measure of economic activity is constructed14 from expected real GDP growth fore- casts published in The Economist monthly poll of fore- casters15. As shown in Figure 3, these three measures of expected economic activity reached their lowest level in March 2009. To capture the forward-looking nature of monetary policy, we construct a measure of expected (12 months ahead) inflation based on The Economist’s polls of fore- Figure 3. Economic Activity Forecast, January 1999-Feb- ruary 2011. Source: elaboration on data from ECB website and The Economist. 12The Governing Council meets twice a month, but monetary policy decisions occur mostly during the first of the bi-monthly meeting of the Council as it assesses the economic and monetary development in the euro-zone. 13Fourçans and Vranceanu, [25], Gerdesmeier and Roffia, [14], Heine- mann and Huefner, [26]. 14See Gerlach [9] for details on how to construct the forecast series based on the Economist polls of forecasters. 15The ECB constructs its own Survey of Professional Forecasters. However these data are only collected on a quarterly frequency, and are therefore not appropriate for our analysis which relies on monthly data. 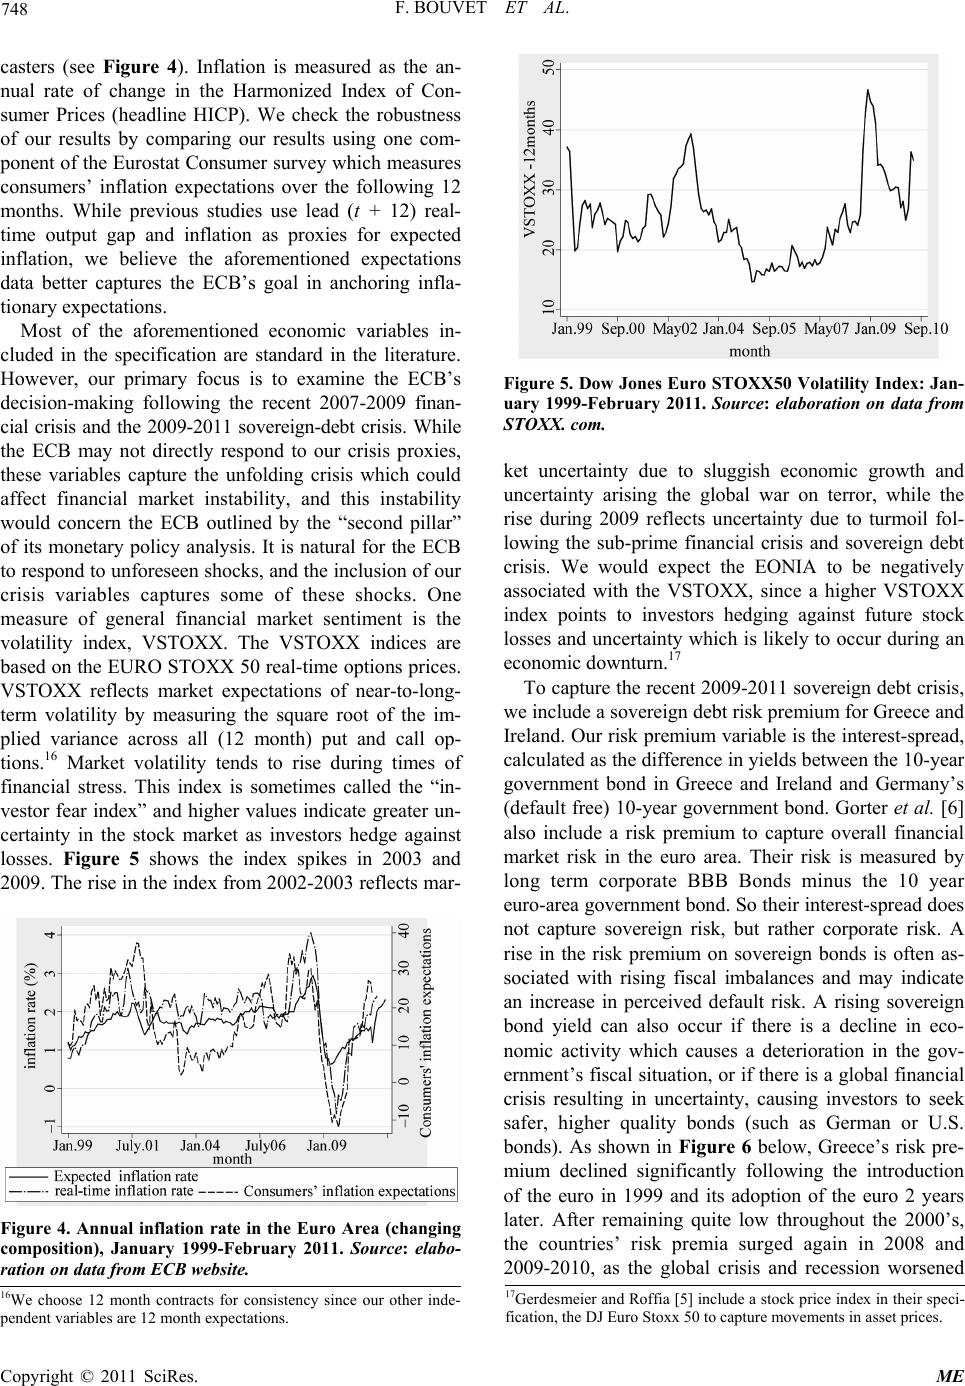 F. BOUVET ET AL. 748 casters (see Figure 4). Inflation is measured as the an- nual rate of change in the Harmonized Index of Con- sumer Prices (headline HICP). We check the robustness of our results by comparing our results using one com- ponent of the Eurostat Consumer survey which measures consumers’ inflation expectations over the following 12 months. While previous studies use lead (t + 12) real- time output gap and inflation as proxies for expected inflation, we believe the aforementioned expectations data better captures the ECB’s goal in anchoring infla- tionary expectations. Most of the aforementioned economic variables in- cluded in the specification are standard in the literature. rket expectations of near-to-long- te However, our primary focus is to examine the ECB’s decision-making following the recent 2007-2009 finan- cial crisis and the 2009-2011 sovereign-debt crisis. While the ECB may not directly respond to our crisis proxies, these variables capture the unfolding crisis which could affect financial market instability, and this instability would concern the ECB outlined by the “second pillar” of its monetary policy analysis. It is natural for the ECB to respond to unforeseen shocks, and the inclusion of our crisis variables captures some of these shocks. One measure of general financial market sentiment is the volatility index, VSTOXX. The VSTOXX indices are based on the EURO STOXX 50 real-time options prices. VSTOXX reflects ma rm volatility by measuring the square root of the im- plied variance across all (12 month) put and call op- tions.16 Market volatility tends to rise during times of financial stress. This index is sometimes called the “in- vestor fear index” and higher values indicate greater un- certainty in the stock market as investors hedge against losses. Figure 5 shows the index spikes in 2003 and 2009. The rise in the index from 2002-2003 reflects mar- Figure 4. Annual inflation rate in the Euro Area (changing composition), January 1999-February 2011. Source : elabo- ration on data from ECB website. Figure 5. Dow Jones Euro STOXX50 Volatility Index: Jan- uary 1999-February 2011. Source: elaboration on data from STOXX. com. ket uncertainty due to sluggish economic growth and uncertainty arising the global war on terror, while the rise during 2009 reflects uncertainty due to turmoil fol- lowing the sub-prime financial crisis and sovereign debt crisis. We would expect the EONIA to be negatively associated with the VSTOXX, since a higher VSTOXX index points to investors hedging against future stock losses and uncertainty which is likely to occur during an economic downturn.17 To capture the recent 2009-2011 sovereign debt crisis, we include a sovereign debt risk premium for Greece and ond in Greece and Ireland and Germany’s (default free) 10-year government bond. Gorter et al. [6] cur if there is a decline in eco- no Ireland. Our risk premium variable is the interest-spread, calculated as the difference in yields between the 10-year government b also include a risk premium to capture overall financial market risk in the euro area. Their risk is measured by long term corporate BBB Bonds minus the 10 year euro-area government bond. So their interest-spread does not capture sovereign risk, but rather corporate risk. A rise in the risk premium on sovereign bonds is often as- sociated with rising fiscal imbalances and may indicate an increase in perceived default risk. A rising sovereign bond yield can also oc mic activity which causes a deterioration in the gov- ernment’s fiscal situation, or if there is a global financial crisis resulting in uncertainty, causing investors to seek safer, higher quality bonds (such as German or U.S. bonds). As shown in Figure 6 below, Greece’s risk pre- mium declined significantly following the introduction of the euro in 1999 and its adoption of the euro 2 years later. After remaining quite low throughout the 2000’s, the countries’ risk premia surged again in 2008 and 2009-2010, as the global crisis and recession worsened 17Gerdesmeier and Roffia [5] include a stock price index in their speci- fication, the DJ Euro Stoxx 50 to capture movements in asset prices. 16We choose 12 month contracts for consistency since our other inde- endent variables are 12 month expectations. Copyright © 2011 SciRes. ME 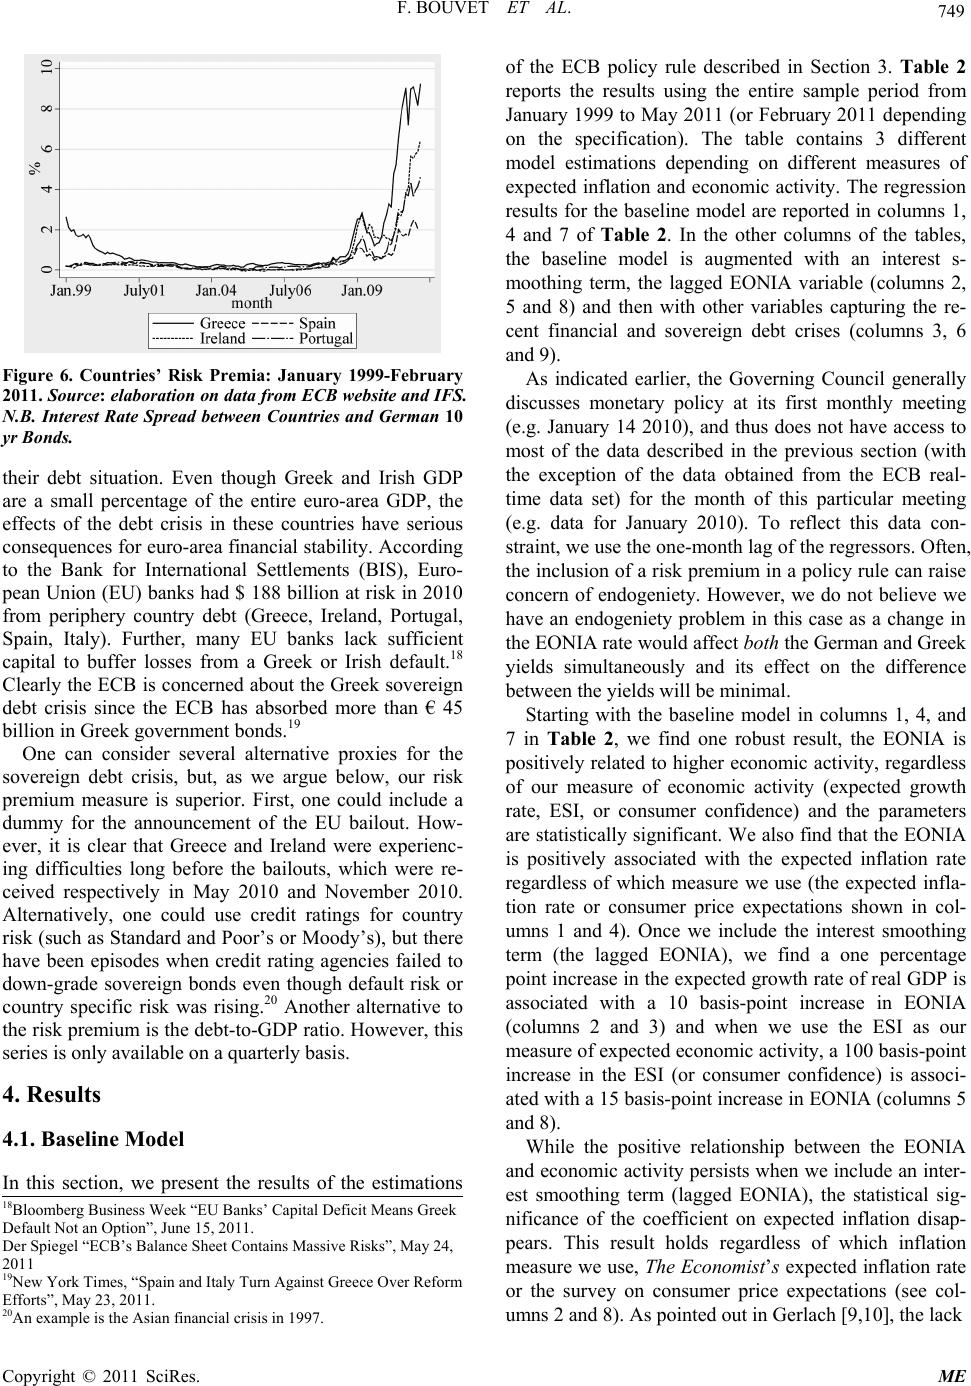 749 F. BOUVET ET AL. Figure 6. Countries’ Risk Premia: January 1999-February 2011. Source: elaboration on data from ECB website and IFS. N.B. Interest Rate Spread be tween Countries and German 10 yr Bonds. their debt situation. Even though Greek and Irish GDP are a small percentage of the entire euro-area GDP, the effects of the debt crisis in these countries have serious consequences for euro-area financial stability. According to the Bank for International Settlements (BIS), Euro- pean Union (EU) banks had $ 188 billion at risk in 2010 from periphery country debt (Greece, Ireland, Portugal, Spain, Italy). Further, many EU banks lack sufficient capital to buffer losses from a Greek or Irish default.18 Clearly the ECB is concerned about the Greek sovereign debt crisis since the ECB has absorbed more than € measure is superior. First, one could include a In this section, we present the results of the estimations ring the re- and sovereign debt crises (columns 3, 6 the Governing Council generally discusses monetary policy at its first monthly meeting le 2, we find one robust result, the EONIA is po fidence) is associ- at 45 billion in Greek government bonds.19 One can consider several alternative proxies for the sovereign debt crisis, but, as we argue below, our risk premium dummy for the announcement of the EU bailout. How- ever, it is clear that Greece and Ireland were experienc- ing difficulties long before the bailouts, which were re- ceived respectively in May 2010 and November 2010. Alternatively, one could use credit ratings for country risk (such as Standard and Poor’s or Moody’s), but there have been episodes when credit rating agencies failed to down-grade sovereign bonds even though default risk or country specific risk was rising.20 Another alternative to the risk premium is the debt-to-GDP ratio. However, this series is only available on a quarterly basis. 4. Results 4.1. Baseline Model of the ECB policy rule described in Section 3. Table 2 reports the results using the entire sample period from January 1999 to May 2011 (or February 2011 depending on the specification). The table contains 3 different model estimations depending on different measures of expected inflation and economic activity. The regression results for the baseline model are reported in columns 1, 4 and 7 of Table 2. In the other columns of the tables, the baseline model is augmented with an interest s- moothing term, the lagged EONIA variable (columns 2, 5 and 8) and then with other variables captu cent financial and 9). As indicated earlier, (e.g. January 14 2010), and thus does not have access to most of the data described in the previous section (with the exception of the data obtained from the ECB real- time data set) for the month of this particular meeting (e.g. data for January 2010). To reflect this data con- straint, we use the one-month lag of the regressors. Often, the inclusion of a risk premium in a policy rule can raise concern of endogeniety. However, we do not believe we have an endogeniety problem in this case as a change in the EONIA rate would affect both the German and Greek yields simultaneously and its effect on the difference between the yields will be minimal. Starting with the baseline model in columns 1, 4, and 7 in Tab sitively related to higher economic activity, regardless of our measure of economic activity (expected growth rate, ESI, or consumer confidence) and the parameters are statistically significant. We also find that the EONIA is positively associated with the expected inflation rate regardless of which measure we use (the expected infla- tion rate or consumer price expectations shown in col- umns 1 and 4). Once we include the interest smoothing term (the lagged EONIA), we find a one percentage point increase in the expected growth rate of real GDP is associated with a 10 basis-point increase in EONIA (columns 2 and 3) and when we use the ESI as our measure of expected economic activity, a 100 basis-point increase in the ESI (or consumer con ed with a 15 basis-point increase in EONIA (columns 5 and 8). While the positive relationship between the EONIA and economic activity persists when we include an inter- est smoothing term (lagged EONIA), the statistical sig- nificance of the coefficient on expected inflation disap- pears. This result holds regardless of which inflation measure we use, The Economist’s expected inflation rate or the survey on consumer price expectations (see col- umns 2 and 8). As pointed out in Gerlach [9,10], the lack 18Bloomberg Business Week “EU Banks’ Capital Deficit Means Greek Default Not an Option”, June 15, 2011. Der Spiegel “ECB’s Balance Sheet Contains Massive Risks”, May 24, 2011 19New York Times, “Spain and Italy Turn Against Greece Over Reform Efforts”, May 23, 2011. 20An example is the Asian financial crisis in 1997. Copyright © 2011 SciRes. ME 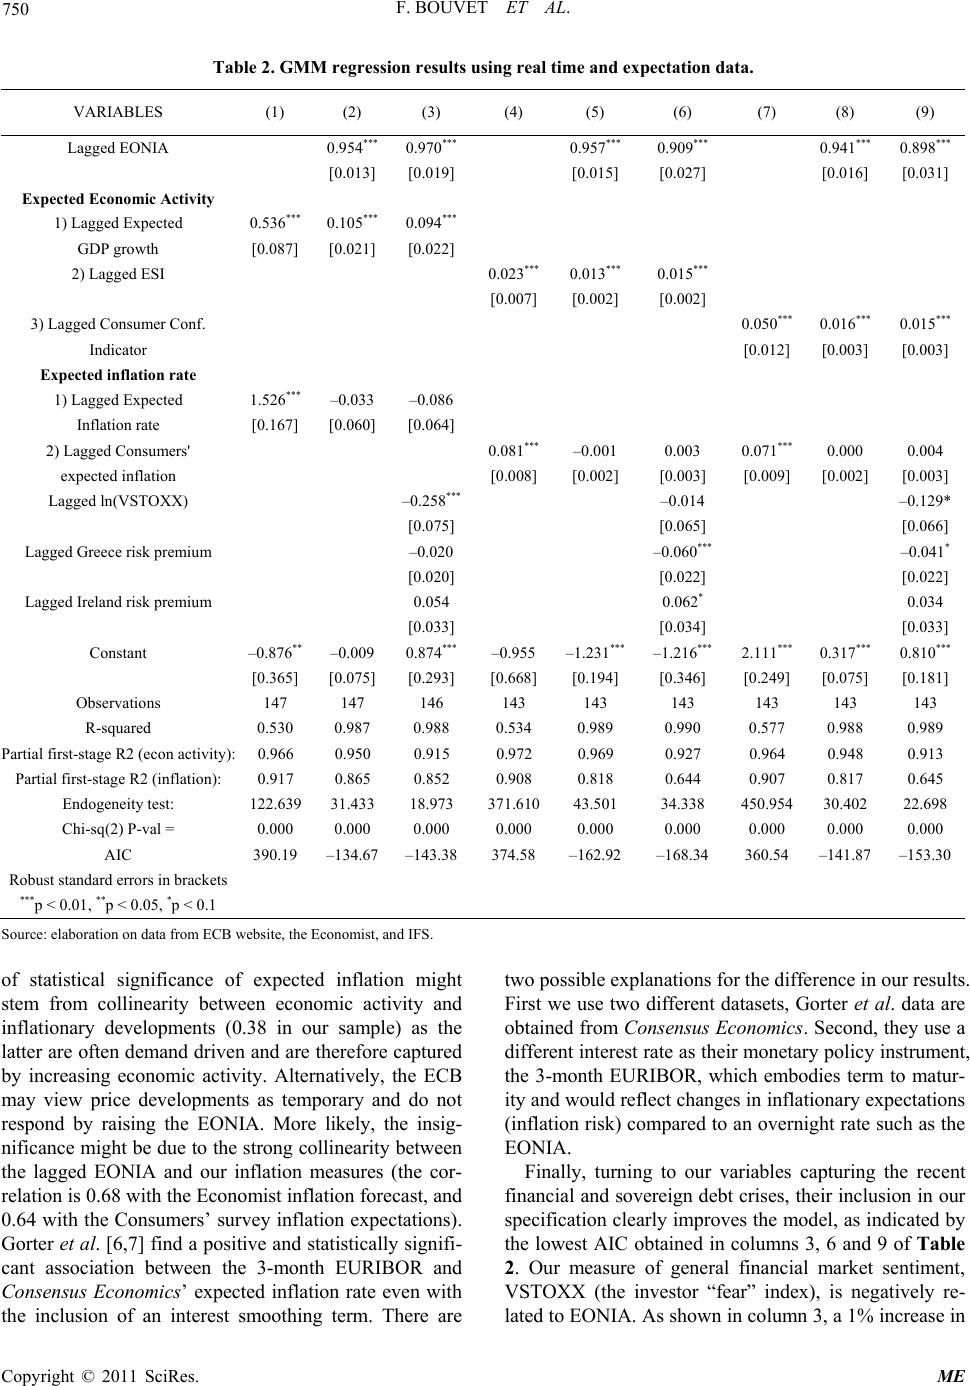 F. BOUVET ET AL. Copyright © 2011 SciRes. ME 750 sin Table 2. GMM regression results u VARIABLES (1) (2) (3) g real time and expectation data. (4) (5) (6) (7) (8) (9) Lagged EONIA 0.954*** 0.970*** 0.957*** 0.909*** 0.941*** 0.898*** [0.013] [0.019] Expected Economic Activity 1) Lagged Expected 0.536*** 0.105*** 0.094*** [0.015] [0.027] [0.016] [0.031] GDP growth [0.087] [0.021] [0.022] 2) Lagged ESI [0.007] [0.002] [0.002] 3) Lag 0.* 0.* 0.* [0.0] Expected in 1.526*** –0. 2) 0.081*** –0.003 0.071*** 0.000 0.004 expe [0.09] [0.02] [0.03] Lagged ln( –0.258*** –0.129* [0.5] L –0.–0.060*** * [0.00] [0.02] La 0.062* 0. [0.04] [0.03] –0.0.–1. *** –1. *** 2.*** *** 0.*** 35] [0.05] [0.23] 147 0.0.0.0. 0. Par:0.966 0.950 0.972 0.969 0.964 0.948 Par: 0.917 0.865 0.908 0.818 0.907 0.817 122.9 31.3 371043.1 450.4 30.2 0.000 0.000 0.000 0.000 0.000 0.000 –134. Robust standar in brackets ***p < 0.01, ** *p < 0.1 0.023*** 0.013*** 0.015*** ged Consumer Conf. 050** 016** 015** Indicator n rate 12[0.003] [0.003] flatio –0.6 1) Lagged Expected 033 08 Inflation rate Laers' [0.167] [0.060] [0.064] gged Consum 001 0. cted inflation STOXX) [0.008] [0.002] [0.003] 000 V –0.014 [0.5] agged Gr premium 07 06 [0.066] eece risk 020 –0.041 [0.02] g m 2 2 2 ged Ireland risk premiu 0.054 034 [0.033] 874*** –0. 3 3 Constant –0.876** 009 955 231216 111 0.317810 [0.679[0.668] 143 [0.194] 143 [0.346] [0.249] 143 [0.075] 143 [0.181] Observations 147 R-squared 0. 146 143 143 530 987 0.988 534 989 0.990 577 988 0.989 tial first-stage R2 (econ activity) tial first-stage R2 (inflation) 0.915 0.927 0.913 0.852 0.644 0.645 Endogeneity test: Chi-sq(2 P-val = 634318.973 .615034.338 954022.698 )0.000 0.000 0.000 AIC 390. d errors 19 67–143.38 374.58 –162.92–168.34 360.54 –141.87–153.30 p < 0.05, Source: elabo from ECB wee Eco and ted ion t seomtivi inflatioents (0. ur latter a driven e the ca by increasinnomic activirn th mts asemporary and doot re NIA. More likely, the insig- en the lagged EONIA and our inflation measures (the cor- possn for fere outs. weo dit daoal. e ned nEc. S tha rent interest rate as their ary ins -mRIhiod t- ity and would reflect changes inexpectations (inflation risk) compared to an overnight rate such as the EONIA. Finally, turning to our variables capturing the recent ration on databsite, thnomist,IFS. of statistical significance of expec inflatmigh tem from collinearity betwe n 38 in o n ecoic acty and nary developm sample) as the re often demandand arereforptured g ecoty. Alteatively, e ECB ay view price developmen t n spond by raising the EO nificance might be due to the strong collinearity betwe relation is 0.68 with the Economist inflation forecast, and 0.64 with the Consumers’ survey inflation expectations). Gorter et al. [6,7] find a positive and statistically signifi- cant association between the 3-month EURIBOR and Consensus Economics’ expected inflation rate even with the inclusion of an interest smoothing term. There are financial and sovereign debt crises, their inclusion in our specification clearly improves the model, as indicated by the lowest AIC obtained in columns 3, 6 and 9 of Table 2. Our measure of general financial market sentiment, VSTOXX (the investor “fear” index), is negatively re- lated to EONIA. As shown in column 3, a 1% increase in two ible explaationsthe difnce inr resul First use twfferentasets, G onomics rter et data ar obtai from Cosensus econd,ey use diffe monetpolicytrument, the 3onth EUBOR, wch embies termo matur inflationary  F. BOUVET ET AL. 751 previously, the European System of Central B r before testing for the resence of a structural break more carefully using a estim rom ne regression to the next. Variations in the relationship nts in the estimated coef- k premium) mber 2008, pos- ctural break in 2008. First, the VSTOXX index is associated with a 26 basis-point decrease in the EONIA. An increase in Greece’s risk premium is also negatively related to the EONIA: a 100 basis-point increase in Greece’s risk premium is associ- ated with a 4 to 6 basis-point decrease in EONIA. One possible explanation for the negative partial-correlation is the ECB’s “credit enhancement program” causing the EONIA to fall as Greek risk rises. The small coefficient could be the non-conventional measures the ECB has undertaken to mitigate the effects of the debt crisis. As mentioned anks (ESCB) have accepted Greek, Irish, Portuguese and Spanish government securities as collateral.21 We do not find any robust relationship between the Irish risk premium and the EONIA. 4.2. Did the Financial and Sovereign Debt Crises Induce a Policy Shift? Stability Analysis 4.2.1. Recur s i ve Estimation s To test the stability of the estimated coefficients over time, and to assess more accurately whether the financial and sovereign debt crises induced a shift in the ECB’s monetary policy, we first run recursive estimations of Equation (3). A rolling regression estimates a particular relationship (in our case, the Taylor rule) over many dif- ferent sample periods. Each regression produces a set of estimated coefficients.22 Recursive estimations thus trace the evolution of the coefficients as the sample data in- creases by one additional observation for each estimation. Consequently, the rolling regression technique allows a visual assessment of coefficient stability and to identify when a structural break might occu p Chow test. If the relationship is stable over time, then the ated coefficients should be relatively similar f i o will appear as sizable moveme ficients.23 The starting period (January 1999) is held fixed, and the sample window size grows by one month for each estimation. If we choose a window of 48 months for instance, the first estimation uses data spanning from January 1999 to December 2002; the second estimation would be based on data spanning from January 1999 to January 2003, while the last estimation would cover the entire time period (from January 1999 to February 2011). We run GMM estimations of Equation (3), based on the specification with the lowest AIC in Tabl e 2 (column 6) and record the estimated coefficients obtained for each subsample. In order to allow enough observations to run the first set of estimations, the recursive estimates are obtained using a 48 months (4 years) window. The re- sults discussed below are robust to a change in the win- dow size (12 to 72 months) and to different measures of expected inflation rate and expected economic activity. Figure 7 presents a plot of the coefficients obtained re- cursively.24 The plots of the recursive estimates show some visible changes in the estimated coefficients within the sample period, largely associated with different epi- sodes of financial and sovereign debt crises: Overall the estimated coefficient on the lagged EONIA is quite stable. However, a shift is notice- able around December 2008 as the coefficient and error bands move from 0.8 to 0.9. The estimated coefficient on expected inflation is also quite stable, and is statistically significant dif- ferent from zero between December 2006 and No- vember 2010, consistent with Gorter et al. (2010) that the ECB has focused more on inflation from the onset of the crisis. The estimated coefficient on expected economic activity exhibits a slight downward trend, with a sharp decrease occurring between November and December 2010 as the debt crisis deepens. However, this coefficient is stable at 0.02. The estimated coefficients on Greece’s and Ire- land’s risk premium variables all display a clear shift (more pronounced for Ireland’s ris n December 2008 as the coefficient and error bands shift from –0.2 to –0.1 and 1 to 0.2 respec- tively. The coefficient on the Greek risk premium exhibits a clear uptrend after Dece sibly reflecting growing concerns at the ECB about Greece’s fiscal health. While August 2007 is generally considered the begin- ning of the recent financial crisis,25 our coefficients clearly shift around December 2008. There are several events that explain the stru euro-area quarterly growth rates in GDP did not turn 21Der Spiegel, “ECB’s Balance Sheet Contains Massive Risks: The Hidden Cost of Saving the Euro” by M. Brendel and C. Pauly May 24, 2011, http://www.spiegel.de/international/business/0,1518,764299,00.html 22While rolling regression can be used with time series data (as in this aper), it can also be used with cross-section data to identify threshold(s in the relationship between two variables. (See Rousseau and Wachtel [27] for instance). 23Aizenman and Glick [28] for instance, use the rolling estimation tech- nique to test the stability of the sterilization coefficient, while Knotek. [29] uses the same technique to check the stability of the Okun’s Law in the USA between 1948 and 2007. The dates refer to the end-point of the estimation window. 25In an interview with the Financial Times on December 15, 2008, Jean-Claude Trichet dates the start of the financial crisis in Europe as August 9, 2007, when the French bank BNP Paribas suspended all withdrawals from funds backed by mortgage- acked securities by investors after the US subprime mortgage crisis had led to a liquidity shortage. Also see, Hubbard G., A. O’Brien, M. Rafferty, 2011. “IS- MP: A Short Run Macroeconomic Model” in Macroeconomics, 1/E, Chapter 9, p. 325. Prentice Hall Press. Also, Beirne [21]. Copyright © 2011 SciRes. ME  F. BOUVET ET AL. Copyright © 2011 SciRes. ME 752 Figure 7. Recursive Estimation Coefficients. Source: elaboration on data from ECB website, the Economist, and IFS. negative until the last quarter of 2008.26 Second, re- sponding to the new recession, the ECB cut the repo rate by 75 basis-points in December 2008, which triggered a decline in the EONIA. This cut was larger than analysts had anticipated and followed two, 50 basis-point cuts in November and October respectively.27 The repo rate (and consequently the EONIA) experienced its sharpest de- crease between October and December 2008. This inter- est r 2008) by a press release entitled “Financial Stability Re- induced structural shifts in the policy reaction function, we run the same analysis as the one presented in Table 2 but including interaction terms with a time dummy vari- able capturing the period during financial and debt crises in Europe. Statistically significant coefficients on these interaction terms would indicate that the ECB’s response to the variables interacted with the crisis dummy has been changed by the crises. To test for a mo tion terms (Chow test). We compare results obtained with ameter, since e coefficient on the interaction term between the lagged ate cut was followed a few days later (December 15, policy shift, we run a joint test on all the interac re general view December 2008: Risks and vulnerabilities in finan- cial system persist”.28 August 2007 does not correspond to a structural break in our data because the financial crisis which erupted then in the U.S. only spread to Europe in the second half of 2008. The initial decline in the repo rate and EONIA between September and De- cember 2008 was largely driven by a decline in eco- nomic activity and not a policy shift [7]. 4.2.2. GMM Estimation with Crisis Interaction Terms To assess more precisely whether the 2007-2009 finan- cial crisis and/or the more recent sovereign debt crisis two different starting months: August 2007, generally considered as the beginning of the financial crisis (see footnote 25), and December 2008. The results are pre- sented in Table 3. First, there is no robust evidence that the financial cri- sis affected the interest-rate smoothing par th EONIA and the time dummy variable is statistically in- significant in all specifications. There is more evidence of a shift after December 2008, as the overall correlation between current and lagged EONIA drops, capturing the rapid decrease in the interest rate that occurred between October and December 2008. Second, the negative coefficients on the interaction terms with our expected economic activity measures im- ply that the ECB was less likely to raise its interest rate as economic activity rises during the crisis period (see 26European Commission, “Economic Crisis in Europe: Cause, Conse- quences and Reponses” European Economy 7/2009 available at http:/ ec.europa.eu/economy_finance/publications/publication15887_en.pdf 27Der Spiegel, “European Interest Rates Tumble” 12/4/2008 available at http://www.spiegel.de/international/business/0,1518,594485,00.html 28http://www.ecb.int/press/pr/date/2008/html/pr081215.en.html  F. BOUVET ET AL. 753 cte (3 Table 3. Has the financial crisis affe (1) (2) d the ECB’s interest rate setting? ) (4) (5) (6) (7) Time of shift Aug. 2007 Aug. 2007 Aug. 2007 Aug. 2007 Dec. 2008 Dec. 2008 Dec. 2008 Lagged EONIA 0.932*** 0.932*** 0.919 [0.026] [0.035] [0.02 0.05 [0.03 0.179*** Crisis (Lagged Expected GDP owth [0] [0] [0] 2) Lagged ESI 0.014 0.020* 0.013* 0.020 Crisis*Laged ESI 0.–0.021*** –0.016*** –0.024*** Expected inflation rate Inflati rate Crisis*.294** –0.0. 2) Lers’ 0.0.005* 0.005* 0.006** [0.3] [0.3] [0.3] [0.3] Crisis*mers’ –0.–0.0.–0.0 e Crisis tim dummy 0.426** 0.899** 3 [0.2] [0.0] [0.0] Lagged ln (STOXX) –0.193** [0.2] [0.1] [0.3] C – –0.028*** –0.05 [0.9] [0.8] –0.175*** –0.163*** Premm [0.2] [0.8] 0.127* [0.0] 0. [0.6] Risk Pmium –0. 1* –1.209*** – –0.342*** –1.180*** – [0.9] [0.4] [0.7] [0.7] Obsertions 1 1 147 1 0.0.0 0.0.1 Partial first-son activity): 0.0.0.0. Partion): 0.0.0.0. E35.9 62.9 29.3 41.3 0.0.0. 0. –1311 –1550 –1769 –1743 – 1. 1. 6. 6. [0.1] [0.2] [0.0] [0.0] Robust stan in brackets ***p < 0.01, **p 0.05, *p < 0.1 *** Crisis*Lagged EONIA 0.057 0.032 [0.037] [0.056] Expected Economic Activity 1) Lagged Expected 0.141*** 0.151*** GDP growth 0.838*** 0.915*** 0.909*** 0.839*** 9] [0.037] [0.024] [0.028] [0.037] 8 0.087 –0.271** –0.227*** –0.132 6] [0.075] [0.114] [0.066] [0.097] [0.037] [0.043] [0.037] –0.011 –0.178*** –0.211** gr .056 .061 *** ** .085 ***** [0.002] [0.003] [0.002] [0.003] g 002 [0.005] [0.006] [0.005] [0.005] 1) Lagged Expected 0.119 –0.024 0.138* on[0.079] [0.175] [0.070] Lagged Exp. Inflation –0010 [0.219] 113 [0.142] [0.315] agged Consum 003 expected inflation 00000000 Lagged Consu 008 [0.005] 002 [0.008] 001 01 [0.008] xpected inflation [0.005] e–0.242 2.628*** 0.221.525*** 2.242*** 1937[0.460] [0.758] 32[0.455] [0.573] V –0.006 0.010 08 07 07 risis*Lagged VSTOXX 0.026*** 0 [0.007] 00 00 Lagged Greece risk –0.090 iu[0.070] 02 02 Crisis*lagged Greece 0.186*** 0.174*** Risk Premium 71 [0.043] [0.044] Lagged Ireland risk 326 0.754*** 0.555** Premium 21 [0.157] [0.270] Crisis*lagged Ireland –0.362 –0.766*** –0.567** re [0.220] [0.163] [0.273] Constant 280.562 1.612*** 1.675*** 14[0.434] 20[0.360] 1221[0.386] va47146 43143 43143 R-squared 988 0.991 990.992 991 990.992 tage R2 (ec941 0.867 969 0.922 951 966 0.920 al first-stage R2 (inflati842 0.746 830 0.662 897 816 0.646 ndogeneity test 0315.219 9760.809 319260.587 Chi-sq(2) P-val = 000 0.004 000 0.000 000 000 0.000 AIC 3.2–161.069 8.8–186.361 5.79.6190.966 Chow test 794.18 296.61 90576.74 [p-value] 53[0.000] 82[0.000] 0000[0.000] dard errors < Source: elaboration on data from ECB website,e Economist, a IFS. thnd Copyright © 2011 SciRes. ME  F. BOUVET ET AL. 754 the downn the ESI in re 7). The net par- tial-correlation coefficient between the two variables is e now find a cally significant, positive relationship en expinfla- tion ancolumn 5 le 3). per- centage in the e infle is associated basis-point increase in EONIA. This result is consistent with Gorter ] wh that t mh pe- rio et IC). One controthe policy shift, the e net partial-correlation coefficieverse (see col- n 7 ine 3 witowest For Grthe t partiaelation 163 + = 0.01for land partielation55 –= 012. the the ift driabrwhect on respf the to the risk premihe est that the econom is small. Finally, based on the joint F-test (Chow test), we find premia on Greek and Irish government nt bonds, are significant onetary policy shift, but ward trend iFigu negative during the crisis. Wstatisti betweected d EONIA (see in Tab A one -point increasexpectedattion ra . the with a 14et al. [7 ore during t ich find e crisis he ECB focuses on inflation d. The negative relationship between the financial mark volatility index (VSTOXX) and EONIA persists only when the crisis is measured as starting in August 2007. Once we use December 2008 as the start of the crisis, VSTOXX is no longer significant. Clearly, the dummy variables following December 2008 capture most the effects of the negative financial market sentiment and VSTOXX adds no additional information. Instead of the EONIA falling when Greece and Ire- land’s risk premia rise during the crisis-period, we find that the EONIA rises when the Greek risk premium rises and falls when the Irish risk premium rises. Further, the magnitude of the coefficients is much smaller during the crisis period. One reason for the smaller coefficient dur- ing the crisis period is the ESCB’s acceptance of sover- eign debt as collateral from EU banks during this period. This policy prevents bond spreads from rising too rapidly (see footnote 26) even though the debt has little value. In addition, the different coefficient signs for Greek risk and Irish risk are the reason behind their respective sov- ereign debt problems. Greece’s problems stem from im- prudent fiscal policy over several years, while Ireland's debt problems arise from bank bailouts during the sub- prime crisis. The EONIA is a market rate influenced by the ECB; however, the EONIA is also determined by the banking system’s supply and demand for liquidity (Schi- anchi and Verga [30], Soares and Rodrigues [31]). If banks are uncertain about future liquidity, or lack thereof, banks will demand more liquidity in the inter-bank mar- ket thereby raising the EONIA. EU banks have more exposure to Greek government debt compared to Irish government debt and so the precautionary demand for liquidity is higher.29 So as the Greek debt crisis (meas- ured by the Greek risk premium) unfolds, the EONIA rises (a positive coefficient) compared to Ireland (a nega- tive coefficient). Before we control for the policy shift (our time dum- mies), the coefficient signs on Greek and Irish risk were negative (–0.06) and positive (0.062) respectively, see column 6 of Table 2 (the estimation with the lowest more evidence of a general shift in the ECB’s policy following December 2008 in contrast to the usual date of August 2007. 5. Concluding Remarks This paper examines the co-movement in the EONIA to the financial and sovereign debt crises using expectations data. As our base Ace wl for signs on th nts re um Tabl h the lAIC). eece, nel-corris –0.0.174 1 and Irethe netal corr is 0.5 0.567 –0C, u va learlye of le e ffect policy sh se- (captured bymmys) ovlmes effthe ba line sizes of the c onse o oefficients sugg EONIA ums. T ic effect line, we estimate a forward-looking Taylor rule with a smoothing parameter. One clear result is that the ECB heavily weights economic sentiment. However, we cannot ascertain whether the ECB is only responding to changes in expected economic activity, or whether the increases capture inflationary pressures. Once we control for interest smoothing, the EONIA is not significantly associated with inflation. This result is robust using different types of inflation data. We aug- ment our baseline model to include variables that proxy the financial and sovereign debt crises. Our measure of general financial market sentiment is the (investor “fear” index, VSTOXX. We find that the VSTOXX coefficient is statistically significant and negatively associated with the EONIA. However, once we account for a policy shift, VSTOXX is no longer significant. We conclude that VSTOXX is capturing the shift in monetary policy. Our variables to proxy developments in the sovereign debt crisis, the risk bonds over German governme even when we account for the m have a smaller magnitude. Finally, we establish a clear shift in policy in December 2008 in contrast to the con- ventional start of the crisis in August 2007. The ECB is often criticized for being unclear on policy changes. Since the ECB does not publicly release min- utes to policy meetings, markets are often left wondering the direction of future policy and how the ECB arrives at its decisions. Our paper provides some insight into ECB behaviour and movements in the EONIA following the recent financial and sovereign debt crises. To further clarify how the ECB arrives at its policy decisions, we plan to investigate how national economic considerations affect ECB policy, and whether the recent financial and 29Financial Times, “Hot stuff in European banks’ exposure” by John McDermott, June 21, 2011. http://ftalphaville.ft.com/blog/2011/06/21/ 601491/hot-stuff-in-european-banks-exposure/ Copyright © 2011 SciRes. ME  755 F. BOUVET ET AL. sovereign debt crises have affected the weights placed on different countries’ economic outcomes. 6. References [1] J. C. Trichet, “State of the Union: The Financial Crisis and the ECB’s Response between 2007 and 2009,” Jour- nal of Common Market Studies, Vol. 48, 2010, pp. 7-19. [2] ECB, “The Outcome of the ECB’s Evaluation of Mone- tary Policy Strategy,” ECB Monthly Bulletin, June 2003. www.ecb.int. [3] S. Sauer and J.-E. Sturm, “Using Taylor Rules to Under- stand ECB Monetary Policy,” CES-IFO Working Paper No. 1110, 2003. [4] R. Fendel and M. Frenkel, “Taking the European Central Bank to the Data,” Zeitschrift Für Wirtschaftspolitik, Vol. 54, No. 1, 2005, pp. 101-114. [5] D. Gerdesmeier and B. Roffia, “Estimates of Reaction Functions for the Euro Area,” ECB Working Papers, No. 206, January 2003. [6] J. Gorter, J. Jacobs, and J. de Haan, “Taylor Rules for the ECB Using Expectations Data,” Scandinavian Journal of Economics, Vol. 110, No. 3, 2008, pp. 473-488. doi:10.1111/j.1467-9442.2008.00547.x [7] J. Gorter, F. Stolwijk, J. Jacobs and J. de Haan, “ECB Policy Making and the Financial Crisis,” DNB Working Paper, No. 272, 2010. [8] J. Taylor, “Discretion Carnegie-Roche versus Policy Rules in Practice,” ster Conference Series on Public Policy, Vol. 39, 1993, pp. 195-214. doi:10.1016/0167-2231(93)90009-L [9] S. Gerlach, “Interest Rate Setting by the ECB 1999-2006: Words and Deeds,” International Journal of Central erican Economic Review, Vol. 91, No. 4, Banking, Vol. 3, No. 3, 2007, pp. 1-45. [10] A. Orphanides, “Monetary Policy Rules Based on Real- time Data,” Am 2001, pp. 964-985. doi:10.1257/aer.91.4.964 [11] G. Rudebusch, “Term Structure Evidence on Interest Rate Smoothing and Monetary Policy Inertia,” Journal of Monetary Economics, Vol. 49, No. 6, 2002, pp. 1161- 1187. doi:10.1016/S0304-3932(02)00149-6 [12] R. Clarida, J. Gali and M. Gertler, “Monetary Policy 0.1016/S0014-2921(98)00016-6 Rules in Practice: Some International Evidence,” Euro- pean Economic Review, Vol. 42, No. 6, December 1998, pp. 1033-1067. doi:1 tem, 2001. hool of Finance and Management l Stability 45.x [13] J. Faust, J. Rogers and J. Wright, “An Empirical Com- parison of Bundesbank and ECB Monetary Policy Rules,” International Finance Discussion Papers, No. 705, Bo of Governors of the Federal Reserve Sys ard [14] D. Gerdesmeier and B. Roffia, “The Relevance of Real- Time Data in Estimating Reaction Functions for the Euro Area,” HfB-Business Sc Working Papers, No. 56, June 2004. [15] S. Gerlach, “ECB Repo Rate Setting during the Financial Crisis,” Institute for Monetary and Financia and CEPR Working Paper, 2010. [16] K. Carstensen, “Estimating the ECB Policy Reaction Func- tion,” German Economic Review, Vol. 7, No. 1, 2006, pp. 1-34. doi:10.1111/j.1468-0475.2006.001 ssen Work- an, “Ivreg2: ead g the [17] A. Belke and J. Klose, “(How) Do the ECB and the Fed React to Financial Market Uncertainty? The Taylor Rule in Times of Crisis,” University of Duisburg-E ing Paper, 2010. [18] E. Castelnuovo, “Taylor Rules and Interest Rate Smooth- ing in the Euro Area,” 2005. [19] C. F. Baum, M. E. Schaffer and S. Stillm Stata Module for Extended Instrumental Variables/2SLS, GMM and AC/HAC, LIML and k-Class Regression,” 2007. http://ideas. repec.org/c/boc/bocode/s425401.html [20] T. Linzert and S. Schmidt, “What Explains the Spr Between the Euro Overnight Rate and the ECB’s Policy Rate,” ECB Working Paper Series, No. 983, December 2008. [21] J. Beirne, “The EONIA Spread Before and durin Crisis of 2007 to 2009: The Role of Liquidity and Credit Risk,” August 2010. https://editorialexpress.com/cgi-bin/conference/download .cgi?db_name=res2011&paper_id=60, 2010. [22] D. Giannone, J. Henry, M. Lalik and M. Modugno, “An Area-Wide Real-Time Database for the Euro Area,” ECB Working Papers Series, No. 1145, January 2010. www.ecb.int [23] A. Orphanides and S. van Norden, “The Unreliability of Output Gap Estimates in Real-Time,” Review of Eco- nomics and Statistics, Vol. 84, No. 4, November 2002, pp. 569-583. doi:10.1162/003465302760556422 [24] A. Orphanides and S. van Norden, “The Reliability of Inflation Forecasts Based on Output Gap Estimates in Real-Time,” CEPR Discussion Papers Series, No. 4830, 2005. www.cepr.org/pubs/dps/DP48- 30.asp F. Heinemann and F. P. Hue[25] fner, “Is the View from the Eurotower purely European? National Divergence and ECB Interest Rate Policy,” Scottish Journal of Political Economy, Vol. 51, No. 4, 2004, pp. 544-558. doi:10.1111/j.0036-9292.2004.00320.x [26] P. Rousseau and P. Watchel, “Inflation Thresholds and the Finance-Growth Nexus,” Journal of International Money and Finance, Vol. 21, No. 6, 2002, pp. 777-793. doi:10.1016/S0261-5606(02)00022-0 [27] J. Aizenman and R. Glick. “Sterilization, Monetary Pol- icy, and Global Financial Integration,” Review of Interna- tional Economics, Vol. 17, No. 4, 2009, pp. 777-801. doi:10.1111/j.1467-9396.2009.00848.x E. S. Knotek, “How Useful is Okun’s Law[28] ?” Federal Reserve Bank of Kansas City Economic Review, 4th Quarter 2007. [29] A. Fourçans and R. Vranceanu, “The ECB Interes under the Dui t Rate senberg Presidency,” European Journal of Political Economy, Vol. 20, No. 3, 2004, pp. 579-595. doi:10.1016/j.ejpoleco.2004.01.003 [30] A. Schianchi and G. Verga, “A Theoretical Approach to Copyright © 2011 SciRes. ME  F. BOUVET ET AL. Copyright © 2011 SciRes. ME 756 er, Univer-gal the Harmonized Consumers’ inflation expectations: consumer sur- vey question on Price trends over the next 12 months (Eurostat). This is also an adjustment indi- Expected Economic Activity: 3 different measures: ic sentiment indicator (ECB). - IFS). ro area changes with the the EONIA Rate Movements,” Working Pap sity of Parma, Parma, 2006. [31] C. Soares and P. Rodrigues, “Determinants of the EONIA Spread and the Financial Crisis,” Bank of Portu Working Paper Series 12/201, 2011. Index of Consumer Prices from the Economist poll of forecasters. Data Appendix Variable definitions: EONIA: Euro OverNight Average Index, short- term interest rate. Expected headline inflation: 2 different measures. o Forecast of annual growth rate in o cator. o Real time econom o Real time consumer confidence indicator (ECB): this is an adjustment indicator. o The real GDP growth rate forecast from the Econo mist poll of forecasters. Country Risk Premium: difference between the long-term (10 year) government bond yields of Greece or Ireland and Germany ( Sample: January 1999 to May 2011 data for the euro Area. The composition of the eu actual number of member countries: Euro area changing composition: Adoption in o January 1999: Euro11 (Austria, Belgium, Finland, France, Germany, Ireland, Italy, Luxembourg, the Netherlands, Portugal, and Spain). o January 2001: Euro12 (Greece). ta). o2009: Euro 16 (Slovakia). ite, IFS, The o January 2007: Euro 13 (Slovenia). o January 2008 Euro 15 (Cyprus and Mal January o January 2011: Euro 17 (Estonia). Sources: Data are obtained from the ECB webs Economist, and Eurostat.
|