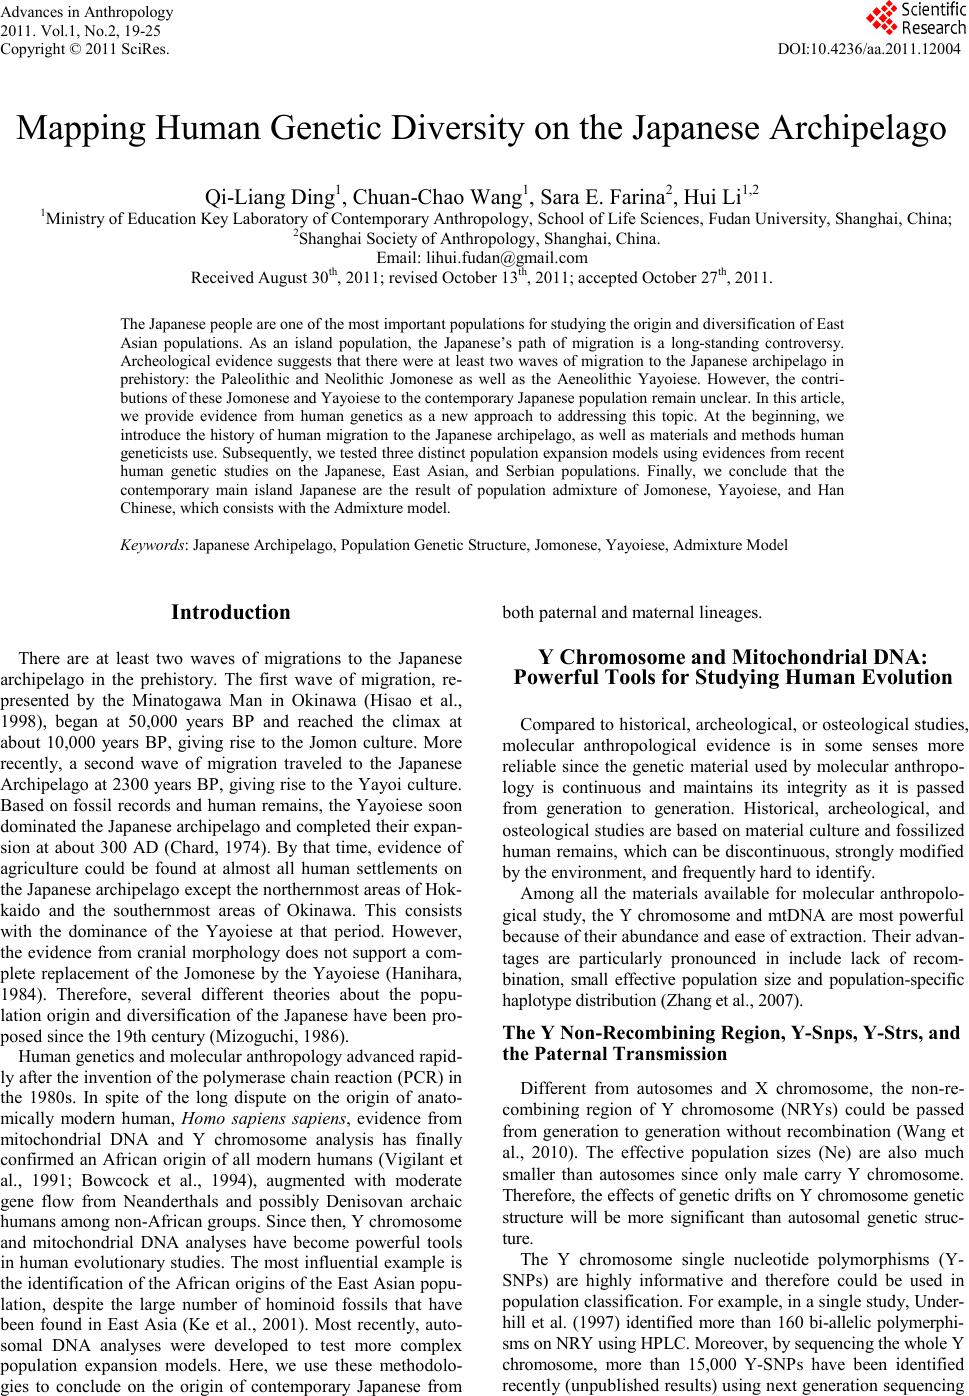
 Advan ces in Anthropology 2011. Vol.1, No.2, 19-25 Copyright © 2011 SciRes. DOI:10.4236/aa.2011.12004 Mapping Human Genetic Diversity on the Japanese Archipelago Qi-Liang Ding1, Chuan-Chao Wang1, Sara E. Farina2, H ui Li1,2 1Ministry of Education Key Laboratory of Contemporary Anthropology, School of Life Sciences, Fudan Universi ty, Shanghai, Chi na; 2Shanghai Society of Anthropology, Shanghai, China. Email: lihui.fudan@gmail.com Received August 30th, 2011; revised October 13th, 2011; acce pte d Octobe r 27th, 2011. The Japanese people are one of the most important populations for studying the origin and diversification of East Asian populations. As an island population, the Japanese’s path of migration is a long-standing controversy. Archeo logical evi dence suggests that there were at lea st two waves of mig ration t o the Japanese arc hipelago in prehistory: the Paleolithic and Neolithic Jomonese as well as the Aeneolithic Yayoiese. However, the contri- butions of these Jomonese and Yayoiese to the contemporary Japanese population remain unclear. In this article, we provide evidence from human genetics as a new approach to addressing this topic. At the beginning, we intr oduce the his tory of human mi gration to the Ja panese arch ipelago, as well as m aterials and m ethods human geneticists use. Subsequently, we tested three distinct population expansion models using evidences from recent human genetic studies on the Japanese, East Asian, and Serbian populations. Finally, we conclude that the contemporary main island Japanese are the result of population admixture of Jomonese, Yayoiese, and Han Chi nese, which co nsists with the Admixture m odel. Keywords: Japanese Archipelago, Population Genetic Structure, Jomones e, Yayoiese, Admixture M odel Introduction There are at least two waves of migrations to the Japanese archipelago in the prehistory. The first wave of migration, re- presented by the Minatogawa Man in Okinawa (Hisao et al., 1998), began at 50,000 years BP and reached the climax at about 10,000 years BP, giving rise to the Jomon culture. More recently, a second wave of migration traveled to the Japanese Archipelago at 2300 years BP, giving rise to the Yayoi culture. Based on fossil records and human remains, the Yayoiese soon dominat ed th e Jap anese archip elago an d completed th eir exp an- sion at about 300 AD (Chard, 1974). By that time, evidence of agriculture could be found at almost all human settlements on the Japan ese arch ip elago except t he n o rthern most areas of Hok- kaido and the southernmost areas of Okinawa. This consists with the dominance of the Yayoiese at that period. However, the evidence from cranial morphology does not support a com- plete replacement of the Jomonese by the Yayoiese (Hanihara, 1984). Therefore, several different theories about the popu- lation origin and diversification of the Japanese have been pro- posed since the 19th century (Mizoguchi, 1986). Human genetics and molecular anthropology advanced rapid- ly after the in vent io n of the p ol ymerase chain reactio n (P CR) in the 1980s. In spite of the long dispute on the origin of anato- mically modern human, Homo sapiens sapiens, evidence from mitochondrial DNA and Y chromosome analysis has finally confirmed an African origin of all modern humans (Vigilant et al., 1991; Bowcock et al., 1994), augmented with moderate gene flow from Neanderthals and possibly Denisovan archaic humans among non-African groups. Since then, Y chromosome and mitochondrial DNA analyses have become powerful tools in human evolutionary studies. The most influential example is the identification of the African origins of the East Asian popu- lation, despite the large number of hominoid fossils that have been found in East Asia (Ke et al., 2001). Most recently, auto- somal DNA analyses were developed to test more complex population expansion models. Here, we use these methodolo- gies to conclude on the origin of contemporary Japanese from both paternal and maternal lineages. Y Chromosome and Mitochondrial DNA: Powerful Tools for Studying Human Evolution Compared to histori cal, archeo logical, or osteologi cal stud ies, molecular anthropological evidence is in some senses more reliable since the genetic material used by molecular anthropo- logy is continuous and maintains its integrity as it is passed from generation to generation. Historical, archeological, and osteological studies are based on material culture and fossilized human remains, which can be discontinuous, strongly modified by the environment, and frequently hard to identify. Among all the materials available for molecular anthropolo- gical stud y, the Y chro mosome an d mtDNA are most powerful because o f their abundance and ease of extraction. Their advan- tages are particularly pronounced in include lack of recom- bination, small effective population size and population-specific haploty pe dis tr ibution (Z ha ng e t a l., 2007) . The Y Non-Reco mbining Region, Y-Snps, Y-St rs, and the Paternal Transmission Different from autosomes and X chromosome, the non-re- combining region of Y chromosome (NRYs) could be passed from generation to generation without recombination (Wang et al., 2010). The effective population sizes (Ne) are also much smaller than autosomes since only male carry Y chromosome. There fore, the effects o f genetic d rifts on Y ch romosome geneti c structure will be more significant than autosomal genetic struc- ture. The Y chromosome single nucleotide polymorphisms (Y- SNPs) are highly informative and therefore could be used in population classification. For example, in a single study, Under- hill et al. (1997) identified more than 160 bi-allelic polymerphi- sms on NRY using HPLC. Moreover, by sequencing the whole Y chromosome, more than 15,000 Y-SNPs have been identified recentl y (unpubl ished resul ts) using next gen eration sequen cing 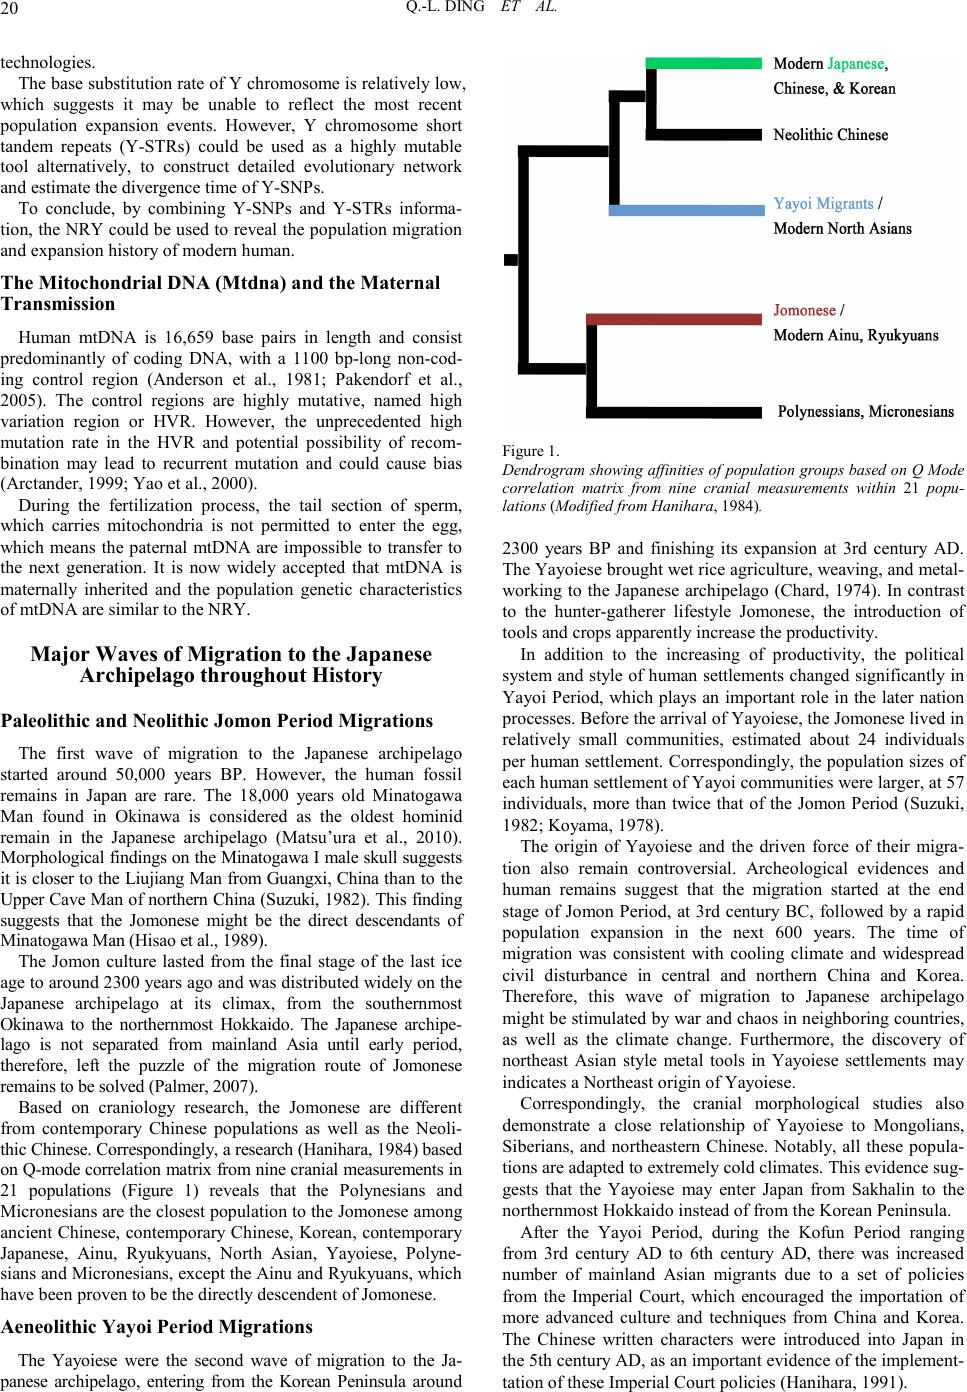 Q.-L. DING ET AL. 20 technologies. The base substitution rate of Y chromosome is relatively low, which suggests it may be unable to reflect the most recent population expansion events. However, Y chromosome short tandem repeats (Y-STRs) could be used as a highly mutable tool alternatively, to construct detailed evolutionary network and estimate the divergen ce time of Y-SNPs. To conclude, by combining Y-SNPs and Y-STRs informa- tion, the NRY could be used to reveal the population migration and expansion history of modern human. The Mitochondrial DNA (Mtdna) and the Maternal Transmission Human mtDNA is 16,659 base pairs in length and consist predominantly of coding DNA, with a 1100 bp-long non-cod- ing control region (Anderson et al., 1981; Pakendorf et al., 2005). The control regions are highly mutative, named high variation region or HVR. However, the unprecedented high mutation rate in the HVR and potential possibility of recom- bination may lead to recurrent mutation and could cause bias (Arctander, 1999; Yao et al., 2000). During the fertilization process, the tail section of sperm, which carries mitochondria is not permitted to enter the egg, which means the paternal mtDNA are impossible to transfer to the next generation. It is now widely accepted that mtDNA is maternally inherited and the population genetic characteristics of mtDNA are similar to the NRY. Major Waves of Migration to the Japanese Archipe la go th roughou t Hi s tory Paleolithic and Neolithic Jomon Period Migrations The first wave of migration to the Japanese archipelago started around 50,000 years BP. However, the human fossil remains in Japan are rare. The 18,000 years old Minatogawa Man found in Okinawa is considered as the oldest hominid remain in the Japanese archipelago (Matsu’ura et al., 2010). Morphological findings on the Minatogawa I male skull suggests it is closer to the Liujiang Man from Guangxi, China than to the Upper Cave Man of northern China (Suzuki, 1982). This finding suggests that the Jomonese might be the direct descendants of Minatogawa Ma n (H isa o e t a l., 1989) . The Jomon culture lasted from the final stage of the last ice age to around 2300 years ago and was distributed widely on the Japanese archipelago at its climax, from the southernmost Okinawa to the northernmost Hokkaido. The Japanese archipe- lago is not separated from mainland Asia until early period, therefore, left the puzzle of the migration route of Jomonese remains to be s olv e d (Palm e r, 2007). Based on craniology research, the Jomonese are different from contemporary Chinese populations as well as the Neoli- thic Chinese. Correspondingly, a research (Hanihara, 1984) based on Q-mode correlation matrix from nine cranial measurements in 21 populations (Figure 1) reveals that the Polynesians and Micronesians are the closest population to the Jomonese among ancient Chinese, contempor ary Chin ese, Korean, contemporary Japanese, Ainu, Ryukyuans, North Asian, Yayoiese, Polyne- sians and Micronesians, except the Ainu and Ryukyuans, which have been proven to be the directly descendent of Jomonese. Aeneolithic Yayoi Period Migrations The Yayoiese were the second wave of migration to the Ja- panese archipelago, entering from the Korean Peninsula around Figur e 1. Dendrogram showing affinities of population groups based on Q Mode correlation matrix from nine cranial measurements within 21 popu- lations (Modif ied from Hani hara, 1984). 2300 years BP and finishing its expansion at 3rd century AD. The Yayoiese b ro ugh t wet rice agri cul ture, weaving, an d metal- working to the Japanese archipelago (Chard, 1974). In contrast to the hunter-gatherer lifestyle Jomonese, the introduction of tools and crops apparently increase the productivity. In addition to the increasing of productivity, the political system and style of human settlements changed significantly in Yayoi Period, which plays an important role in the later nation processes. Before the arrival of Yayoiese, the Jomonese lived in relatively small communities, estimated about 24 individuals per human settlement. Correspondingly, the population sizes of each human settlemen t of Yayoi communities were larger, at 5 7 individuals, more than twice that of the Jomon Period (Suzuki, 1982; Koyama, 1978). The origin of Yayoiese and the driven force of their migra- tion also remain controversial. Archeological evidences and human remains suggest that the migration started at the end stage of Jomon Period, at 3rd century BC, followed by a rapid population expansion in the next 600 years. The time of migration was consistent with cooling climate and widespread civil disturbance in central and northern China and Korea. Therefore, this wave of migration to Japanese archipelago might be stimulated by war and chaos in neighboring countries, as well as the climate change. Furthermore, the discovery of northeast Asian style metal tools in Yayoiese settlements may indi cat es a Northeast origin of Yayoiese. Correspondingly, the cranial morphological studies also demonstrate a close relationship of Yayoiese to Mongolians, Siberians, and northeastern Chinese. Notably, all these popula- tions are adapted to extremely cold climates. Thi s evidence su g- gests that the Yayoiese may enter Japan from Sakhalin to the northernmost Hokkaido instead of from the Korean Peninsula. After the Yayoi Period, during the Kofun Period ranging from 3rd century AD to 6th century AD, there was increased number of mainland Asian migrants due to a set of policies from the Imperial Court, which encouraged the importation of more advanced culture and techniques from China and Korea. The Chinese written characters were introduced into Japan in the 5th cen tu ry AD, as an import ant evid en ce of the imple ment- tation of these Imperial Court policies (Hanihara, 1991). 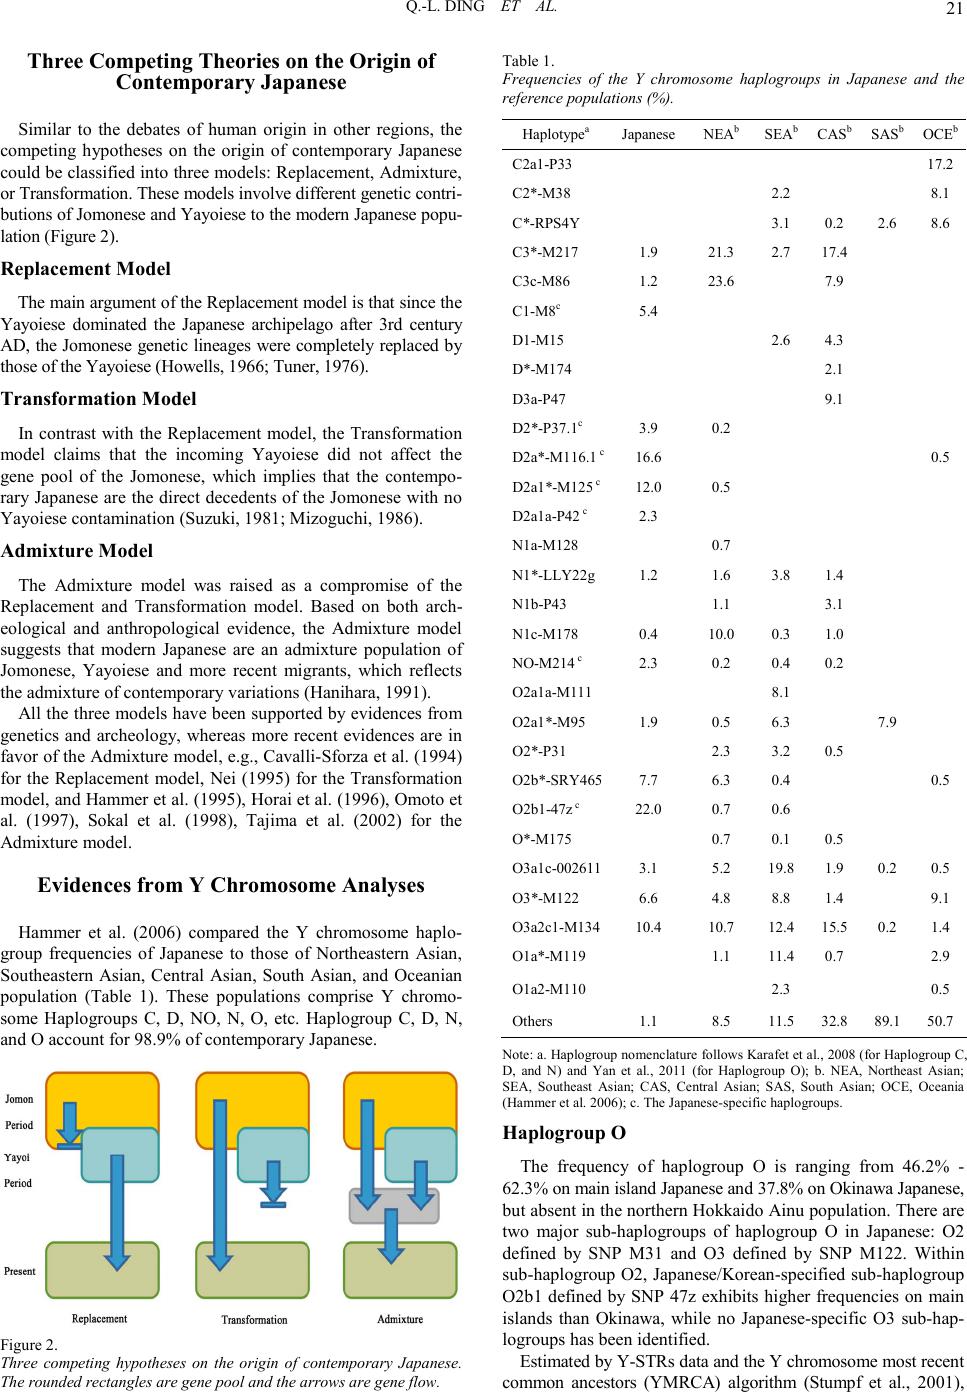 Q.-L. DING ET AL. 21 Three Competing Theories on the Origin of Contemporary Japanese Similar to the debates of human origin in other regions, the competing hypotheses on the origin of contemporary Japanese could b e classified i nto th ree models: Rep lacement, Admixture, or Transformation. These models involve different genetic contri- butions of Jomonese and Yayoiese to the modern Japanese popu- lation (Figur e 2) . Replacement Model The main argument of the Replacement model is that since the Yayoiese dominated the Japanese archipelago after 3rd century AD, the Jo monese gen etic linea ges were co mplet ely replaced b y those of the Yayoiese (How e lls, 1966; Tune r , 197 6) . Transformation Model In contrast with the Replacement model, the Transformation model claims that the incoming Yayoiese did not affect the gene pool of the Jomonese, which implies that the contempo- rary Japanese ar e the direct deced ents of the Jomonese with no Yayoiese contamination (Suzuki, 1981; Mizoguchi, 1986). Admixture Model The Admixture model was raised as a compromise of the Replacement and Transformation model. Based on both arch- eological and anthropological evidence, the Admixture model suggests that modern Japanese are an admixture population of Jomonese, Yayoiese and more recent migrants, which reflects the admixture of cont empo rary variat ions (Han ihara, 1991). All the three models have been supported by evidences from genetics and archeology, whereas more recent evidences are in favor of the Admixture model, e.g., Cavalli-Sforza et al. (1994) for the Replacement model, Nei (1995) for the Transformation model, and Hammer et al. (1995), Horai et al. (1996), Omoto et al. (1997), Sokal et al. (1998), Tajima et al. (2002) for the Admixture model. Evidences from Y Chromosome Analyses Hammer et al. (2006) compared the Y chromosome haplo- group frequencies of Japanese to those of Northeastern Asian, Southeastern Asian, Central Asian, South Asian, and Oceanian population (Table 1). These populations comprise Y chromo- some Haplogroups C, D, NO, N, O, etc. Haplogroup C, D, N, and O account for 98.9% of contemporary Japanese. Figur e 2. Three competing hypotheses on the origin of contemporary Japanese. The rounded rectangles are gene pool and the arrows are gene flow. Table 1. Frequencies of the Y chromosome haplogroups in Japanese and the ref erence pop ulations (%). Haplotypea Japanese NEAb SEAb CASb SASbOCEb C2a1-P33 17.2 C2*-M38 2.2 8.1 C*-RPS4Y 3.1 0.2 2.6 8.6 C3*-M217 1.9 21.3 2.7 17.4 C3c-M86 1.2 23.6 7.9 C1-M8c 5.4 D1-M15 2.6 4.3 D*-M174 2.1 D3a-P47 9.1 D2*-P37.1c 3.9 0.2 D2a*-M116.1 c16.6 0.5 D2a1*-M125 c12.0 0.5 D2a1a-P42 c 2.3 N1a-M128 0.7 N1*-LLY22g1.2 1.6 3.8 1.4 N1b-P43 1.1 3.1 N1c-M178 0.4 10.0 0.3 1.0 NO-M214 c 2.3 0.2 0.4 0.2 O2a1a-M111 8.1 O2a1*-M95 1.9 0.5 6.3 7.9 O2*-P31 2.3 3.2 0.5 O2b*-SRY4657.7 6.3 0.4 0.5 O2b1-47z c 22.0 0.7 0.6 O*-M175 0.7 0.1 0.5 O3a1c-0026113.1 5.2 19.8 1.9 0.2 0.5 O3*-M122 6.6 4.8 8.8 1.4 9.1 O3a2c1-M13410.4 10.7 12.4 15.5 0.2 1.4 O1a*-M119 1.1 11.4 0.7 2.9 O1a2-M110 2.3 0.5 Others 1.1 8.5 11.5 32.8 89.150.7 Note: a. Haplogroup no menclature follows Karafet et al., 2008 ( for Haplogro up C, D, and N) and Yan et al., 2011 (for Haplogroup O); b. NEA, Northeast Asian; SEA, Southeast Asian; CAS, Central Asian; SAS, South Asian; OCE, Oceania (Hammer et al. 2006); c. The Japanese-specific haplogroups. Haplogroup O The frequency of haplogroup O is ranging from 46.2% - 62.3% on main island Japanese and 37.8% on Okinawa Japanese, but absent in the northern Hokkaido Ainu population. There are two major sub-haplogroups of haplogroup O in Japanese: O2 defined by SNP M31 and O3 defined by SNP M122. Within sub-haplogroup O2, Japanese/Korean-specified sub-haplogroup O2b1 defined by SNP 47z exhibits higher frequencies on main islands than Okinawa, while no Japanese-specific O3 sub-hap- logroups has been identified. Estimated by Y-STRs data and the Y chromosome most recent common ancestors (YMRCA) algorithm (Stumpf et al., 2001), 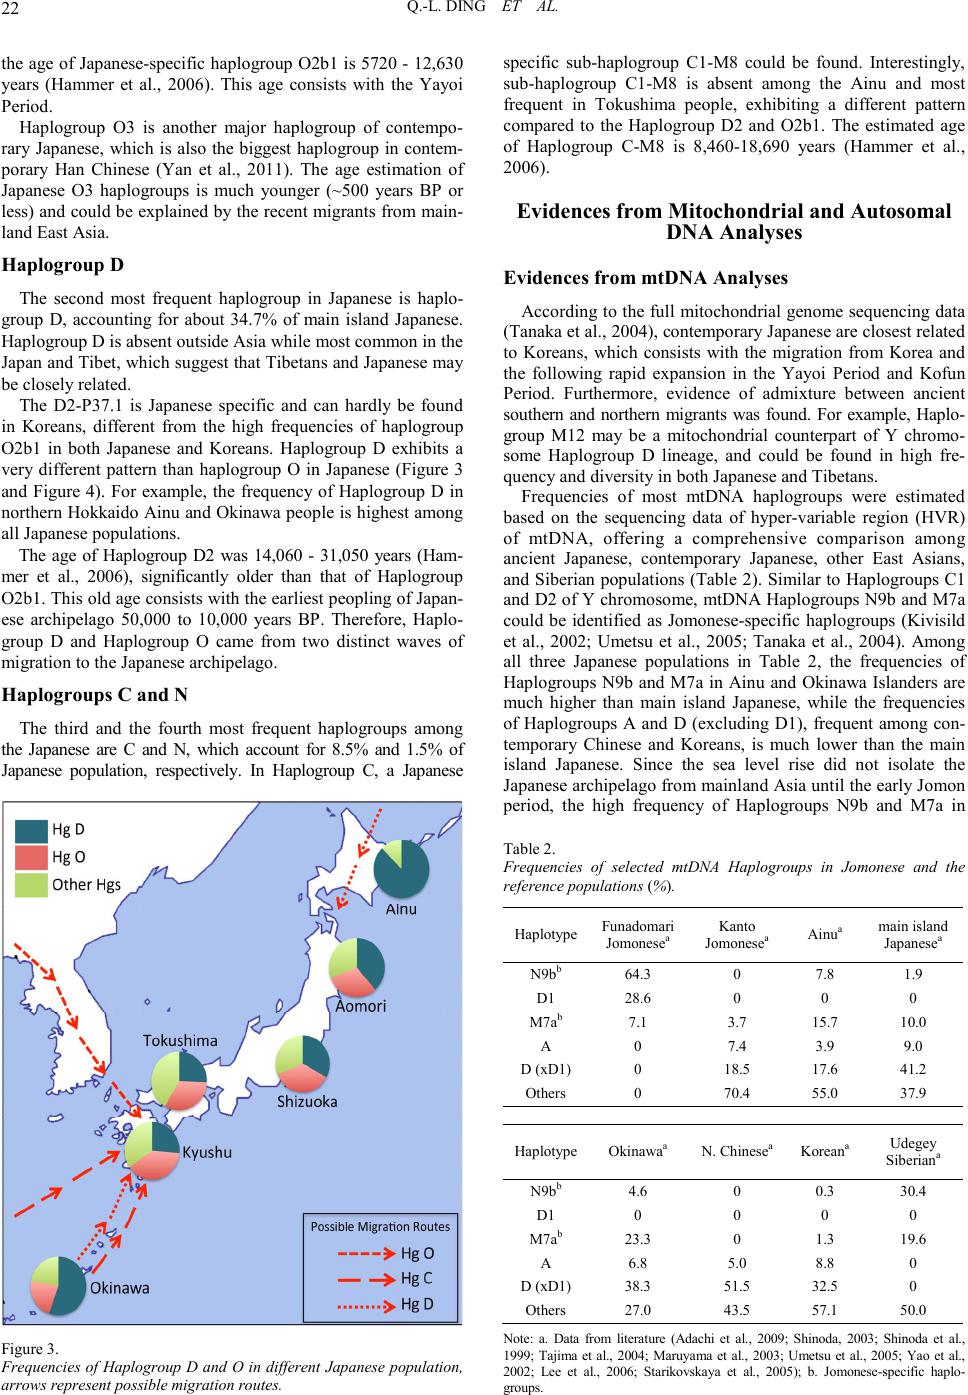 Q.-L. DING ET AL. 22 the age of Japanese-specific haplogroup O2b1 is 5720 - 12,630 years (Hammer et al., 2006). This age consists with the Yayoi Period. Haplogroup O3 is another major haplogroup of contempo- rary Japanese, which is also the biggest haplogroup in contem- porary Han Chinese (Yan et al., 2011). The age estimation of Japanese O3 haplogroups is much younger (~500 years BP or less) and cou ld be explai ned by the recent migrant s from main- land East Asia. Haplog r oup D The second most frequent haplogroup in Japanese is haplo- group D, accounting for about 34.7% of main island Japanese. Haplogroup D is absent outside Asia while most common in the Japan and Tibet, which suggest that Tibetans and Japanese may be closely related. The D2-P37.1 is Japanese specific and can hardly be found in Koreans, different from the high frequencies of haplogroup O2b1 in both Japanese and Koreans. Haplogroup D exhibits a very different pattern than haplogroup O in Japanese (Figure 3 and Figure 4). For example, the frequency of Haplogroup D in northern Hokkaido Ainu and Okinawa people is highest among all Japanese populations. The age of Haplogroup D2 was 14,060 - 31,050 years (Ham- mer et al., 2006), significantly older than that of Haplogroup O2b1. This old age consists with the earliest peopling of Japan- ese archipelago 50,000 to 10,000 years BP. Therefore, Haplo- group D and Haplogroup O came from two distinct waves of migration to the Jap anese archipelago . Haplog r oups C and N The third and the fourth most frequent haplogroups among the Japanese are C and N, which account for 8.5% and 1.5% of Japanese population, respectively. In Haplogroup C, a Japanese Figur e 3. Frequencies of Haplogroup D and O in different Japanese population, arrows represent possible migration routes. specific sub-haplogroup C1-M8 could be found. Interestingly, sub-haplogroup C1-M8 is absent among the Ainu and most frequent in Tokushima people, exhibiting a different pattern compared to the Haplogroup D2 and O2b1. The estimated age of Haplogroup C-M8 is 8,460-18,690 years (Hammer et al., 2006). Evidences from Mitochondrial and Autosomal DNA Analyses Evidences from mtDNA Analyses According to the full mitochondrial genome sequencing data (Tanaka et al. , 2004 ), con tempor ary Japanese are cl osest related to Koreans, which consists with the migration from Korea and the following rapid expansion in the Yayoi Period and Kofun Period. Furthermore, evidence of admixture between ancient southern and northern migrants was found. For example, Haplo- group M12 may be a mitochondrial counterpart of Y chromo- some Haplogroup D lineage, and could be found in high fre- quency and diversity in both Japanese and Tibetans. Frequencies of most mtDNA haplogroups were estimated based on the sequencing data of hyper-variable region (HVR) of mtDNA, offering a comprehensive comparison among ancient Japanese, contemporary Japanese, other East Asians, and Siberian populations (Table 2). Similar to Haplogroups C1 and D2 of Y chromosome, mtDNA Haplogroups N9b and M7a could be identified as Jomonese-specific haplogroups (Kivisild et al., 2002; Umetsu et al., 2005; Tanaka et al., 2004). Among all three Japanese populations in Table 2, the frequencies of Haplogroups N9b and M7a in Ainu and Okinawa Islanders are much higher than main island Japanese, while the frequencies of Haplogroups A and D (excluding D1), frequent among con- temporary Chinese and Koreans, is much lower than the main island Japanese. Since the sea level rise did not isolate the Japanese archipelago from mainland Asia until the early Jomon period, the high frequency of Haplogroups N9b and M7a in Table 2. Frequencies of selected mtDNA Haplogroups in Jomonese and the ref erence pop ulation s (%). Haplotype Funadomari Jomonesea Kanto Jomonesea Ainua main island Japanesea N9bb 64.3 0 7.8 1.9 D1 28.6 0 0 0 M7ab 7.1 3.7 15.7 10.0 A 0 7.4 3.9 9.0 D (xD1) 0 18.5 17.6 41.2 Others 0 70.4 55.0 37.9 Haplotype Okinawaa N. Chinesea Koreana Udegey Siberiana N9bb 4.6 0 0.3 30.4 D1 0 0 0 0 M7ab 23.3 0 1.3 19.6 A 6.8 5.0 8.8 0 D (xD1) 38.3 51.5 32.5 0 Others 27.0 43.5 57.1 50.0 Note: a. Data from literature (Adachi et al., 2009; Shinoda, 2003; Shinoda et al., 1999; Tajima et al., 2004; Maruya ma et al., 2003; Umetsu et al., 2005; Yao et al., 2002; Lee et al., 2006; Starikovskaya et al., 2005); b. Jomonese-specific haplo- groups. 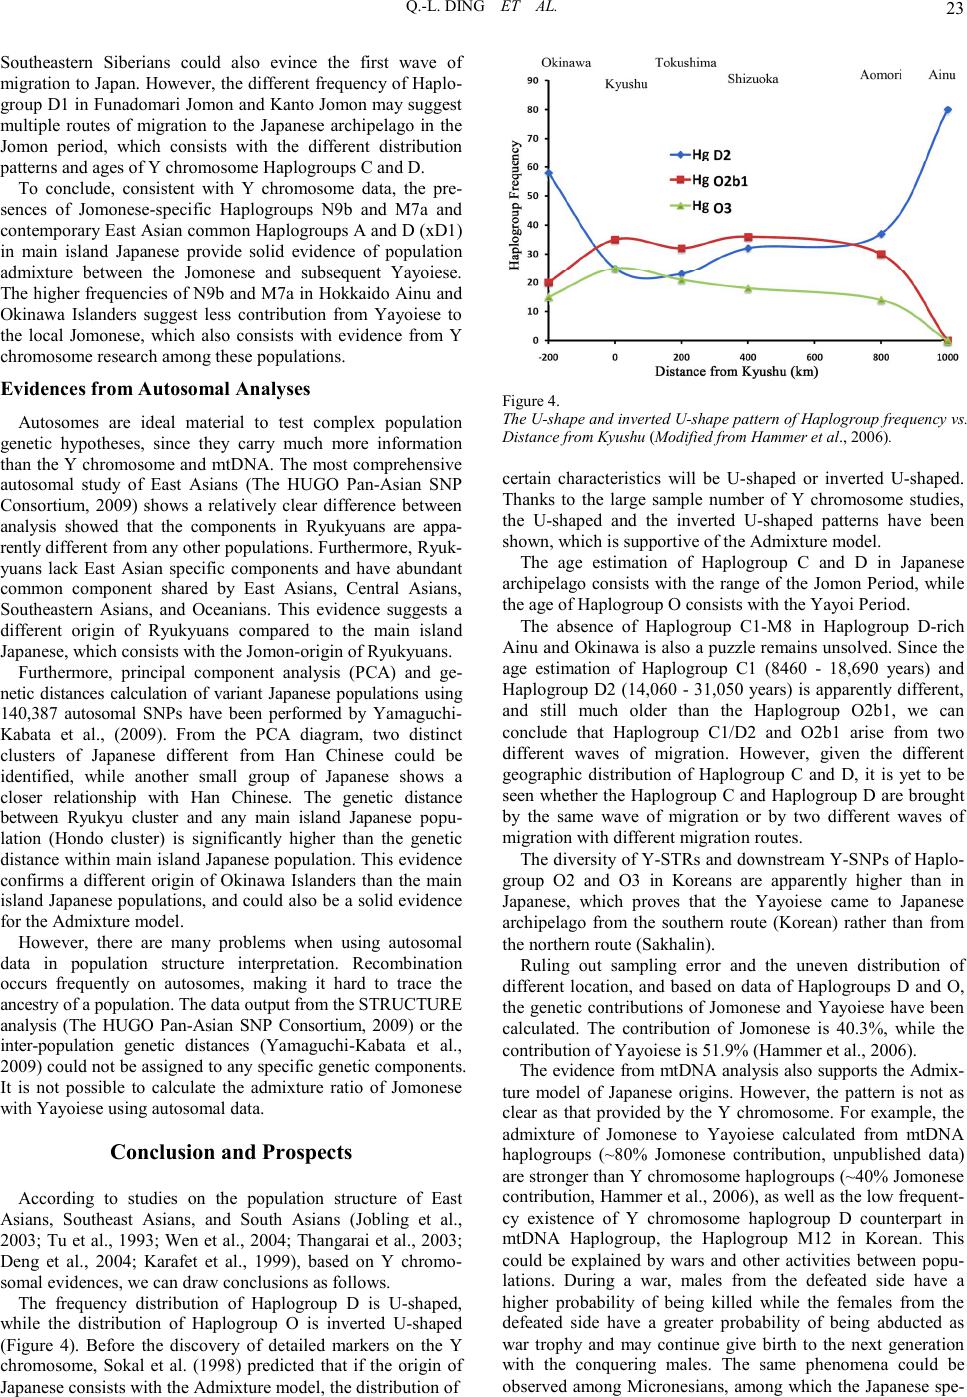 Q.-L. DING ET AL. 23 Southeastern Siberians could also evince the first wave of migration to Japan. However, the different frequency of Haplo- group D1 in Funadomari Jomon and Kanto Jomon may suggest multiple routes of migration to the Japanese archipelago in the Jomon period, which consists with the different distribution patterns and ages of Y chromosome Haplogroups C and D. To conclude, consistent with Y chromosome data, the pre- sences of Jomonese-specific Haplogroups N9b and M7a and contemporary East Asian common Haplogroups A and D (xD1) in main island Japanese provide solid evidence of population admixture between the Jomonese and subsequent Yayoiese. The higher frequencies of N9b and M7a in Hokkaido Ainu and Okinawa Islanders suggest less contribution from Yayoiese to the local Jomonese, which also consists with evidence from Y chromosome research among these p opulations. Evidences from Autosomal Analyses Autosomes are ideal material to test complex population genetic hypotheses, since they carry much more information than t he Y chromosome and mtDNA. The most comprehen sive autosomal study of East Asians (The HUGO Pan-Asian SNP Consortium, 2009) shows a relatively clear difference between analysis showed that the components in Ryukyuans are appa- rently different from any other populations. Furthermore, Ryuk- yuans lack East Asian specific components and have abundant common component shared by East Asians, Central Asians, Southeastern Asians, and Oceanians. This evidence suggests a different origin of Ryukyuans compared to the main island Japanese, which consists with the Jomon-origin of Ryukyuans. Furthermore, principal component analysis (PCA) and ge- netic distances calculation of variant Japanese populations using 140,387 autosomal SNPs have been performed by Yamaguchi- Kabata et al., (2009). From the PCA diagram, two distinct clusters of Japanese different from Han Chinese could be identified, while another small group of Japanese shows a closer relationship with Han Chinese. The genetic distance between Ryukyu cluster and any main island Japanese popu- lation (Hondo cluster) is significantly higher than the genetic distance within main island Japanese population. This evidence confirms a different origin of Okinawa Islanders than the main island Japanese populations, and could also be a solid evidence for the Admixture model. However, there are many problems when using autosomal data in population structure interpretation. Recombination occurs frequently on autosomes, making it hard to trace the ancestry of a population. The data output from the STRUCTURE analysis (The HUGO Pan-Asian SNP Consortium, 2009) or the inter-population genetic distances (Yamaguchi-Kabata et al., 2009) could not be assigned to any specific genetic components. It is not possible to calculate the admixture ratio of Jomonese with Yayoiese using autosomal data. Conclusion and Prospects According to studies on the population structure of East Asians, Southeast Asians, and South Asians (Jobling et al., 2003; Tu et al., 1993; Wen et al., 2004; Thangarai et al., 2003; Deng et al., 2004; Karafet et al., 1999), based on Y chromo- somal evid ences, we can dr aw conclusions as follo ws. The frequency distribution of Haplogroup D is U-shaped, while the distribution of Haplogroup O is inverted U-shaped (Figure 4). Before the discovery of detailed markers on the Y chromosome, Sokal et al. (1998) predicted that if the origin of Japanese consists with the Admixture model, the distribution of Figur e 4. The U-sha pe and inve rted U-s hape patt ern of Hapl ogro up frequ ency vs. Dist an ce from Kyushu (Modified from Hammer et al., 2006). certain characteristics will be U-shaped or inverted U-shaped. Thanks to the large sample number of Y chromosome studies, the U-shaped and the inverted U-shaped patterns have been shown, which is supportive of the Admixture model. The age estimation of Haplogroup C and D in Japanese archipelago consists with the range of the Jomon Period, while the age of Haplogroup O consists with the Yayoi Period. The absence of Haplogroup C1-M8 in Haplogroup D-rich Ainu and Okinawa is also a pu zzle remains u nsol ved. Si nce the age estimation of Haplogroup C1 (8460 - 18,690 years) and Haplogroup D2 (14,060 - 31,050 years) is apparently different, and still much older than the Haplogroup O2b1, we can conclude that Haplogroup C1/D2 and O2b1 arise from two different waves of migration. However, given the different geographic distribution of Haplogroup C and D, it is yet to be seen whether the Haplogroup C and Haplogroup D are brought by the same wave of migration or by two different waves of migration with different migration routes. The diversity of Y-STRs and downstream Y-SNPs of Haplo- group O2 and O3 in Koreans are apparently higher than in Japanese, which proves that the Yayoiese came to Japanese archipelago from the southern route (Korean) rather than from the northern route (Sakhalin). Ruling out sampling error and the uneven distribution of different location, and based on data of Haplogroups D and O, the genetic contributions of Jomonese and Yayoiese have been calculated. The contribution of Jomonese is 40.3%, while the contribution of Yayoiese is 51.9% (Hammer et al., 2006). The evidence from mtDNA analysis also supports the Admix- ture model of Japanese origins. However, the pattern is not as clear as that provided by the Y chromosome. For example, the admixture of Jomonese to Yayoiese calculated from mtDNA haplogroups (~80% Jomonese contribution, unpublished data) are stronger than Y chromosome haplogroups (~40% Jomonese contribu tion, Hammer et al., 2006), as well as the lo w frequent- cy existence of Y chromosome haplogroup D counterpart in mtDNA Haplogroup, the Haplogroup M12 in Korean. This could be explained by wars and other activities between popu- lations. During a war, males from the defeated side have a higher probability of being killed while the females from the defeated side have a greater probability of being abducted as war trophy and may continue give birth to the next generation with the conquering males. The same phenomena could be observed among Micronesians, among which the Japanese spe-  Q.-L. DING ET AL. 24 cific Y Haplogroup D2b1 is found in Micronesians at low fre- quentcy due to the prolonged Japanese dominance of Micro- nesia before the end of the World War II. Furthermore, information of mitochondrial DNA hyper- variation regions is very limited and results in large standard error. The calculation of the admixture ratio based on HVR is problematic. Whole mitochondrial genome sequencing on differ- rent populations is required to increase the reliability of admix- ture ratio and other inference based on mitochondrial evi- dences. The evidence from autosomal analyses is even weaker; we can only conclude that gene flow between different populations has occurred in Japanese population throughout history. More and more recent studies suggest that, based on Y chromosome, mitochondrial DNA, and autosomal analyses, the Admixture model is the best-fit model. Although the rough outline of contemporary Japanese migra- tion routes has been drawn, many small puzzles remain un- solved. For example, is the extremely high admixture ratio of mitochondrial DNA of Jomonese reliable? Is the Y Haplo- groups C and D arrived at Japanese archipelago at the same time? With the development of next-generation sequencing and advanced sampling, tho se puzzles are expected to be addressed in the near future. Acknowledgements QLD was supported by Top Talents in Basic Sciences pro- gram of Chinese National Ministry of Education. We thank Shi Yan, Lan-Hai Wei, and Hong-Xiang Zheng for sharing their dataset and opinions. References Adachi, N., Shinoda, K. I., Umetsu, K., & Matsumura, H. (2009). Mitochondrial DNA analysis of Jomon skeletons from the Funado- mari site, Hokkaido, and its implication for the origin of Native Ame r ican. Am er ica n J our n al of Physi c al Anthr op ol ogy, 138, 25 5-2 65. doi:10. 1002/ ajpa.20923 Anderson, S., Bankier, A. T., Barrell, B. G., De Bruijn, M. H. L., Coul- son, A. R., Drouin, J. et al. (1981). Sequence and organization of the hu man mitoch ondrial genome. Nature, 290, 457-465. doi:10.1038/290457a0 Arctander, P. (1999). Mitochondrial recombination? Science, 284, 2090-2091. doi:10.1126/science.284.5423.2089e Bowcock, A. M., Ruiz-Linares, A., Tomfohrde, J., Minch, E., Kidd, J. R., & Ca valli-Sforza, L. L. (199 4). High resolution of hu man evolu- tionary trees with polymorphic microsatellites. Nature, 368, 455-457. doi:10.1038/368455a0 Cavalli-Sforza, L. L., Menozzi, P., & Piazza, A. (1994). The history and ge o gr a p hy of human ge nes . Princeton, NJ: Princeton University. Chard, C. S. (1974). Northeast Asia in prehistory. Madison, WI: Uni- versity of Wisconsin Press. Deng, W., Shi, B., He, X., Zhang, Z., Xu, J., Li, B. et al. (2004). Evolution and migration history of the Chinese population inferred from C hinese Y- chrom osome evi denc e. Journal of Human Genetics, 49, 33 9- 3 4 8. doi:10.1007/s 10038-004-0 154-3 Hammer, M. F., & Horai, S. (1995). Y chromosomal DNA variation and the peopling of Japan. American Journal of Human Genetics, 56, 951-962. Hammer, M. F., Karafet, T. M., Park, H., Omoto, K., Harinara, S., Stoneking, M., & Horai, S. (2006). Dual origins of the Japanese: Common ground for hunter-gatherer and farmer Y chromosomes. Journal of Human Genetics, 51, 47-58. doi:10.1007/s10038-005-0322-0 Hanihara, K. (1984). Origins and affinities of Japanese viewed from cranial measurements. Acta Anthropogenetica, 8, 149-15 8. Hanihara, K. (1991). Dual structure model for the population history of Japanese. Japan Review, 2 , 1-33. Hisa o, B., Haj ime, S., & Shu ichiro N. (1989). Human skeleta l remain s of Jomon period from Minamitsubo shell-mound site in Ibaraki Prefecture, East Japan. Bulletin of the National Science Museum, Tokyo, Serial D, 15, 1-40. Hisao, B., Shuichiro, N., & Seiho, O. (1998). Minatogawa hominid fossils and the evolution of Late Pleistocene humans in East Asia. Anthropological Science, 106, 27-45. Horai, S., Murayama, K., Hayasaka. K., Matsubayashi, S., Hattori, Y., Fucharoen, G. et al. (1996). mtDNA polymorphism in East Asian populations, with special reference to the peopling of Japan. Ameri- can Journal of Human Genetics, 59, 5 79-590. Howells, W. W. (1966). The Jomon people of Japan: a study by discriminant analysis of Japanese and Ainu crania. Paper of the Peabody Museum of Archeology and Ethnology, Harvard University, 57, 1-4. Jobling, M. A., & Tyler-Smith, C. (2003). The human Y chromosome: an evolutionary marker comes of age. Nature Reviews Genetics, 4, 598-612. doi:10.1038/nrg1124 Karafet, T. M., Mendez, F. L., Mellerman, M. B., Underhill, P. A., Zegura, S. L., & Hammer, M . F. (2008). New bi nary polymorp hism s reshape and increase resolution of the human Y chromosomal haplogroups tree. Genome Research , 18, 830-8 3 8. doi:10.1101 /gr.7172 008 Karafet, T. M., Zegura, S. L., Posukh, O., Osipova, L., Bergen, A., Long, J. et al. (1999). Ancestral Asian sources(s) of New World Y-chromo- some founder haplotypes. American Journal of Human Genetics, 64, 817-831. doi:10.1086/302282 Ke, Y., Bing, S., Song, X., Lu, D., Chen, L., Li, H. et al. (2001). African origin of modern humans in East Asia: A tale of 12,000 Y chromosomes. Scie nc e, 2 92 , 1151-1153. doi:10.1126/science.10 60011 Kivisild, T., Tolk, H.V., Parik, J., Wang, Y., Papiha, S. S., Bandelt, H. J., & Villems, R. (2002). The emerging limbs and twigs of the East Asian mtDNA tree. Molecular Biology and Evolution, 19, 1737- 1751. Koyama, S. (1978). Jomon subsistence and population. Senri Ethno- logical Stu dies, 2, 1-65. Lee, H. Y., Yoo, J. E., Park, M. J., Chung, U., Kim, C. Y., & Shin, K. J. (2006). East Asian mtDNA haplogroup determination in Koreans: haplogroup-level coding region SNP analysis and subhaplogroup- level control region sequence analysis. Electrophoresis, 27, 4408- 4418. doi:10.1002/elps.200600151 Maruyama, S., Minaguchi, K., & Saitou, N. (2003). Sequence polymer- phisms of the mitochondrial DNA control region and phylogenetic analysis of mtDNA lineages in the Japanese populations. Internal Journal of Legal Medicine, 117, 218-225. doi:10.1007/s00414-003-0379-2 Matsu’ura, S., & Kondo, M. (2010). Relative chronology of the Minatogawa and the Upper Minatogawa series of human remains from Okinawa Island, Japan. Anthropological Science, Advance Publication. Mizogu ch i , Y. (1986). C ont ribu ti ons of preh i stori c Far East p opu lat ions to the population of modern Japan: A Q-mode path analysis based on cranial measurements. In T. Akazawa & C. M. Aikens (Eds), Prehis- toric hunter-gatherers in Japan, No. 27 (pp. 107-136). Tokyo: Uni- versity of Tokyo Press. Nei, M. (1995). The origins of human population: genetic, linguistic, and archeological data. In S. Brenner & K. Hanihara, (Eds.), The origin and past of modern humans as viewed from DNA (pp. 77-91). Singapore and London: World Scientific. Omoto, K., & Saitou, N. (1997). Genetic origins of the Japanese: A parti a l supp ort for th e dua l st ruct u re hypot h esi s . American Journal of Physical Anthropology, 102 , 437-446. doi:10.1002/(SICI)1096-8644(199704)102 :4<437 ::AID-AJPA1>3.0. CO;2-P Pakend orf, B., & Ston ekin g, S. (2005). Mitoch ondrial DNA and human evolution. Annual Review Genomics Human Genetic s , 6, 165-183. doi:10.1146/annurev.gen om .6.080604.16224 9 Shinoda, K. (2003). DNA analysis of the Jomon skeletal remains ex- cavated f r o m S himo -O hta shell m idde n, Chiba pr e fe ctur e (in Ja pane s e ) . Report for Sohnan Research Instutite for Cultual Properties, 50, 201-  Q.-L. DING ET AL. 25 205. Shinoda, K., & Kanai, S. (1999). Intracemetry genetic analysis at the Nakazuma Jomon site in Japan by mitochondrial DNA sequencing. Anthropological Science, 107, 129-140. Sokal, R. R., & Thomson, B. A. (1998). Spatial genetic structure of huma n popul ation in J a pan. Human Biology, 70, 1-22. Starikovskaya, E. B., Sukernik, R. I., Derbeneva, O. A., Volodko, N. V., Ruiz-Pesini, E., Torroni, A., et al. (2005). Mitochondrial DNA diversity in indigenous populations of the southern extent of Siberia, and the origins of native American haplogroups. Annual Hu ma n Gene - tics, 69, 67- 89. doi:10.1046/j.1529-8817.2003.00127.x Stumpf, M. P. H., & Goldstein, D. B. (2001). Genealogical and evolu- tionary inference with the human Y chromosome. Science, 291, 1738-1742. doi:10.1126/science.291.5509.1738 Suzuki, H. (1981). Racial history of the Japanese. In I. Schwidetzky, (Ed.), Rassengeschichte der Menschheit, 8 (pp. 7-69). Munich: Lie- ferung Oldenbourg. Suzuki, H. (1982). Skulls of the Minatogawa man. In H. Suzuki & Hanihara, K. (Eds.), The Minatogawa man: The upper Pleistocene man from the island of Okinawa, No. 19 (pp. 7-49). Tokyo: Univer- sity of Tok yo Pr es s . Tajima, A., Hayami, M., Tokunaga, K., Juji, T., Matsuo, M., Marzuki, S., Omoto, K., et al. (2004). Genetic origins of the Ainu inferred from combined DNA analyses of maternal and paternal lineages. Journal of Human Genetics, 49, 187-193. doi:10.1007/s10038-004-0131-x Tajima, A., Pan, I. H., Fucharoen, G., Fucharoen, S., Matsuo, M., Tokunaga, K. et al. (2002). Three major lineages of Asian Y chromo- somes: implications for the peopling of east and Southeast Asia. Human Genetics, 110, 80- 88. doi:10.1007 /s 00439-001 -0651-9 Tanaka, M., Cabrera, V. M., Gonzalez, A. M., Larruga, J. M., Takeyasu, T., Fuku, N., et al. (2004). Mitochondrial genome variation in East ern Asi a and th e peop lin g of Japan . Geno me Res ea rch , 14 , 1832- 1850. doi:10 .1101/ gr.2286304 Thangaraj, K., Singh, L., Reddy, A. G., Rao, V. R., Sehgal, S. C., Underhill, P. A. et al. (2004). Genetic affinities of the Andaman Islanders, a vanishing human population. Current Biology, 13, 86-93. doi:10.1016/S0960-9822(02)01336-2 The HUGO Pan-Asian SNP Consortium (2009). Mapping human genetic diversity in Asia. Science, 326, 1541-1545. doi:10.1126/science.11 77074 Tu, J. F., & Yip, V. F. (1993). Ethnic groups in China. Beijing and New York: Science Press. Tuner, C. G. (1976). Dental evidence on the origins of the Ainu and Japanese. Science, 193, 911-913. doi :10.112 6/scien ce.7818 41 Umetsu, K., Tanaka, M., Yuasa, I., Adachi, N., Miyoshi, A., Kashimura, S. et al. (2005). Multiplex amplified product-length polymorphism analysis of 36 mitochondrial single-nucleotide polymorphisms for haplogrouping of East Asian populations. Electrophore sis, 26, 91 -98. doi:10.1002/elps .2004061 29 Underhill, P. A., Jin, L., Lin, A. A., Mehdi, S. Q., Jenkins, T., Vollrath, D. et al. (1997). Detection of numerous Y chromosome biallelic polymorphisms by denaturing high-performance liquid chroma- tography. Genome Research, 7, 996-1005. Vigilant, L., Stoneking, M., Harpending, H., Hawkes K., & Wilson A. C. (1991). African population and the evolution of human mito- chondrial DNA. Scien ce, 253, 1503-1507. doi:10.1126/science.18 40702 Wang, C. C., Yan, S., & Li, H. (2010). Surnames and the Y chromo- somes (in Chinese). Communica tion o n Con tempora ry An thropol ogy, 4, 26-33. doi:10.4236/coca.2010. 41005 Wen, B., Xie, X., Gao, S., Li, H., Shi, H., Song, X. et al. (2004). Analyses of genetic structure of Tibeto-Burman population reveals sex-biased admixture in southern Tibeto-Burmans. American Journal of Human Genetics, 74, 856-865. doi:10.1086/386292 Yamaguchi-Kabata, Y., Nakazono, K., Takahashi, A., Saito, S., Hosono, N., Nakamura, Y., & Kamatani, N. (2009). Japanese population structure, based on SNP genotypes from 7003 individuals compared to other et hni c groups: effec t on populati on-ba sed ass ociat ion stud ies. American Journal of Human Genetics, 83, 445-456. doi:10.1016/j.ajhg.2008.08.0 19 Yan, S., Wang, C. C., Li, H., Li, S. L., Jin, L., & The Genographic Consortium (2011). An updated tree of Y-chromosome Haplogroup O and revised phylogenetic positions of mutations P164 and PK4. European Journal of Human Genetics, 19, 1013 -1015. doi:10.1038/ejhg.2011.64 Yao, Y. G., Kong, Q. P., Bandelt, H. J., Kivisild, T., & Zhang, Y. P. (2002). Phylogenetic differentiation of mitochondrial DNA in Han Chinese. American Journal of Human Genetics, 70, 635 -651. doi:10.1086/338999 Yao, Y. G., Lu, X. M., Luo, H. R., Li, W. H., & Zhang, Y. P. (2000). Gene admixture in the Silk Road region of China: Evidence from mtDNA and melanocortin 1 receptor polymorphism. Genes & Gene - tic Systems, 75, 173- 1 78. doi:1 0.1266/ggs. 75.173 Zhang, F., Su, B., Zhang, Y. P., & Jin, L. (2007). Genetic studies of human diversity in East Asia. Philosophical Transactions of the Royal Society B, 362, 987-995. doi:10.1098/rstb.2007.2028
|