 International Journal of Geosciences, 2011, 2, 513-522 doi:10.4236/ijg.2011.24054 Published Online November 2011 (http://www.SciRP.org/journal/ijg) Copyright © 2011 SciRes. IJG 513 Gravity Interpretation of the Cameroon Mountain (West Central Africa) Based on the New and Existing Data Jean V ict or K e n fac k 1, Jean Marie Tadjou1,2*, Joseph Kamguia1,2, Tabod Charles Tabod1, Ateba Bekoa3 1Department of Physic s, Faculty of Science, University of Yaoundé I, Yaoundé, Cameroon 2National institu te of Cartography, Yaoundé, Cameroon 3Institute for Geological and Mining Research, Yaoundé, Cameroon E-mail: jtadjou1@yahoo.fr Received August 3, 2011; revised September 12, 2011; accepted October 18, 2011 Abstract A new gravity survey of the Mount Cameroon area has enabled the definition of four major gravimetric do- mains, which coincide with the recognized structural units. In order to determine the nature of superficial and deep structures in this mountainous zone, new gravity data have been processed. These new gravity data was integrated to existing gravity data to propose the new complete Bouguer anomaly map of the region, and then to show major characteristics of the Bouguer gravity of this area. The interpretation of gravity patterns (bouguer maps) in terms of geological data, shows that the Mount Cameroon zone belongs to a wide positive anomaly; these anomalies display complex gravity domains, which seem to be similar to that due to major structural units in the region and volcanic activity of the mountain. In the mountain active zone in particular (between 2000 and 3800 m of altitude), the new anomaly map shows high gravity anomalies (from 11 to 60 mgal), coupled with low gravity at some stations (in the summit, 4060 m) where gravity anomaly is about –30 mgal. The steep WNW-ESE gravity gradients observed on the gravity maps mark the transition between positive in the south and negative anomalies. Keywords: Mount Cameroon, CVL, Gravity Anomalies, Bouguer Anomalies 1. Introduction Results of geological work over the surveyed area are subject to several syntheses or reinterpretations espe- cially concerning Mount Cameroon and its surrounding. But no gravity study has been taken concerning this ac- tive volcanic zone. In this study, we propose an interpre- tation of gravity data in terms of gravity anomaly to de- termine the structural feature of this area. The numerous data acquired in Cameroon, not only enrich the data bank of this area, but lead to a better mapping of the structure of this mountain zone and defining the gravity character- istics of Mount Cameroon area. All these data and its interpretations led the authors to propose the structure of the region. But no measurement has been taken earlier in this area over the altitude of 2000 meters. In this case all gravity characteristics were subject to ambiguity since the value of the anomaly at the summit of this mountain (height of 4060 meters) (Figure 4) was unknown. A closer look at the gravity map of the study area shows that there are many gaps in the gravity distribution, par- ticularly in the mountain zone. To solve the problem and have better understanding of the structure of this Mountain, a new gravity campaign has been carried out in the area, especially on the moun- tain zone between 2000 meters to 4060 meters of alti- tudes. These new data lead to better mapping and defin- ing of the gravity characteristics of the Cameroon Moun- tain and its surroundings. The study area, which is a part of the Cameroon Volcanic Line (CVL), is situated be- tween the parallels 3˚54′ and 4˚36′N, the meridians 8˚51′ and 9˚51′E (Figure 1). 2. Geology and Tectonics Mount Cameroon, one of Africa's largest volcanoes, rises to 4060 m above sea level in the coast of west Cameroon. The massive steep-sided volcano of dominantly basaltic- to-trachybasaltic composition forms a volcanic horst constructed above a basement of Precambrian metamor- phic rocks covered by Cretaceous to Quaternary sedi- ments [1]. More than 100 small cinder cones, often fis-  J. V. KENFACK ET AL. 514 Figure 1. location of the study area in the Cameroon Vol- canic Line (CVL) [8]. The study area, which is part of the CVL is shown as a rectangle; the small solid circles show approximate location of xenoliths. sure-controlled parallel to the long axis of the massive 1400 km volcano, occur on the flanks and surrounding lowlands [2]. During historical time, moderate explosive and effusive eruptions have occurred from both summit and flank vents. A 1922 SW-flank eruption produced a lava flow that reached the Atlantic coast, and a lava flow from a 1999 south-flank eruption stopped only 200 m from the sea. The Mount Cameroon is the most important volcano along the CVL, located at the boundary between the con- tinental and oceanic lithosphere [1]. The CVL tectonic structure (Figure 1) is the consequence of a series of parallel fissures oriented N30 and transversal events [2]. This line is made up of twelve (12) main volcanic centres, with ages ranging from 51.8 Ma to the present [3-7]. The regional map of the cones shows three major tec- tonic axes that control the volcanic activity [1]: the De- bundscha axis (N60 - 70), the Limbe axis (N140 - 150) and the Batoke axis (N30 - 40). Morphologically, Mount Cameroon is a stratovolcano, situated on a horst with boundary faults that are expressed by breaks of slopes [9]. It is bounded by the Tombel graben(not visible on Fig- ure 1) to the North and the Douala sedimentary basin to the South [10,11]. It has an elliptical shape, 50 km long and 35 km wide. Its basement (Pan-African granite and gneiss) is covered by cretaceous to quaternary sediments, observable in the Bomana maar at the NW of the massif [10,11]. Mount Cameroon lavas are essentially basanites, alka- line basalts, hawaiites and rare mugearites (Figure 2). Camptonite, a type of lamprophyre composed mainly of plagioclase and brown hornblende, has been recently described [12]. Moreover, xenoliths of dunites, wehrlites and clinopyroxenites have been discovered in the basa- nites of the strombolian Batoke cone located on the south flank of the massif, at 500 m above sea level [1,13]. Similar xenoliths of wehrlites and clinopyroxenites have been found in basaltic tephra of a strombolian cone situ- ated at 3000 m elevation on the north-western flank of Mount Cameroon [14]. 3. Gravity Observations and Reductions Existing gravity data were acquired firstly between 1963 and 1968, during a detailed gravity survey of Cameroon and Central Africa undertaken by the Office de la Re- cherche Scientifique et Technique d’Outre-Mer (OR- STOM) [16,17], and secondly between 1970 and 1990, by other geophysical (gravity) campaigns [18,19]. The gravity campaign was carried out on the Camer- oon mountain and its surroundings in November 2008 for the mountain zone (between 2000 and 4060 m), and December 2009 around the mountain. The gravity was corrected, in order to obtain the value of the Bouguer anomaly in each station. Gravity measurements were made with a Lacoste and Romberg Gravimeter having a calibration constant at 50˚C. Observations were made with respect to the base station in Buea Up station, which had earlier been tied to an international gravity station at the Douala airport, called “reseau martin”. Drift correc- tions were applied. Relative station elevations along all traverses were measured with Global positioning System and staff to estimated accuracy of better than 0.3 m. The station elevations lie between 0 and 4060 m above mean sea level at Tiko and Debundsha. Using the Digital Elevation Model (DEM) GLOBE, a suitable topographical map of the area was built to apply the terrain corrections in the area. Since altitudes vary between 0 and 4060 m (Figure 3), the rough topog- raphical map of the area was however constructed on the basis of all available height information including the elevations measured during the course of this survey. The topographical data measured and determined from GLOBE were used to estimate the magnitude of the ter- rain corrections. The uncertainty on the DEM and the error on the altitude of the stations constitute the main error corrections for the calculation of the Bouguer nomaly. All the data were tied to the GRS80 reference a Copyright © 2011 SciRes IJG  J. V. KENFACK ET AL. Copyright © 2011 SciRes. IJG Figure 2. Geological map of the study area [15]. The map consists of: 1. Feldspathoid rocks of Mount Etinde, 2. Alluvial for- mations, 3. Mio-pliocene and tertiary formations, 4. Cretaceous formations, 5. the Eocene formations, 6. Superior series (ba- salts sometimes andesic as streams and cinerites), 7. Alkali granites, 8. Atlantic ocean, 9. The Inferior series (basalts some- times andesic as streams and dy ke s), 10. Loc a lity. system. where, is the simple Bouguer anomaly in milligals; AL free air anomaly; Bouguer density of the earth in g/cc, w Bouguer density of water in g/cc; i Bouguer density of ice in g/cc; h Station elevation in metres; w water depth in metres (including ice); ice thickness in metres; hi h Free-air and Bouguer reductions based on mean den- sity of 2.67 g/cm3 were applied to reduce the observa- tions to a datum. The use of this value of density, slightly lower than the middle density of the samples appropri- ated on the study area, makes comfortable the compari- son of our results with those obtained in other regions of Cameroon. The free-air anomaly was calculated by sub- tracting the latitude correction (theoretical gravity) from the absolute gravity and adding a correction for the sta- tion elevation. The latitude correction requires the theo- retical gravity at the station location on the earth’s sphe- roid. The formula of free air anomaly is defined as [20]: c curvature correction. To take account of the topography effect of the area (between 0 and 4060 m), we apply the complete Bouguer anomaly correction. This complete Bouguer anomaly corrects the Bouguer anomaly for irregularities of the earth due to terrains in the vicinity of the observation point. Terrain corrections were calculated using a com- bination of the methods described by Nagy [21] and Kane [22]. To calculate corrections, the DEM data was “sampled” to a grid mesh centered on the station to be calculated. The correction was calculated based on near zone, intermediate zone and far zone contributions. In the near zone (0 to 1 cells from the station), the algo- rithm sums the effects of four sloping triangular sections, which describe a surface between the gravity station and the elevation at each diagonal corner. In the intermediate zone (1 to 8 cells), the terrain effect is calculated for each point using the flat topped square prism approach of Nagy [21]. In the far zone, (greater than 8 cells), the ter- rain effect is derived based on the annular ring segment approximation to a square prism as described by Kane [22]. 2 (0.3087677630.000439834 sin 0.000000072124602) AL a ss g hh (1) where AL is the Free air anomaly in milligals; a absolute gravity; latitude correction; hs station eleva- tion in metres and the latitude of the station. The for- mula accounts for the non-linearity of the free-air anom- aly as a function of both latitude and height above the geoids. The Bouguer anomaly corrects the free air anomaly for the mass of rock that exists between the station eleva- tion and the spheroid. For ground survey (including on lake surface survey) the Bouguer anomaly formula is: 0.0419088 BAL sww ii wc hh h (2) For more processing efficiency, the far zone calcula- ion can be optimized by de-sampling the outer zone to a t  J. V. KENFACK ET AL. 516 Figure 3. Topographic map of the study are a based on the Digital Elevation Model (DEM) GLOBE. The altitude in the area varied from 0 to 4060 (m), which is the new altitude value of the mount Cameroon based on GPS survey. coarser averaged grid (i.e. by enlarging the size of each ring segment to 2 × 2 cells beyond 8 cells, and to 4 × 4 cells beyond 16 cells, and so on). The calculation is car- ried from the Local Correction Distance up to the speci- fied Outer Correction Distance. The DEM grid is re- flected on its edges in order to always provide correc- tions out to the required radius. Any dummy values in DEM grid was interpolated by adjacent non-dummy values before terrain correction calculation. The system uses the grid average elevation to compensate for terrain effects in the area past the outer (regional) correction distance. The Geosoft program was used to calculate the full terrain corrections at each station by extracting an inter- polated milligal value from the regional correction grid generated and adding the local correction calculated from a local, more highly sampled DEM grid. The local cor- rection distance is the same as the one used to calculate the regional correction grid beyond that distance. The local DEM used is centered on the gravity survey area and extends at least a local correction distance beyond the edges of the area. Digital gridded terrain models (available from government sources) were used to sim- plify the application of regional terrain corrections. Be- cause the zone has a sufficient number of known eleva- tion points (X, Y and Elevation), a gridded terrain model was produced by using the Geosoft program. Using the terrain correction, the complete Bouguer anomaly was determined by applying the formula: CBB T (3) where CB is the complete Bouguer Anomaly; simple Bouguer anomaly and T terrain correction. This equation was used to determine the Bouguer anom- aly at any survey station in the area (Figure 4). The maximum error in the Bouguer anomaly value for any of the stations due to the error in height determination is not expected to exceed 0.15 mGal. All the data (new and existing) obtained after correc- tions were computed to obtain gravity anomaly maps of the area (Figures 5 and 6). The Bouguer anomaly varies between –72 mgal and 110 mgal (Figure 6). It is maxi- mum in the Limbe region and minimum to the Northeast of the study area. Figure 5 shows Bouguer anomaly map before 2008 and 2009 campaigns and Figure 6 shows Bouguer anomaly map after densification. We have in- terpreted separately the two Bouguer anomaly maps to etect all insufficiencies between the new and existing d Copyright © 2011 SciRes IJG 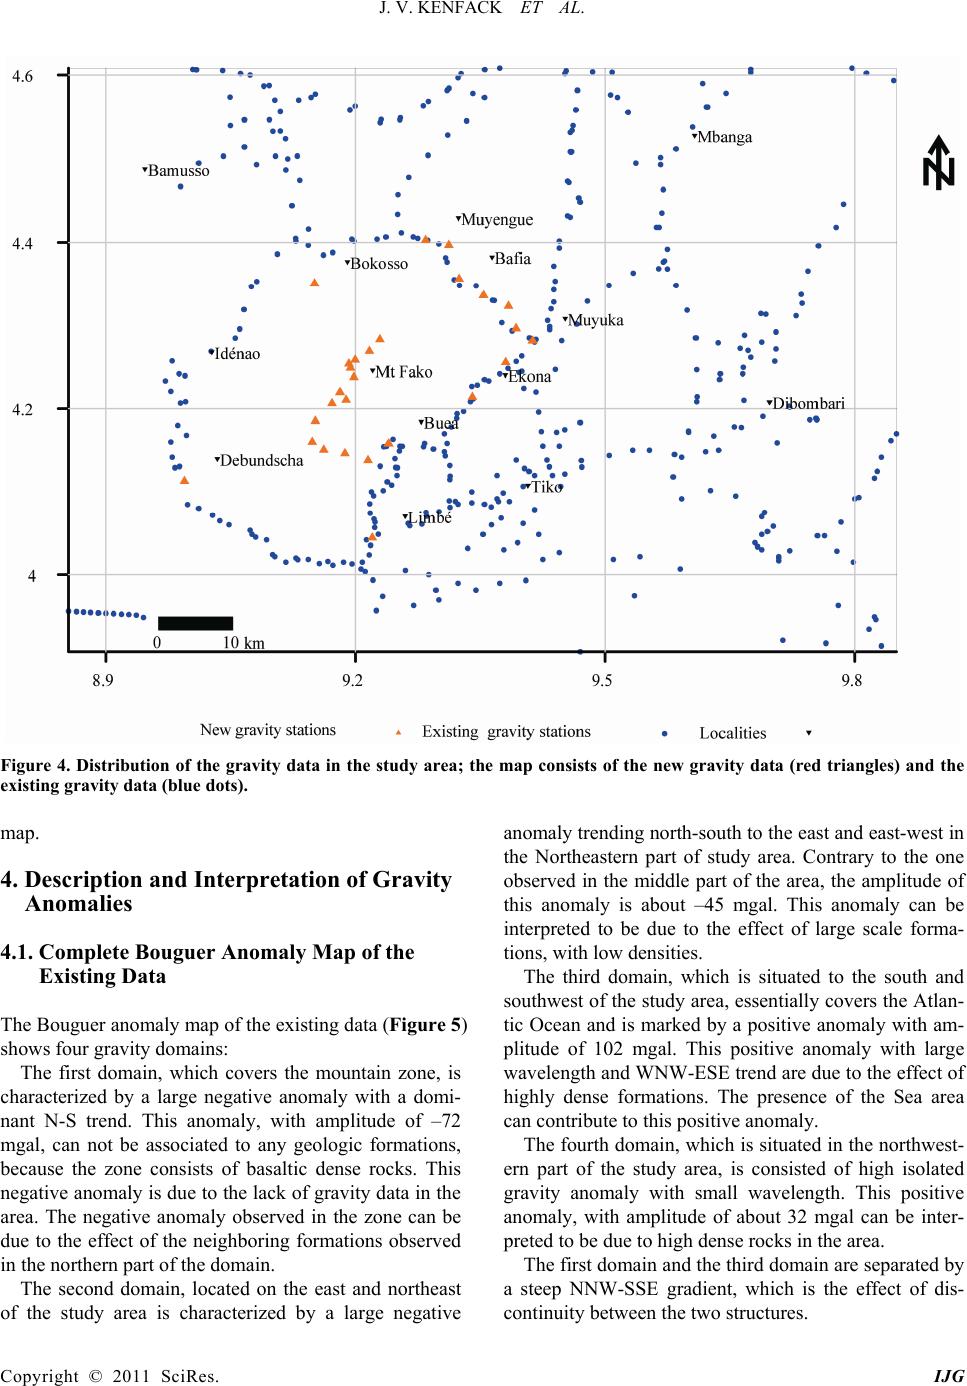 J. V. KENFACK ET AL. Figure 4. Distribution of the gravity data in the study area; the map consists of the new gravity data (red triangles) and the existing gravity data (blue dots). map. 4. Description and Interpretation of Gravity Anomalies 4.1. Complete Bouguer Anomaly Map of the Existing Data The Bouguer anomaly map of the existing data (Figure 5) shows four gravity domains: The first domain, which covers the mountain zone, is characterized by a large negative anomaly with a domi- nant N-S trend. This anomaly, with amplitude of –72 mgal, can not be associated to any geologic formations, because the zone consists of basaltic dense rocks. This negative anomaly is due to the lack of gravity data in the area. The negative anomaly observed in the zone can be due to the effect of the neighboring formations observed in the northern part of the domain. The second domain, located on the east and northeast of the study area is characterized by a large negative anomaly trending north-south to the east and east-west in the Northeastern part of study area. Contrary to the one observed in the middle part of the area, the amplitude of this anomaly is about –45 mgal. This anomaly can be interpreted to be due to the effect of large scale forma- tions, with low densities. The third domain, which is situated to the south and southwest of the study area, essentially covers the Atlan- tic Ocean and is marked by a positive anomaly with am- plitude of 102 mgal. This positive anomaly with large wavelength and WNW-ESE trend are due to the effect of highly dense formations. The presence of the Sea area can contribute to this positive anomaly. The fourth domain, which is situated in the northwest- ern part of the study area, is consisted of high isolated gravity anomaly with small wavelength. This positive anomaly, with amplitude of about 32 mgal can be inter- preted to be due to high dense rocks in the area. The first domain and the third domain are separated by a steep NNW-SSE gradient, which is the effect of dis- ontinuity between the two structures. c Copyright © 2011 SciRes. IJG  J. V. KENFACK ET AL. 518 Figure 5. Bouguer anomaly map of the existing data in the study area. Anomalies vary from –72 to 102 (mgals). The maxi- mum value, 102 (mgal) is found in the sea, and the minimum, –72 (mgal) in the mountain area where no data exist. 4.2. Complete Bouguer Anomaly Map of the Existing and New Gravity Data The Bouguer anomaly map (Figure 6) obtained by com- bination of both existing and new gravity data, shows a complex structure close to the mountain zone (between altitude 2000 and 3800 m). In the same case as the previous map, this Bouguer anomaly reveals four gravity domains. The first domain which covers a mountain zone, con- sists of both positive and negative anomalies. A closer look at the map shows that positive anomalies (10 to 32 mgal) appear in the centre part of the mountain, closely around the altitude 2000 to 3800 m. These anomalies are interpreted as representing the existence of highly dense rocks in the mountain zone. The anomaly in the summit of altitude about 4060 m, is relatively negative (about –30 mgal), and can be interpreted to be related to the intrusion of low density formation in that zone. On the other hand, we found in the northern and the southern part of the area, low gravity anomalies that can be associated to low density formations. The presence of steep gravity gradients at the boundary of the anomalies can be associated to crustal discontinuity between juxta- posed formations in the study area. It is possible that the anomaly observed in the northern part of the study area originats from different sources. As observed in the previous anomaly map, the second domain, located on the East and northeast of the study area is characterized by a large negative anomaly with wavelength trending north-south to the East and east- west in the Northeastern part of study area. This anomaly can be interpreted to be due to the effect of large scale formations, with low densities. The third domain, which is situated at the south and southwest, is essentially covered by the Atlantic Ocean and marked by positive anomalies with amplitude of 110 mgal. These positive anomalies with a large wavelength and WNW-ESE trend are due to the effect of highly dense formations. The presence of the sea area can con- tribute to this positive anomaly. The fourth domain, which is situated in the northwest- ern part of the study area, consists of high isolated gravity anomaly with a small wavelength. This positive anomaly, with amplitude of about 32 mgal can be inter- reted to be due to highly dense rocks in the area. p Copyright © 2011 SciRes IJG  J. V. KENFACK ET AL. Figure 6. Combined Bouguer anomaly map of the existing and new gravity data in the study area. Anomaly values vary from –72 to 110 (mgals). The maximum value, 110 (mgal) is found in the sea, and the minimum, –72 (mgal) around the mountain zone. In the mountain zone, anomalies vary from 11 to 60 (mgals), except in the summit where the value is –30 (mgal). The first domain and the third domain are separated by a steep NNW-SSE gradient, which is the effect of dis- continuity between the two structures. 4.3. Interpretation of Gravity Anomalies Maps A regional study shows that in general, high gravity anomalies prevail in the Mount Cameroon area. High gravity is well developed over the outcrops of volcanic rocks (Figure 2) indicating that these rocks are more dense than the basement rocks, an inference supported by the density measurements. Gravity gradients are generally steep over the outer contact of the ring dyke with the basement and this is indicative of steepness of this contact. The gravity observations lead us to individualize four distinct geological areas. The first domain, consisting of high gravity anomalies in the mountain zone, can be explained by the presence of high density rocks in the area. A close look of the geological map of the area (Figure 2) shows that this anomaly is situated in the zone consisting of basaltic formations. The positive anomalies in this mountain zone can be due to the alkali basalt, except those located above 2000 meters, which may indicate the presence of mugearite. This zone also consists of negative anomalies which correspond to the alkali basalts. The second domain, characterized by negative ano- malies in the eastern and northeastern part of the area, can be associated with the formation of the Douala sedimentary basin. The gravity signature of these ano- malies is found in the two gravity maps (Figures 5 and 6). The positive anomalies in Figures 5 and 6 seem to reflect the existence of deep heavy rocks that could be rocks of the oceanic crust. This positive anomaly extends toward the northwestern part of the area and can be interpreted as the presence of the high dense rocks in this sector. The presence of the Inferior series (basalts some- times andesitic as streams and dykes) can be the expres- sion of this anomaly. As observed on the two gravity maps (Figures 5 and 6), the most prominent gravity low developed over the sedimentary formations, reaching –72 mgal in the Douala sedimentary basin in the eastern part of the area. A narrow and elongated low of smaller amplitude found in Copyright © 2011 SciRes. IJG  J. V. KENFACK ET AL. 520 the northeastern part of the area is partly a continuation of the former low and lies over the extended arm of sedimentary complex. It may be the extension effect of the Douala sedimentary basin. A similar low follows the volcanic complex in the north and south of the mountain floor; this low is very poorly defined owing to the few stations in the regions. This broader feature lies over the basement outcrops and is interpreted to indicate the presence of subsurface tertiary rocks. This agrees with studies by Fitton [23] and Lee [24], who interrelated the CVL as a unique volcanic lineament which has both oceanic and continental sectors and consists of a chain of tertiary to recent, generally alkaline, volcanoes stretching from the Atlantic island of Pagalu to the interior of the African continent. The steep gravity gradient along the southern flank of the mountain is strongly indicative of the presence of hitherto unsuspected fault trending north-westward and collapsing south-westward. This structure is shown as a geophysically inferred fault. Other notable gravity anomalies are the highs found in the southern part of the area. These anomalies may be connected through a not so prominent high that runs northwestward, and can be interpreted as due to the presence of sea formations in the south and the volcanic formations in the northwest. 5. Discussion This study, based on previous and more recent quality gravity data (Figure 5), has strengthened some hypothe- ses already supported by the geological data but not ad- dressed by previous geophysical studies carried out in the study area so far. The increase in the quantity of gravity data has undoubtedly permitted us to draw a bet- ter Complete Bouguer anomaly map (Figure 6) of the region. In this study, the value of the Bouguer anomalies in the summit at about 4060 m is –30 mgal, compared to values obtained in the other parts of the mountain. In general, Bouguer anomalies are usually negative in the mountains because of isostasy since: the rock density of their root is lower, compared to the surrounding earth’s mantle. The regional highly negative Bouguer anomaly observed in the area suggests a deep seated source. Therefore, negative gravity anomalies observed in the East and northeast of the study area would indicate the presence of low density rocks. These anomalies may be due to the effect of alluvium, mio-pliocene and tertiary undifferentiated formations, belonging to the Douala sedimentary basin. The highly positive Bouguer gravity anomalies ob- served in the mount Cameroon area might be due to out- flows of high density upper mantle magnetic material or an indication of the thinning of the crust or metallic ore. At the scales between entire mountain ranges and ores bodies, positive Bouguer anomalies may indicate rock types (e.g. volcanic rocks). The positive Bouguer anomalies observed in the oce- anic areas are assigned to the thinning of the crust on the one hand and on the other hand to the existence of in- visible magmatic rocks on the surface. The results above show that the oceanic and continental crusts in the study area could have been formed by similar processes and there may be a general asthenospheric uplift [25]. Several geological and geophysical studies have been made to determine the features of the rocks coming from the Cameroon Volcanic Line. The seismic studies [26,27] show that the speed of waves is relatively slow in the Adamaoua region and, revealed the existence of a thick crust beneath the mountain. Poudjom Djomani et al. [25], showed by 2D1/2 mod- eling of two Bouguer anomaly profiles across the CVL, that the important negative anomaly centered on the Adamaoua is the consequence of an asthenospheric uplift in the upper mantle. This asthenospheric uplift is associ- ated to uplift of the crust basement; therefore creating positive anomalies of low amplitude that are superim- pose on the negative anomalies. All these results obtained along the CVL, based on seismic and other geophysical studies, enabled us to have detailed interpretation of anomalies observed in the Mount Cameroon area. One theory for the later development of the CVL around 30 Ma is that it coincides with development of a shallow mantle convection system centered on the man- tle plume, and is related to thinning and extension of the crust along the Cameroon line as pressures relaxed in the now stationary plate [28]. The mantle plume hypothesis is disputed by others, who say the region is quite differ- ent from what is predicted by that theory, and that a source in the lithospheric fracture is more likely to be the explanation [29]. The CVL may be due to a more complex interaction between a hotspot and Precambrian faults [30]. A gravity study of the southern part of the Adamawa plateau has shown a belt of dense rocks at an average depth of 8 km running parallel to the Foumban shear zone. The material appears to be an igneous intrusion that may have been facilitated by reactivation of the shear zone, and may be associated with the CVL [31]. Based on the fact that this area is the massive steep- sided volcano of dominantly basaltic-to-trachybasaltic composition and forms a volcanic horst constructed above a basement of Precambrian metamorphic rocks covered with Cretaceous to Quaternary sediments, the Copyright © 2011 SciRes IJG  J. V. KENFACK ET AL. anomalies were interpreted to be due to the volcanic rocks with high density contrast. The basaltic rocks in the oceanic and continental sectors of the Cameroon line are similar in composition, although the more evolved rocks are quite distinct. The similarity in basaltic rocks may indicate they have the same source. Since the lithosphere mantle below Af- rica must be different in chemical and isotopic composi- tion from the younger lithosphere below the Atlantic, one explanation is that the source is in the asthenosphere rather than in metasomatized lithosphere [23]. A differ- ent view is that the similarities are caused by shallow contamination of the oceanic section, which could be caused by sediments from the continent or by crustal blocks that were trapped in the oceanic lithosphere dur- ing the separation between South America and Africa [32]. During historical time, moderate explosive and effu- sive eruptions have occurred from both summit and flank vents. A SW-flank eruption produced a lava flow that reached the Atlantic coast, and a lava flow from a south- flank eruption stopped only 200 m from the sea. These lavas, which consist of high density volcanic rocks, are responsible for the high gravity anomaly in the flank of the mountain area. The eruption also provoked collapse in some parts of the mountain area. This collapsing is the cause of the negative anomalies observed around the mountain. The low anomalies in mountain area observed on the anomaly map of the old data could not be interpreted in terms of geological structures, due to the lack of gravity data in this area. Complementing the old data with the new gravity data, the Bouguer anomalies in the mountain are found to be more positive. In general, analysis of the Bouguer anomaly maps of the existing and new gravity data show that the densification of the gravity data brought supplementary information on and around the Cameroon Mountain. 6. Conclusions Our study, which is based on new and existing gravity data of the study area, permitted us to construct a new gravity map of the Cameroon Mountain zone. By com- paring both the geologic and topographic maps in the same zone, we have identified the structural features rep- resented by these anomalies. In general, the study area consists of high positive anomalies, especially in the area over the sea and the mountain area where there are mainly basaltic rocks. In addition to these positive ano- malies, negative anomalies (down to –30 mgal) are also found in the mountain zone especially on the summit where the altitude is about 4060 m; this negative anom- aly is interpreted as due to the collapsing of the crust in this zone. The negative anomalies found in the eastern, northern and northeastern parts of the study area are in- terpreted to be associated to the Douala sedimentary ba- sin. The negative anomalies found on and around the mountain are most likely due to the collapsing of the crust in that area. 7. Acknowledgements We thank the National Institute of Cartography (NIC), for financing the acquisition of the new data used in this work. 8. References [1] J. P. Tsafack, “Volcanisme Plio-Quaternaire du Mont Cameroun: Pétrologie, Minéralogie, Géochimie Isotopique, Géochronologie et Évolution de la Bordure Côtière,” Ph.D. Thèse Doctorat, Université de Yaoundé I, Cameroun, 2009. [2] K. C. Burke, and A. J. Whiteman, “Uplift, Rifting and the Break-Up of Africa,” In: D. H. Tarling, S. K. Runcorn, Eds., Implications of Continental Drift to the Earth Sci- ences, Academic Press, London, 1973, pp. 735-755. [3] J. G. Fitton and H. M. Dunlop, “The Cameroon Line, West Africa, and Its Bearing on the Origin of Oceanic and Continental Alkali Basalt,” Earth and Planetary Sci- ence Letters, Vol. 72, No. 1, 1985, pp. 23-38. doi:10.1016/0012-821X(85)90114-1 [4] Z. Itiga, P. J. T. Chakam, P. Wotchoko, P. Wandji, J. M. Bardintzeff and H. Bellon, “La Ligne du Cameroun: Volcanologie et géochronologie de trois régions (mont Manengouba, plaine du Noun et Tchabal Gangdaba),” Géochronique, Vol. 91, 2004, pp. 13-16. [5] J. Fosso, J. J. Ménard, J. M. Bardintzeff, P. Wandji, F. M. Tchoua and H. Bellon, “Les laves du mont Bangou: Une Première Manifestation Volcanique Éocène, à Affinité Tran- Sitionnelle, de la Ligne du Cameroun,” Comptes Rendus Géoscience, Vol. 337, No. 3, 2005, pp. 315-325. doi:10.1016/j.crte.2004.10.014 [6] B. Déruelle, I. Ngounouno and D. Demaiffe, “The Cam- eroon Hot Line (CHL): A Unique Example of Active Alka-Line Intraplate Structure in Both Oceanic and Con- tinental Lithospheres,” Comptes Rendus Geoscience, Vol. 339, 2007, pp. 589-600. [7] A. Moundi, P. Wandji, J. M. Bardintzeff, J. J. Ménard, L. C. Okomo, O. F. Mouncherou, E. Reusser, H. Bellon and F. M. Tchoua, “Les Basaltes Éocènes à Affinité Transi- tionnelle du Plateau Bamoun, Témoins d’un Réservoir Mantel-Lique Enrichi Sous la Ligne Volcanique du Cam- eroun,” Comptes Rendus Geoscience, Vol. 339, No. 6, 2007, pp. 396-406. doi:10.1016/j.crte.2007.04.001 [8] A. P. K. Tokam, C. T. Tabod, A. Nyblade, J. Julià, A. D. Wiens and M. E. Pasyanos, “Structure of the Crust be- neath Cameroon, West Africa, from the Joint Inversion of Copyright © 2011 SciRes. IJG  J. V. KENFACK ET AL. Copyright © 2011 SciRes IJG 522 Rayleigh Wave Group Velocities and Receiver Func- tions,” Geophysical Journal International, Vol. 183, No. 2, 2010, pp. 1061-1076. doi:10.1111/j.1365-246X.2010.04776.x [9] B. Déruelle, C. Moreau and E. N. Nkonguin, “Sur la ré- cente éruption du mont Cameroun (16 Octobre-12 No- vembre 1982),” Comptes Rendus de l’Académie des Sci- ences, Vol. 296, No. 2, 1983, pp. 807-812. [10] J. C. Dumort, “Caractères Chimiques des trois Volcanis- mes du Cameroun,” Bulletin du BRGM, Vol. 3, 1967, pp. 21-75. [11] J. P. Tsafack, P. Wandji, J.-M. Bardintzeff and D. Nkouathio, “Occurrence of a Sedimentary Basement un- der the Mount Cameroon Active Volcano (Cameroon Volcanic Line),” 26th ECGS (European Center for Geo- dynamics and Seismology) Workshop, Active Volcanism and Continental Rifting (AVCOR-07), Luxembourg, No- vember 2007, pp. 19-21. [12] I. Ngounouno, B. Déruelle, R. Montigny and D. Demaiffe, “Les camptonites du Mont Cameroun, Afrique,” Comptes Rendus Geoscience, Vol. 338, No. 8, 2006, pp. 537-544. doi:10.1016/j.crte.2006.03.015 [13] P. Wandji, J. P. Tsafack, J. M. Bardintzeff, D. G. Nkoua- thio, A. D. Kagou, H. Bellon and H. Guillou, “Xenoliths of Dunites, Wehrlites and Clinopyroxenites in the Basanites from Batoke Volcanic Cone (Mount Cameroon, Central Africa): Petrogenetic Implications,” Mineralogy and Petrology, Vol. 96, No. 1-2, 2009, pp. 81-98. doi:10.1007/s00710-008-0040-3 [14] B. Déruelle, I. Ngounouno and J. M. Bardintzeff, “Wehr- lites et Pyroxénites en Nodules dans les Basaltes du Mt. Cameroon: Évidence d’un Métasomatisme Mantellique,” 12th International Conference of the Geological Society of Africa, Yaoundé, 2001, pp. 39-40. [15] L. Marechal, “Carte Géologique de l’Ouest du Cameroun et de l. Adamaoua,” ORSTOM, Paris, 1975. [16] F. Collignon, “Gravimétrie de Reconnaissance de la Ré- publique Fédérale du Cameroun,” ORSTOM, Paris, 1968. [17] P. Louis, “Contribution Géophysique à la Connaissance Géologique du Bassin du lac Chad,” ORSTOM, Paris, 1970. [18] Y. Albouy and R. Godivier, “Cartes Gravimétriques de le République Centrafricaine,” ORSTOM, Paris, 1981. [19] C. Okereke, “A Gravity Study of the Lithospheric Struc- ture beneath West Africa Rift System in Nigeria and Cameroon,” Ph.D. Thesis, University of Leeds, Leeds, 1984. [20] W. A. Heiskanen and H. Moritz, “Physical Geodesy: San Francisco,” Freeman Press, San Francisco, 1967. [21] D. Nagy, “The Gravitational Attraction of a Right Rect- angular Prism,” Geophysics, Vol. 31, No. 2, 1966, pp. 362-371. [22] M. F. Kane, “A Comprehensive System of Terrain Cor rections Using a Digital Computer,” Geophysics, Vol. 27, No. 4, 1962, pp. 455-462. doi:10.1190/1.1439044 [23] J. G. Fitton, “The Cameroon Line, West Africa: A Com- Parison between Oceanic and Continental Alkaline Vol- Canism. Alkali Igneous Rocks,” Geological Society, Vol. 30, 1987, pp. 273-291. [24] D. C. Lee, A. N. Halliday, J. G. Fitton and G. Poli, “Iso- topic Variations with Distance and Time in the Volcanic Islands of the Cameroon Line: Evidence for a Mantle Plume Origin,” Earth and Planetary Science Letters, Vol. 123, No. 1-3, 1994, pp. 119-138. [25] Y. H. Poudjom Djomani, M. Diament and M. Wilson, “Lithospheric Structure across the Adamawa Plateau (Cameroon) from Gravity Studies,” Tectonophysics, Vol. 273, No. 3-4, 1997, pp. 317-327. doi:10.1016/S0040-1951(96)00280-6 [26] C. Dorbath, L. Dorbath, J. D. Fairhead and G. W. Stuart, “A Teleseismic Delay Time Study across the Central Af- rican Shear Zone In Adamawa Region of Cameroon West Africa,” Geophysical Journal of the Royal Astronomical Society, Vol. 86, No. 3, 1986, pp.751-766. [27] J. Plomerova, V. Babuska, C. Dorbath, L. Dorbath and R. J. Lillie, “Deep Lithospheric Structure across the Central African Shear Zone in Cameroon,” Geophysical Journal International, Vol. 115, No. 2, 1993, pp. 381-390. [28] K. Burke, “Origin of the Cameroon Line of Volcano- - Capped Swells,” The Journal of Geology, Vol. 109, No. 3, 2001, pp. 349-362. doi:10.1086/319977 [29] G. R. Foulger, “Plates vs. Plumes: A Geological Contro- versy,” Wiley-Blackwell, Chichester, 2010. doi:10.1002/9781444324860 [30] E. Njonfang, A. Nono, P. Kamgang, V. Ngako and F. Tchoua Mbatcam, “The Cameroon Line Magmatism (Central Africa): A Viewpoint,” International Geological Congress, Oslo, 2008. [31] C. Noutchogwe, C. Tabod and E. Manguelle-Dicoum, “A Gravity Study of the Crust beneath the Adamawa Fault Zone, West Central Africa,” Journal of Geophysics and Engineering, Vol. 3, No. 1, 2006, pp. 82-89. doi:10.1088/1742-2132/3/1/009 [32] K. Rankenburg, J. C. Lassiter and G. Brey, “The Role of Continental Crust and Lithospheric Mantle in the Genesis of Cameroon Volcanic Line Lavas: Constraints from Iso- topic Variations in Lavas and Megacrysts from the Biu and Jos Plateaux,” Journal of Petrology, Vol. 46, No. 1, 2004, pp. 169-190.
|