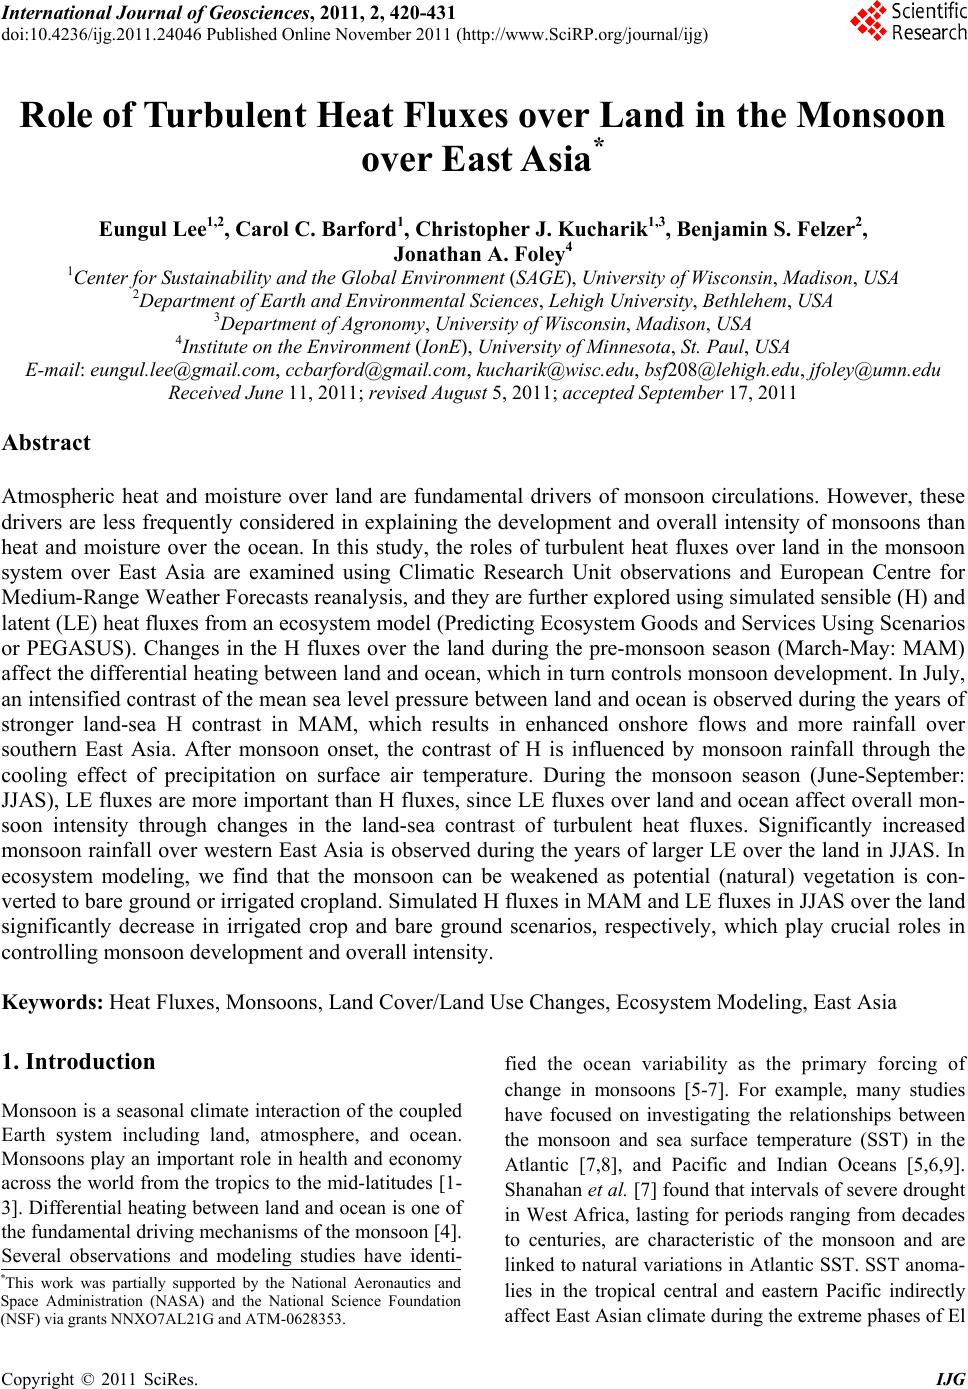
 International Journal of Geosciences, 2011, 2, 420-431 doi:10.4236/ijg.2011.24046 Published Online November 2011 (http://www.SciRP.org/journal/ijg) Copyright © 2011 SciRes. IJG Role of Turbulent Heat Fluxes over Land in the Monsoon over East Asia* Eungul Lee1,2, Carol C. Barford1, Christopher J. Kucharik1,3, Benjamin S. Felzer2, Jonathan A. Foley4 1Center for Sustainability an d the Globa l Environment (SAGE), University of Wisconsin, Madison, USA 2Departme n t of Earth and E nvironmental Sciences, Lehigh University, Bethlehem, USA 3Department of Agro no my , University of Wisconsin, Madison, USA 4Institute on the Environment (IonE ), University of Minnesota, St. Paul, USA E-mail: eungul.lee@gmail.com, ccbarford@gmail.com, kucharik@wisc.edu, bsf208@lehigh.edu, jfoley@umn.edu Received June 11, 2011; revised August 5, 2011; accepted September 17, 2011 Abstract Atmospheric heat and moisture over land are fundamental drivers of monsoon circulations. However, these drivers are less frequently considered in explaining the development and overall intensity of monsoons than heat and moisture over the ocean. In this study, the roles of turbulent heat fluxes over land in the monsoon system over East Asia are examined using Climatic Research Unit observations and European Centre for Medium-Range Weather Forecasts reanalysis, and they are further explored using simulated sensible (H) and latent (LE) heat fluxes from an ecosystem model (Predicting Ecosystem Goods and Services Using Scenarios or PEGASUS). Changes in the H fluxes over the land during the pre-monsoon season (March-May: MAM) affect the differential heating between land and ocean, which in turn controls monsoon development. In July, an intensified contrast of the mean sea level pressure between land and ocean is observed during the years of stronger land-sea H contrast in MAM, which results in enhanced onshore flows and more rainfall over southern East Asia. After monsoon onset, the contrast of H is influenced by monsoon rainfall through the cooling effect of precipitation on surface air temperature. During the monsoon season (June-September: JJAS), LE fluxes are more important than H fluxes, since LE fluxes over land and ocean affect overall mon- soon intensity through changes in the land-sea contrast of turbulent heat fluxes. Significantly increased monsoon rainfall over western East Asia is observed during the years of larger LE over the land in JJAS. In ecosystem modeling, we find that the monsoon can be weakened as potential (natural) vegetation is con- verted to bare ground or irrigated cropland. Simulated H fluxes in MAM and LE fluxes in JJAS over the land significantly decrease in irrigated crop and bare ground scenarios, respectively, which play crucial roles in controlling monsoon development and overall intensity. Keywords: Heat Fluxes, Monsoons, Land Cover/Land Use Changes, Ecosystem Modeling, East Asia 1. Introduction Monsoon is a seasonal climate interaction of the coupled Earth system including land, atmosphere, and ocean. Monsoons play an important role in health and economy across the world from the tropics to the mid-latitudes [1- 3]. Differential heating between land and ocean is one of the fundamental driving mechanisms of the monsoon [4]. Several observations and modeling studies have identi- fied the ocean variability as the primary forcing of change in monsoons [5-7]. For example, many studies have focused on investigating the relationships between the monsoon and sea surface temperature (SST) in the Atlantic [7,8], and Pacific and Indian Oceans [5,6,9]. Shanahan et al. [7] found that intervals of severe drought in West Africa, lasting for periods ranging from decades to centuries, are characteristic of the monsoon and are linked to natural variations in Atlantic SST. SST anoma- lies in the tropical central and eastern Pacific indirectly affect East Asian climate during the extreme phases of El *This work was partially supported by the National Aeronautics and Space Administration (NASA) and the National Science Foundation (NSF) via grants NNXO7AL21G and ATM-0628353. 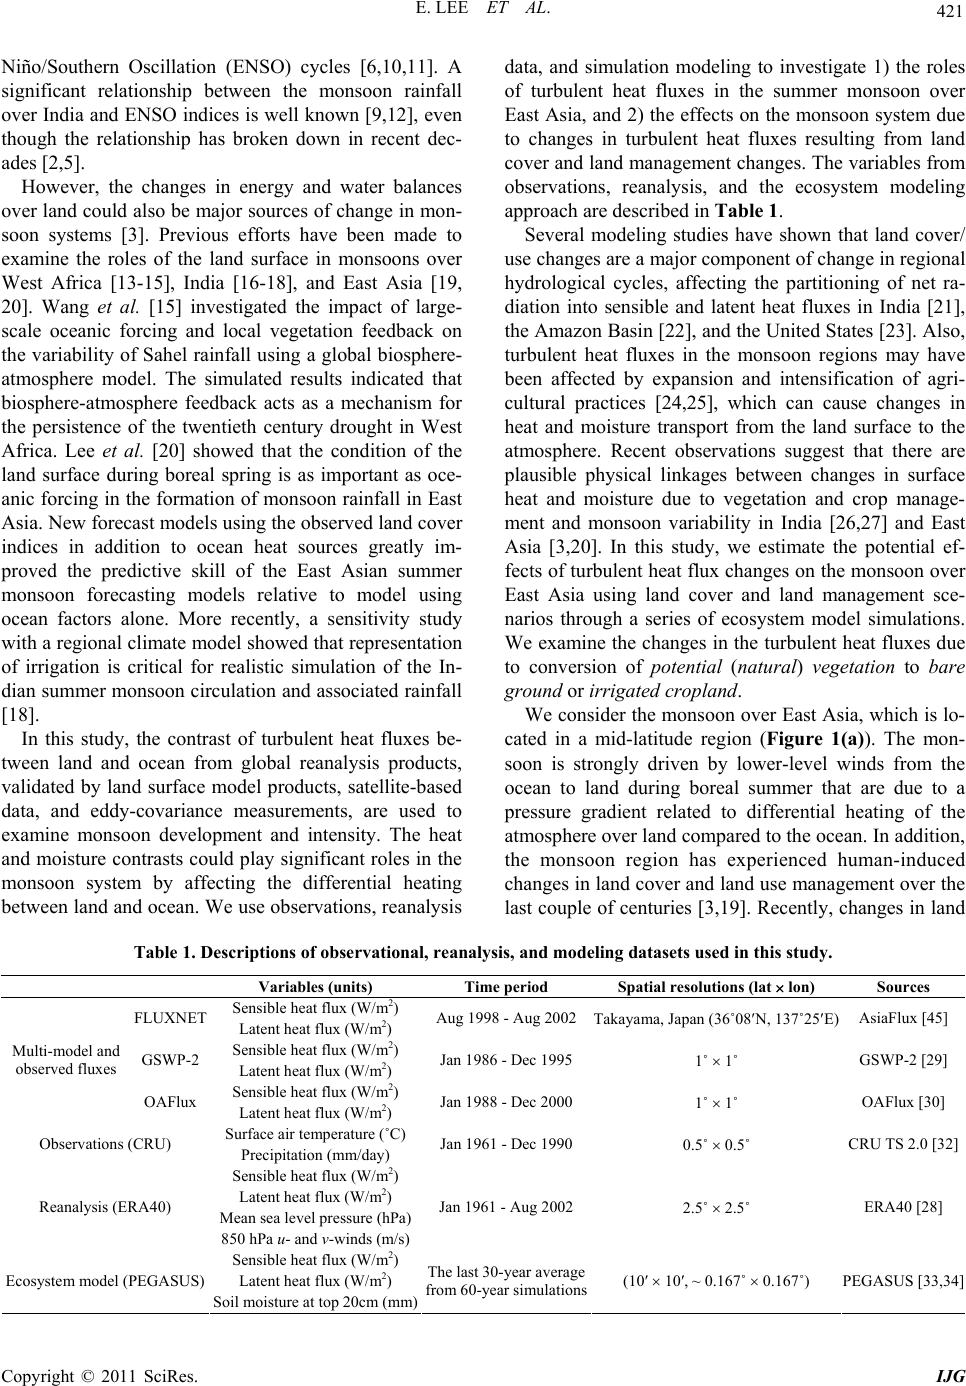 421 E. LEE ET AL. Niño/Southern Oscillation (ENSO) cycles [6,10,11]. A significant relationship between the monsoon rainfall over India and ENSO indices is well known [9,12], even though the relationship has broken down in recent dec- ades [2,5]. However, the changes in energy and water balances over land could also be major sources of change in mon- soon systems [3]. Previous efforts have been made to examine the roles of the land surface in monsoons over West Africa [13-15], India [16-18], and East Asia [19, 20]. Wang et al. [15] investigated the impact of large- scale oceanic forcing and local vegetation feedback on the variability of Sahel rainfall using a global biosphere- atmosphere model. The simulated results indicated that biosphere-atmosphere feedback acts as a mechanism for the persistence of the twentieth century drought in West Africa. Lee et al. [20] showed that the condition of the land surface during boreal spring is as important as oce- anic forcing in the formation of monsoon rainfall in East Asia. New forecast models using the observed land cover indices in addition to ocean heat sources greatly im- proved the predictive skill of the East Asian summer monsoon forecasting models relative to model using ocean factors alone. More recently, a sensitivity study with a regional climate model showed that representation of irrigation is critical for realistic simulation of the In- dian summer monsoon circulation and associated rainfall [18]. In this study, the contrast of turbulent heat fluxes be- tween land and ocean from global reanalysis products, validated by land surface model products, satellite-based data, and eddy-covariance measurements, are used to examine monsoon development and intensity. The heat and moisture contrasts could play significant roles in the monsoon system by affecting the differential heating between land and ocean. We use observations, reanalysis data, and simulation modeling to investigate 1) the roles of turbulent heat fluxes in the summer monsoon over East Asia, and 2) the effects on the monsoon system due to changes in turbulent heat fluxes resulting from land cover and land management changes. The variables from observations, reanalysis, and the ecosystem modeling approach are described in Table 1. Several modeling studies have shown that land cover/ use changes are a major component of change in regional hydrological cycles, affecting the partitioning of net ra- diation into sensible and latent heat fluxes in India [21], the Amazon Basin [22], and the United States [23]. Also, turbulent heat fluxes in the monsoon regions may have been affected by expansion and intensification of agri- cultural practices [24,25], which can cause changes in heat and moisture transport from the land surface to the atmosphere. Recent observations suggest that there are plausible physical linkages between changes in surface heat and moisture due to vegetation and crop manage- ment and monsoon variability in India [26,27] and East Asia [3,20]. In this study, we estimate the potential ef- fects of turbulent heat flux changes on the monsoon over East Asia using land cover and land management sce- narios through a series of ecosystem model simulations. We examine the changes in the turbulent heat fluxes due to conversion of potential (natural) vegetation to bare ground or irrigated crop land. We consider the monsoon over East Asia, which is lo- cated in a mid-latitude region (Figure 1(a)). The mon- soon is strongly driven by lower-level winds from the ocean to land during boreal summer that are due to a pressure gradient related to differential heating of the atmosphere over land compared to the ocean. In addition, the monsoon region has experienced human-induced changes in land cover and land use management over the last couple of centuries [3,19]. Recently, changes in land Table 1. Descriptions of observational, reanalysi s, and modeling datasets used in this study. Variables (units) Time period Spatial resolutions (lat lon) Sources Sensible heat flux (W/m2) FLUXNET Latent heat flux (W/m2) Aug 1998 - Aug 2002Takayama, Japan (36˚08N, 137˚25E) AsiaFlux [45] Sensible heat flux (W/m2) GSWP-2 Latent heat flux (W/m2) Jan 1986 - Dec 1995 1˚ 1˚ GSWP-2 [29] Sensible heat flux (W/m2) Multi-model and observed fluxes OAFlux Latent heat flux (W/m2) Jan 1988 - Dec 2000 1˚ 1˚ OAFlux [30] Surface air temperature (˚C) Observations (CRU) Precipitation (mm/day) Jan 1961 - Dec 1990 0.5˚ 0.5˚ CRU TS 2.0 [32] Sensible heat flux (W/m2) Latent heat flux (W/m2) Mean sea level pressure (hPa) Reanalysis (ERA40) 850 hPa u- and v-winds (m/s) Jan 1961 - Aug 2002 2.5˚ 2.5˚ ERA40 [28] Sensible heat flux (W/m2) Latent heat flux (W/m2) Ecosystem model (PEGASUS) Soil moisture at top 20cm (mm) The last 30-year average from 60-year simulations(10′ 10′, ~ 0.167˚ 0.167˚) PEGASUS [33,34] Copyright © 2011 SciRes. IJG 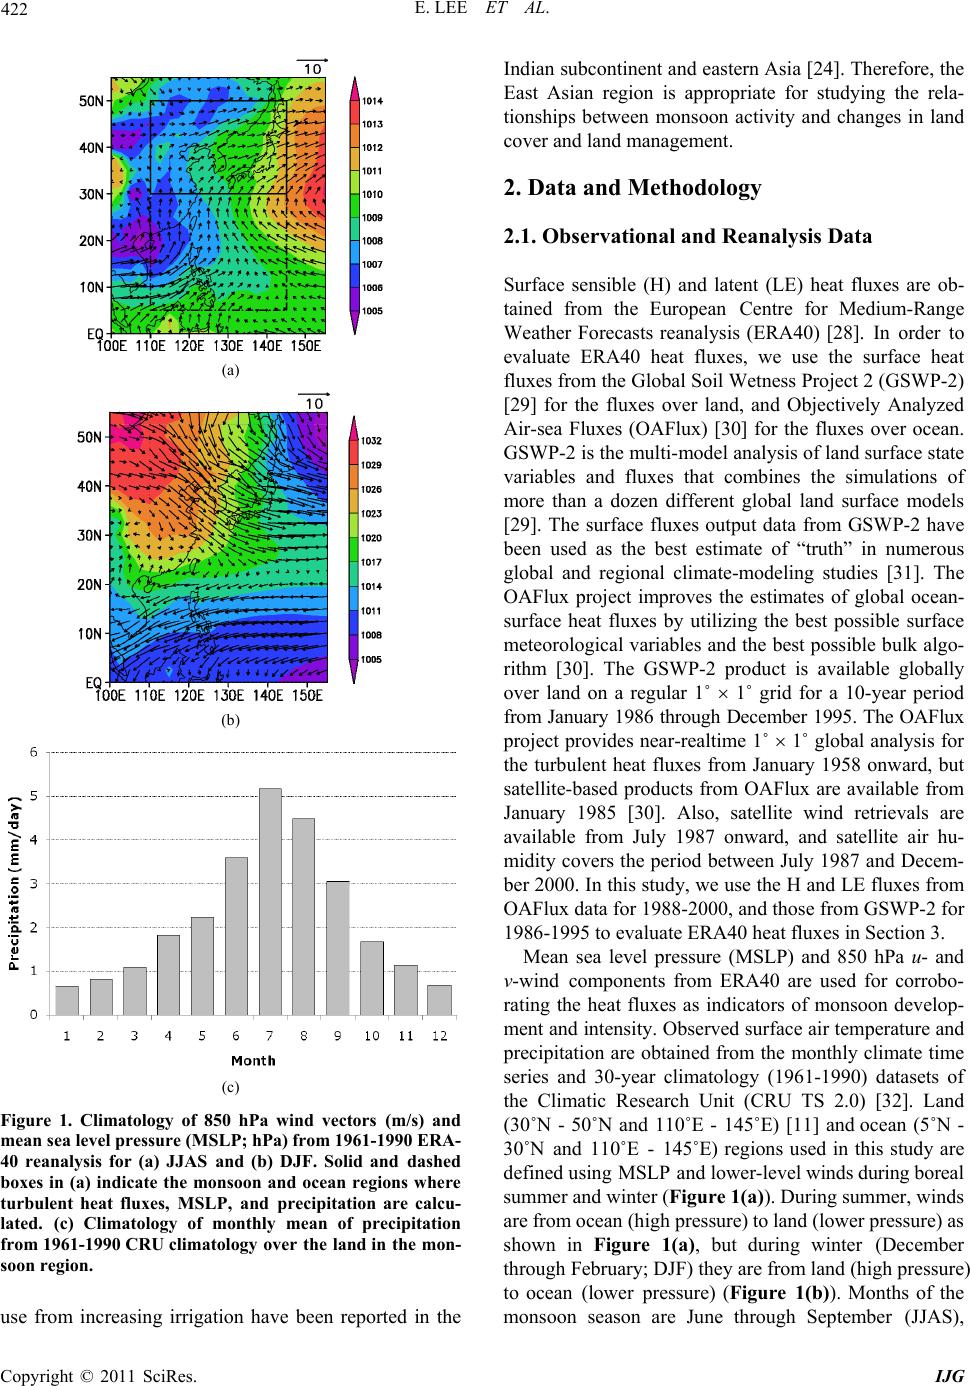 E. LEE ET AL. 422 (a) (b) (c) Figure 1. Climatology of 850 hPa wind vectors (m/s) and mean sea level pressure (MSLP; hPa) from 1961-1990 ERA- 40 reanalysis for (a) JJAS and (b) DJF. Solid and dashed boxes in (a) indicate the monsoon and ocean regions where turbulent heat fluxes, MSLP, and precipitation are calcu- lated. (c) Climatology of monthly mean of precipitation from 1961-1990 CRU climatology over the land in the mon- soon region. use from increasing irrigation have been reported in the Indian subcontinent and eastern Asia [24]. Therefore, the East Asian region is appropriate for studying the rela- tionships between monsoon activity and changes in land cover and land management. 2. Data and Methodology 2.1. Observational and Reanalysis Data Surface sensible (H) and latent (LE) heat fluxes are ob- tained from the European Centre for Medium-Range Weather Forecasts reanalysis (ERA40) [28]. In order to evaluate ERA40 heat fluxes, we use the surface heat fluxes from the Global Soil Wetness Project 2 (GSWP-2) [29] for the fluxes over land, and Objectively Analyzed Air-sea Fluxes (OAFlux) [30] for the fluxes over ocean. GSWP-2 is the multi-model analysis of land surface state variables and fluxes that combines the simulations of more than a dozen different global land surface models [29]. The surface fluxes output data from GSWP-2 have been used as the best estimate of “truth” in numerous global and regional climate-modeling studies [31]. The OAFlux project improves the estimates of global ocean- surface heat fluxes by utilizing the best possible surface meteorological variables and the best possible bulk algo- rithm [30]. The GSWP-2 product is available globally over land on a regular 1˚ 1˚ grid for a 10-year period from January 1986 through December 1995. The OAFlux project provides near-realtime 1˚ 1˚ global analysis for the turbulent heat fluxes from January 1958 onward, but satellite-based products from OAFlux are available from January 1985 [30]. Also, satellite wind retrievals are available from July 1987 onward, and satellite air hu- midity covers the period between July 1987 and Decem- ber 2000. In this study, we use the H and LE fluxes from OAFlux data for 1988-2000, and those from GSWP-2 for 1986-1995 to evaluate ERA40 heat fluxes in Section 3. Mean sea level pressure (MSLP) and 850 hPa u- and v-wind components from ERA40 are used for corrobo- rating the heat fluxes as indicators of monsoon develop- ment and intensity. Observed surface air temperature and precipitation are obtained from the monthly climate time series and 30-year climatology (1961-1990) datasets of the Climatic Research Unit (CRU TS 2.0) [32]. Land (30˚N - 50˚N and 110˚E - 145˚E) [11] and ocean (5˚N - 30˚N and 110˚E - 145˚E) regions used in this study are defined using MSLP and lower-level winds during boreal summer and winter (Figure 1(a)). During summer, winds are from ocean (high pressure) to land (lower pressure) as shown in Figure 1(a), but during winter (December through February; DJF) they are from land (high pressure) to ocean (lower pressure) (Figure 1(b)). Months of the monsoon season are June through September (JJAS), Copyright © 2011 SciRes. IJG 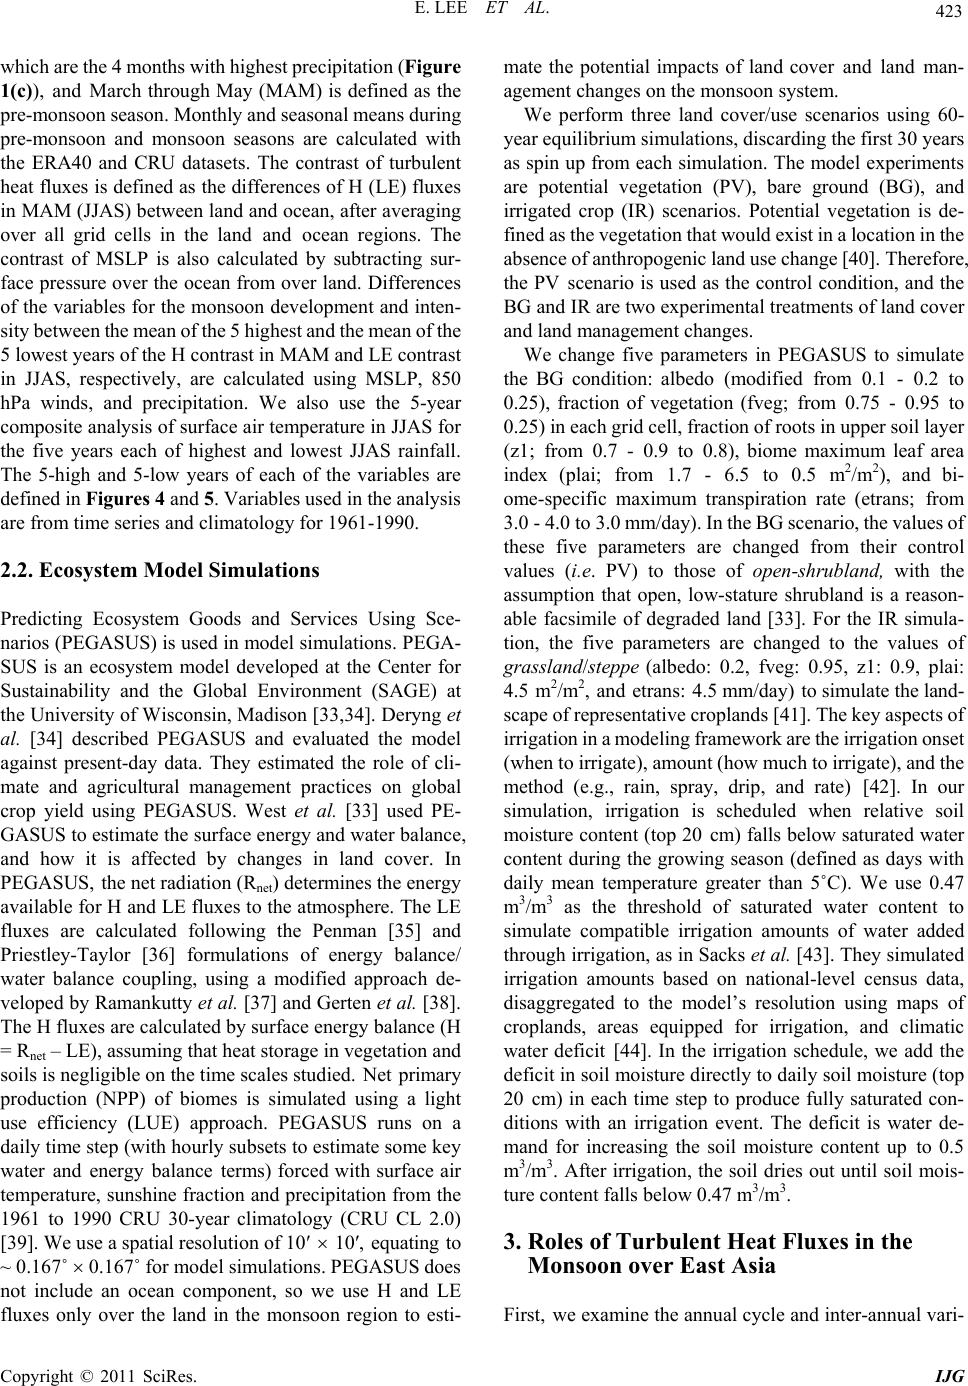 423 E. LEE ET AL. which are the 4 months with highest precipitation (Figure 1(c)), and March through May (MAM) is defined as the pre-monsoon season. Monthly and seasonal means during pre-monsoon and monsoon seasons are calculated with the ERA40 and CRU datasets. The contrast of turbulent heat fluxes is defined as the differences of H (LE) fluxes in MAM (JJAS) between land and ocean, after averaging over all grid cells in the land and ocean regions. The contrast of MSLP is also calculated by subtracting sur- face pressure over the ocean from over land. Differences of the variables for the monsoon development and inten- sity between the mean of the 5 highest and the mean of the 5 lowest years of the H contrast in MAM and LE contrast in JJAS, respectively, are calculated using MSLP, 850 hPa winds, and precipitation. We also use the 5-year composite analysis of surface air temperature in JJAS for the five years each of highest and lowest JJAS rainfall. The 5-high and 5-low years of each of the variables are defined in Figures 4 and 5. Variables used in the analysis are from time series and climatology for 1961-1990. 2.2. Ecosystem Model Simulations Predicting Ecosystem Goods and Services Using Sce- narios (PEGASUS) is used in model simulations. PEGA- SUS is an ecosystem model developed at the Center for Sustainability and the Global Environment (SAGE) at the University of Wisconsin, Madison [33,34]. Deryng et al. [34] described PEGASUS and evaluated the model against present-day data. They estimated the role of cli- mate and agricultural management practices on global crop yield using PEGASUS. West et al. [33] used PE- GASUS to estimate the surface energy and water balance, and how it is affected by changes in land cover. In PEGASUS, the net radiation (Rnet) determines the energy available for H and LE fluxes to the atmosphere. The LE fluxes are calculated following the Penman [35] and Priestley-Taylor [36] formulations of energy balance/ water balance coupling, using a modified approach de- veloped by Ramankutty et al. [37] and Gerten et al. [38]. The H fluxes are calculated by surface energy balance (H = Rnet – LE), assuming that heat storage in vegetation and soils is negligible on the time scales studied. Net primary production (NPP) of biomes is simulated using a light use efficiency (LUE) approach. PEGASUS runs on a daily time step (with hourly subsets to estimate some key water and energy balance terms) forced with surface air temperature, sunshine fraction and precipitation from the 1961 to 1990 CRU 30-year climatology (CRU CL 2.0) [39]. We use a spatial resolution of 10′ 10′, equating to ~ 0.167˚ 0.167˚ for model simulations. PEGASUS does not include an ocean component, so we use H and LE fluxes only over the land in the monsoon region to esti- mate the potential impacts of land cover and land man- agement changes on the monsoon system. We perform three land cover/use scenarios using 60- year equilibrium simulations, discarding the first 30 years as spin up from each simulation. The model experiments are potential vegetation (PV), bare ground (BG), and irrigated crop (IR) scenarios. Potential vegetation is de- fined as the vegetation that would exist in a location in the absence of anthropogenic land use change [40]. Therefore, the PV scenario is used as the control condition, and the BG and IR are two experimental treatments of land cover and land management changes. We change five parameters in PEGASUS to simulate the BG condition: albedo (modified from 0.1 - 0.2 to 0.25), fraction of vegetation (fveg; from 0.75 - 0.95 to 0.25) in each grid cell, fraction of roots in upper soil layer (z1; from 0.7 - 0.9 to 0.8), biome maximum leaf area index (plai; from 1.7 - 6.5 to 0.5 m2/m2), and bi- ome-specific maximum transpiration rate (etrans; from 3.0 - 4.0 to 3.0 mm/day). In the BG scenario, the values of these five parameters are changed from their control values (i.e. PV) to those of open-shrubland, with the assumption that open, low-stature shrubland is a reason- able facsimile of degraded land [33]. For the IR simula- tion, the five parameters are changed to the values of grassland/steppe (albedo: 0.2, fveg: 0.95, z1: 0.9, plai: 4.5 m2/m2, and etrans: 4.5 mm/day) to simulate the land- scape of representative croplands [41]. The key aspects of irrigation in a modeling framework are the irrigation onset (when to irrigate), amount (how much to irrigate), and the method (e.g., rain, spray, drip, and rate) [42]. In our simulation, irrigation is scheduled when relative soil moisture content (top 20 cm) falls below saturated water content during the growing season (defined as days with daily mean temperature greater than 5˚C). We use 0.47 m3/m3 as the threshold of saturated water content to simulate compatible irrigation amounts of water added through irrigation, as in Sacks et al. [43]. They simulated irrigation amounts based on national-level census data, disaggregated to the model’s resolution using maps of croplands, areas equipped for irrigation, and climatic water deficit [44]. In the irrigation schedule, we add the deficit in soil moisture directly to daily soil moisture (top 20 cm) in each time step to produce fully saturated con- ditions with an irrigation event. The deficit is water de- mand for increasing the soil moisture content up to 0.5 m3/m3. After irrigation, the soil dries out until soil mois- ture content falls below 0.47 m3/m3. 3. Roles of Turbulent Heat Fluxes in the Monsoon over East Asia First, we examine the annual cycle and inter-annual vari- Copyright © 2011 SciRes. IJG 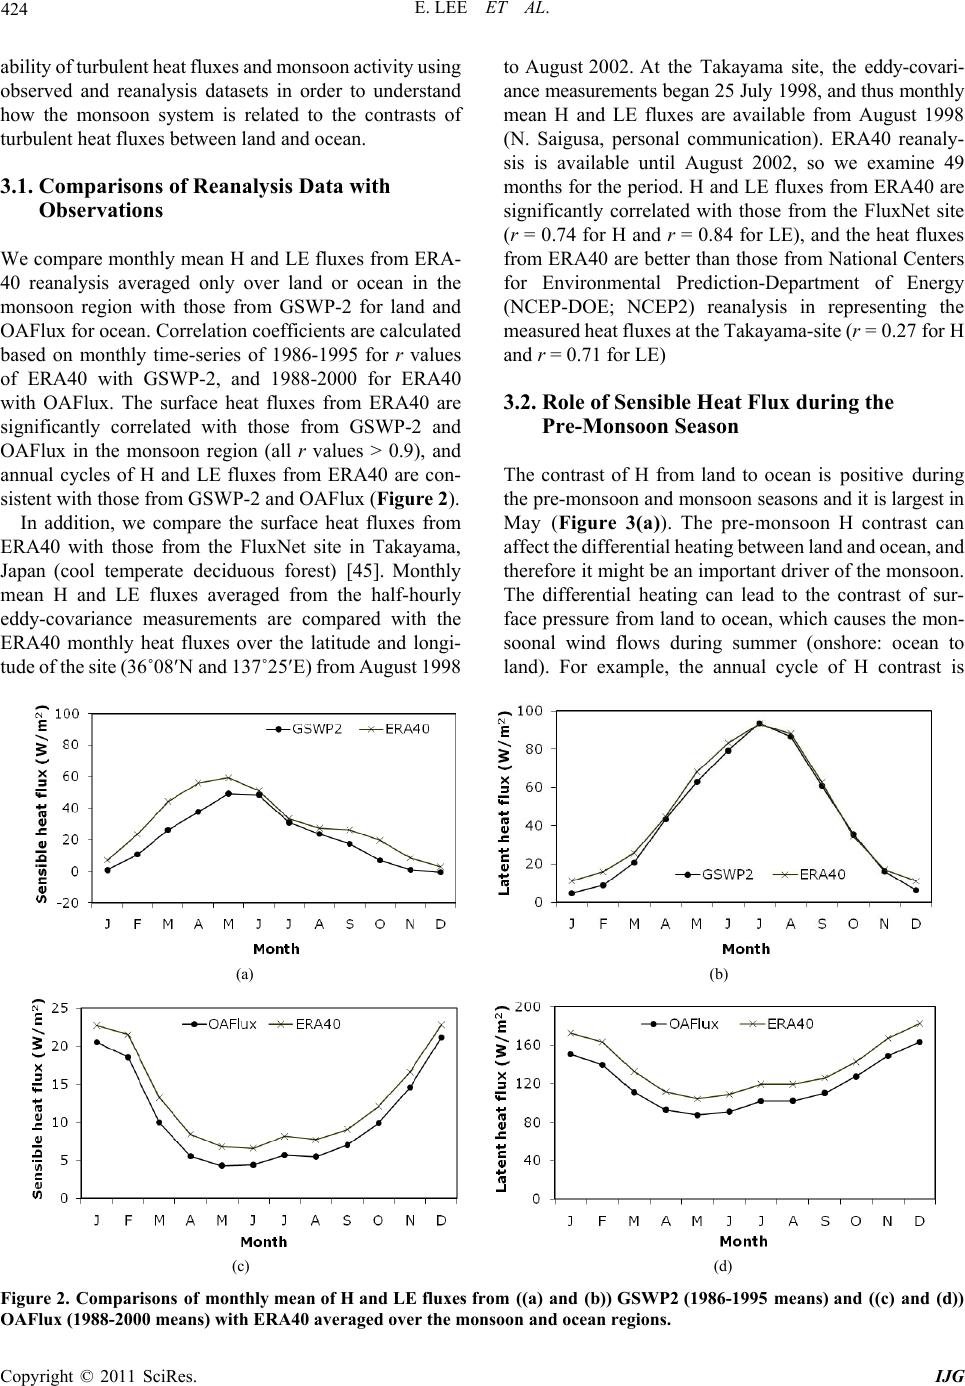 E. LEE ET AL. Copyright © 2011 SciRes. IJG 424 ability of turbulent heat fluxes and monsoon activity using observed and reanalysis datasets in order to understand how the monsoon system is related to the contrasts of turbulent heat fluxes between land and ocean. 3.1. Comparisons of Reanalysis Data with Observations We compare monthly mean H and LE fluxes from ERA- 40 reanalysis averaged only over land or ocean in the monsoon region with those from GSWP-2 for land and OAFlux for ocean. Correlation coefficients are calculated based on monthly time-series of 1986-1995 for r values of ERA40 with GSWP-2, and 1988-2000 for ERA40 with OAFlux. The surface heat fluxes from ERA40 are significantly correlated with those from GSWP-2 and OAFlux in the monsoon region (all r values > 0.9), and annual cycles of H and LE fluxes from ERA40 are con- sistent with those from GSWP-2 and OAFlux (Figure 2). In addition, we compare the surface heat fluxes from ERA40 with those from the FluxNet site in Takayama, Japan (cool temperate deciduous forest) [45]. Monthly mean H and LE fluxes averaged from the half-hourly eddy-covariance measurements are compared with the ERA40 monthly heat fluxes over the latitude and longi- tude of the site (36˚08N and 137˚25E) from August 1998 to August 2002. At the Takayama site, the eddy-covari- ance measurements began 25 July 1998, and thus monthly mean H and LE fluxes are available from August 1998 (N. Saigusa, personal communication). ERA40 reanaly- sis is available until August 2002, so we examine 49 months for the period. H and LE fluxes from ERA40 are significantly correlated with those from the FluxNet site (r = 0.74 for H and r = 0.84 for LE), and the heat fluxes from ERA40 are better than those from National Centers for Environmental Prediction-Department of Energy (NCEP-DOE; NCEP2) reanalysis in representing the measured heat fluxes at the Takayama-site (r = 0.27 for H and r = 0.71 for LE) 3.2. Role of Sensible Heat Flux during the Pre-Monsoon Season The contrast of H from land to ocean is positive during the pre-monsoon and monsoon seasons and it is largest in May (Figure 3(a)). The pre-monsoon H contrast can affect the differential heating between land and ocean, and therefore it might be an important driver of the monsoon. The differential heating can lead to the contrast of sur- face pressure from land to ocean, which causes the mon- soonal wind flows during summer (onshore: ocean to land). For example, the annual cycle of H contrast is (a) (b) (c) (d) Figure 2. Comparisons of monthly mean of H and LE fluxes from ((a) and (b)) GSWP2 (1986-1995 means) and ((c) and (d)) OAFlux (1988-2000 means) with ERA40 averaged over the monsoon and ocean regions. 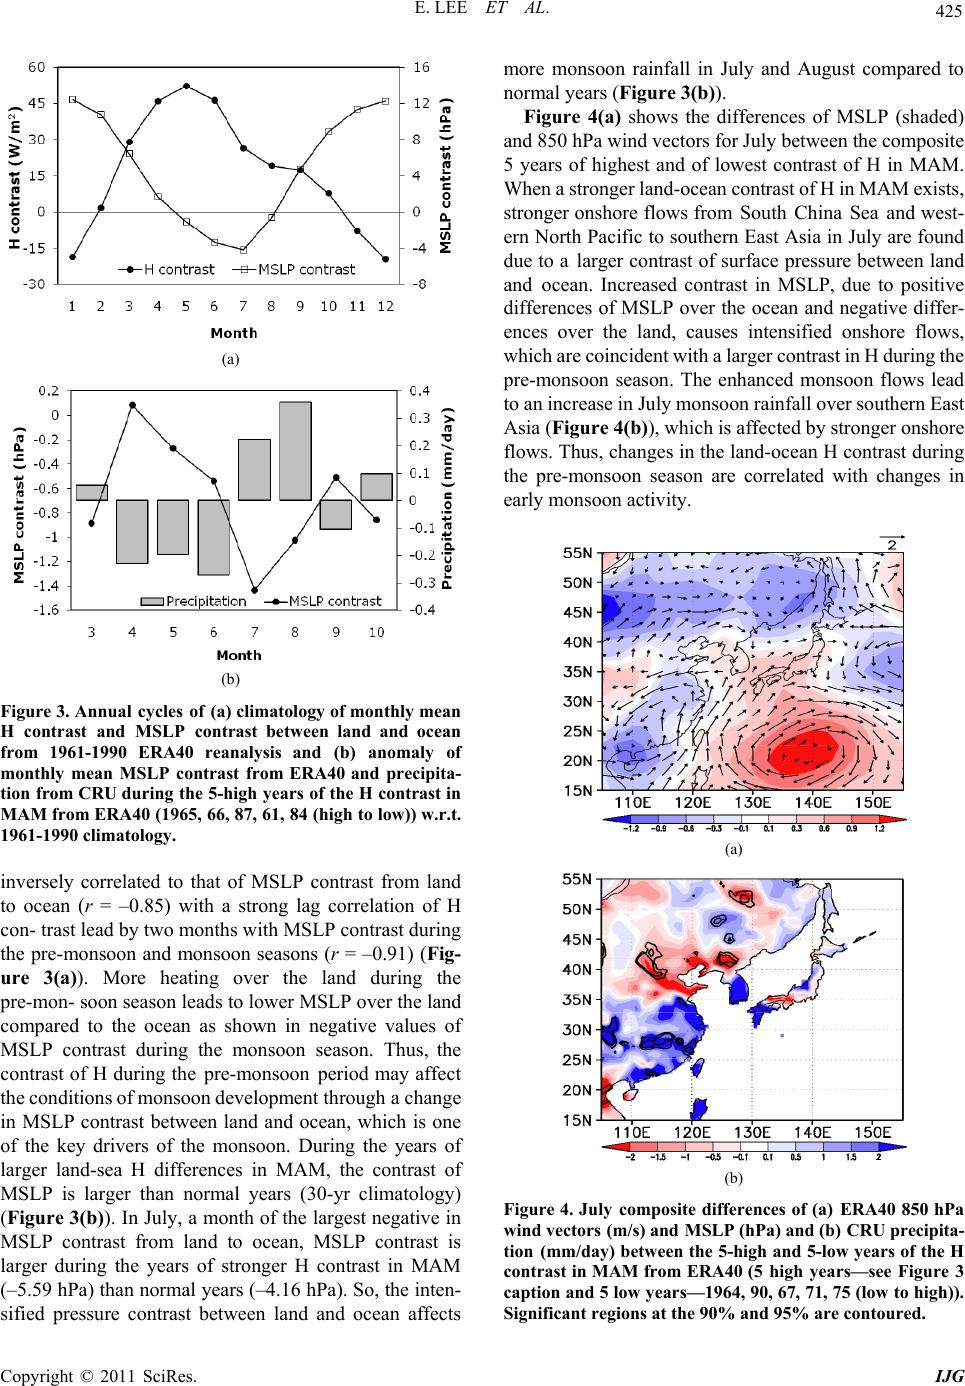 425 E. LEE ET AL. (a) (b) Figure 3. Annual cycles of (a) climatology of monthly mean H contrast and MSLP contrast between land and ocean from 1961-1990 ERA40 reanalysis and (b) anomaly of monthly mean MSLP contrast from ERA40 and precipita- tion from CRU during the 5-high years of the H contrast in MAM from ERA40 (1965, 66, 87, 61, 84 (high to low)) w.r.t. 1961-1990 climatology. inversely correlated to that of MSLP contrast from land to ocean (r = –0.85) with a strong lag correlation of H con- trast lead by two months with MSLP contrast during the pre-monsoon and monsoon seasons (r = –0.91) (Fig- ure 3(a)). More heating over the land during the pre-mon- soon season leads to lower MSLP over the land compared to the ocean as shown in negative values of MSLP contrast during the monsoon season. Thus, the contrast of H during the pre-monsoon period may affect the conditions of monsoon development through a change in MSLP contrast between land and ocean, which is one of the key drivers of the monsoon. During the years of larger land-sea H differences in MAM, the contrast of MSLP is larger than normal years (30-yr climatology) (Figure 3(b)). In July, a month of the largest negative in MSLP contrast from land to ocean, MSLP contrast is larger during the years of stronger H contrast in MAM (–5.59 hPa) than normal years (–4.16 hPa). So, the inten- sified pressure contrast between land and ocean affects more monsoon rainfall in July and August compared to normal years (Figure 3( b) ). Figure 4(a) shows the differences of MSLP (shaded) and 850 hPa wind vectors for July between the composite 5 years of highest and of lowest contrast of H in MAM. When a stronger land-ocean contrast of H in MAM exists, stronger onshore flows from South China Sea and west- ern North Pacific to southern East Asia in July are found due to a larger contrast of surface pressure between land and ocean. Increased contrast in MSLP, due to positive differences of MSLP over the ocean and negative differ- ences over the land, causes intensified onshore flows, which are coincident with a larger contrast in H during the pre-monsoon season. The enhanced monsoon flows lead to an increase in July monsoon rainfall over southern East Asia (Figure 4(b)), which is affected by stronger onshore flows. Thus, changes in the land-ocean H contrast during the pre-monsoon season are correlated with changes in early monsoon activity. (a) (b) Figure 4. July composite differences of (a) ERA40 850 hPa wind vectors (m/s) and MSLP (hPa) and (b) CRU precipita- tion (mm/day) between the 5-high and 5-low years of the H contrast in MAM from ERA40 (5 high years—see Figure 3 caption and 5 low years—1964, 90, 67, 71, 75 (low to high)). Significant regions at the 90% and 95% are contoured. Copyright © 2011 SciRes. IJG 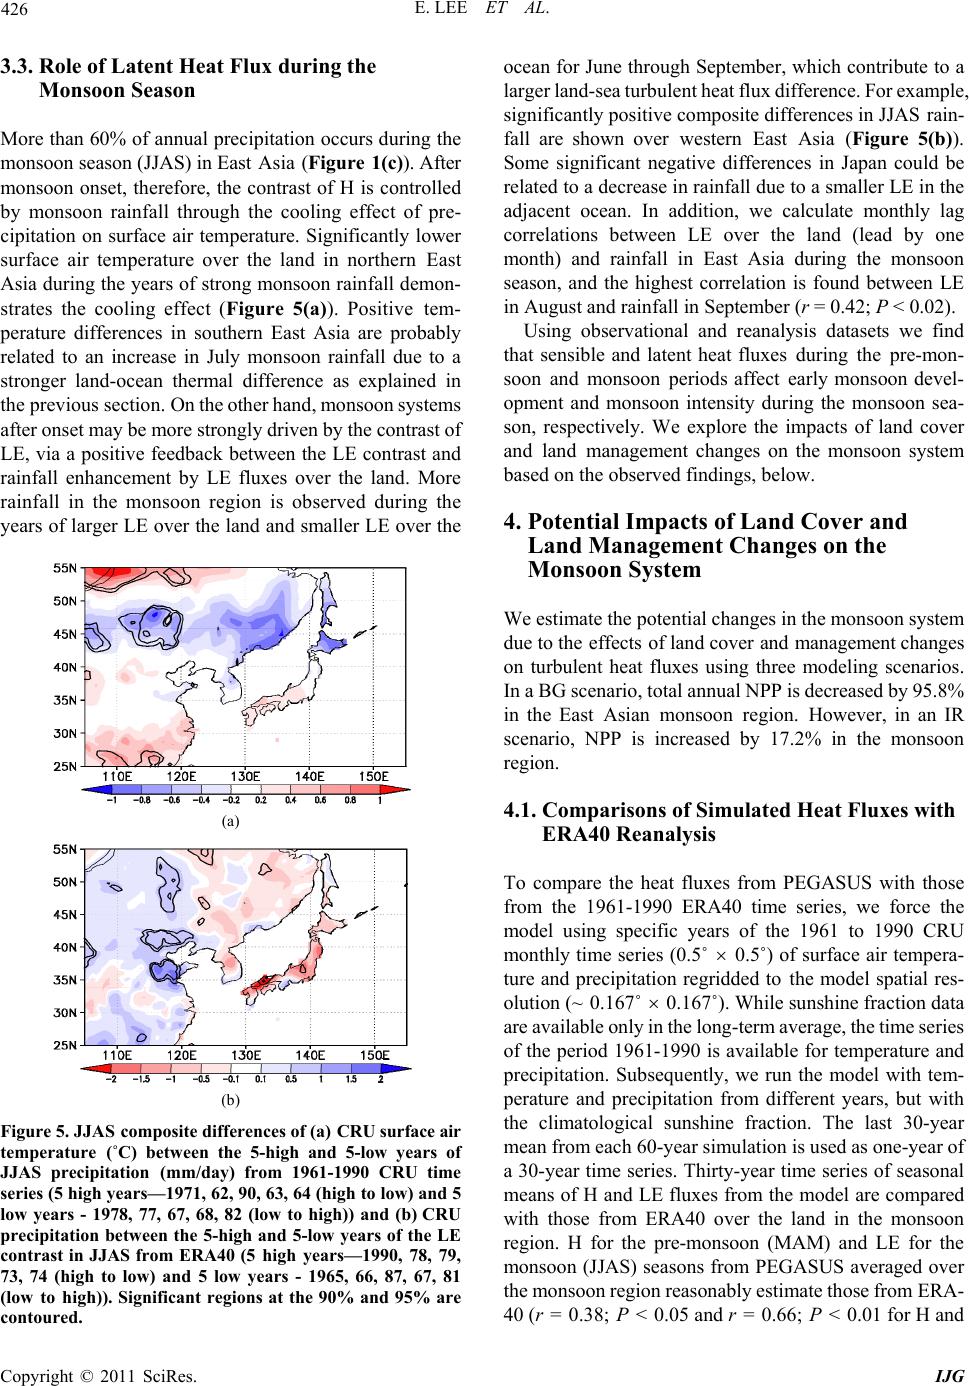 E. LEE ET AL. 426 3.3. Role of Latent Heat Flux during the Monsoon Season More than 60% of annual precipitation occurs during the monsoon season (JJAS) in East Asia (Figure 1(c)). After monsoon onset, therefore, the contrast of H is controlled by monsoon rainfall through the cooling effect of pre- cipitation on surface air temperature. Significantly lower surface air temperature over the land in northern East Asia during the years of strong monsoon rainfall demon- strates the cooling effect (Figure 5(a)). Positive tem- perature differences in southern East Asia are probably related to an increase in July monsoon rainfall due to a stronger land-ocean thermal difference as explained in the previous section. On the other hand, monsoon systems after onset may be more strongly driven by the contrast of LE, via a positive feedback between the LE contrast and rainfall enhancement by LE fluxes over the land. More rainfall in the monsoon region is observed during the years of larger LE over the land and smaller LE over the (a) (b) Figure 5. JJAS composite differences of (a) CRU surface air temperature (˚C) between the 5-high and 5-low years of JJAS precipitation (mm/day) from 1961-1990 CRU time series (5 high years—1971, 62, 90, 63, 64 (high to low) and 5 low years - 1978, 77, 67, 68, 82 (low to high)) and (b) CRU precipitation between the 5-high and 5-low years of the LE contrast in JJAS from ERA40 (5 high years—1990, 78, 79, 73, 74 (high to low) and 5 low years - 1965, 66, 87, 67, 81 (low to high)). Significant regions at the 90% and 95% are contoured. ocean for June through September, which contribute to a larger land-sea turbulent heat flux difference. For example, significantly positive composite differences in JJAS rain- fall are shown over western East Asia (Figure 5(b)). Some significant negative differences in Japan could be related to a decrease in rainfall due to a smaller LE in the adjacent ocean. In addition, we calculate monthly lag correlations between LE over the land (lead by one month) and rainfall in East Asia during the monsoon season, and the highest correlation is found between LE in August and rainfall in September (r = 0.42; P < 0.02). Using observational and reanalysis datasets we find that sensible and latent heat fluxes during the pre-mon- soon and monsoon periods affect early monsoon devel- opment and monsoon intensity during the monsoon sea- son, respectively. We explore the impacts of land cover and land management changes on the monsoon system based on the observed findings, below. 4. Potential Impacts of Land Cover and Land Management Changes on the Monsoon System We estimate the potential changes in the monsoon system due to the effects of land cover and management changes on turbulent heat fluxes using three modeling scenarios. In a BG scenario, total annual NPP is decreased by 95.8% in the East Asian monsoon region. However, in an IR scenario, NPP is increased by 17.2% in the monsoon region. 4.1. Comparisons of Simulated Heat Fluxes with ERA40 Reanalysis To compare the heat fluxes from PEGASUS with those from the 1961-1990 ERA40 time series, we force the model using specific years of the 1961 to 1990 CRU monthly time series (0.5˚ 0.5˚) of surface air tempera- ture and precipitation regridded to the model spatial res- olution (~ 0.167˚ 0.167˚). While sunshine fraction data are available only in the long-term average, the time series of the period 1961-1990 is available for temperature and precipitation. Subsequently, we run the model with tem- perature and precipitation from different years, but with the climatological sunshine fraction. The last 30-year mean from each 60-year simulation is used as one-year of a 30-year time series. Thirty-year time series of seasonal means of H and LE fluxes from the model are compared with those from ERA40 over the land in the monsoon region. H for the pre-monsoon (MAM) and LE for the monsoon (JJAS) seasons from PEGASUS averaged over the monsoon region reasonably estimate those from ERA- 40 (r = 0.38; P < 0.05 and r = 0.66; P < 0.01 for H and Copyright © 2011 SciRes. IJG 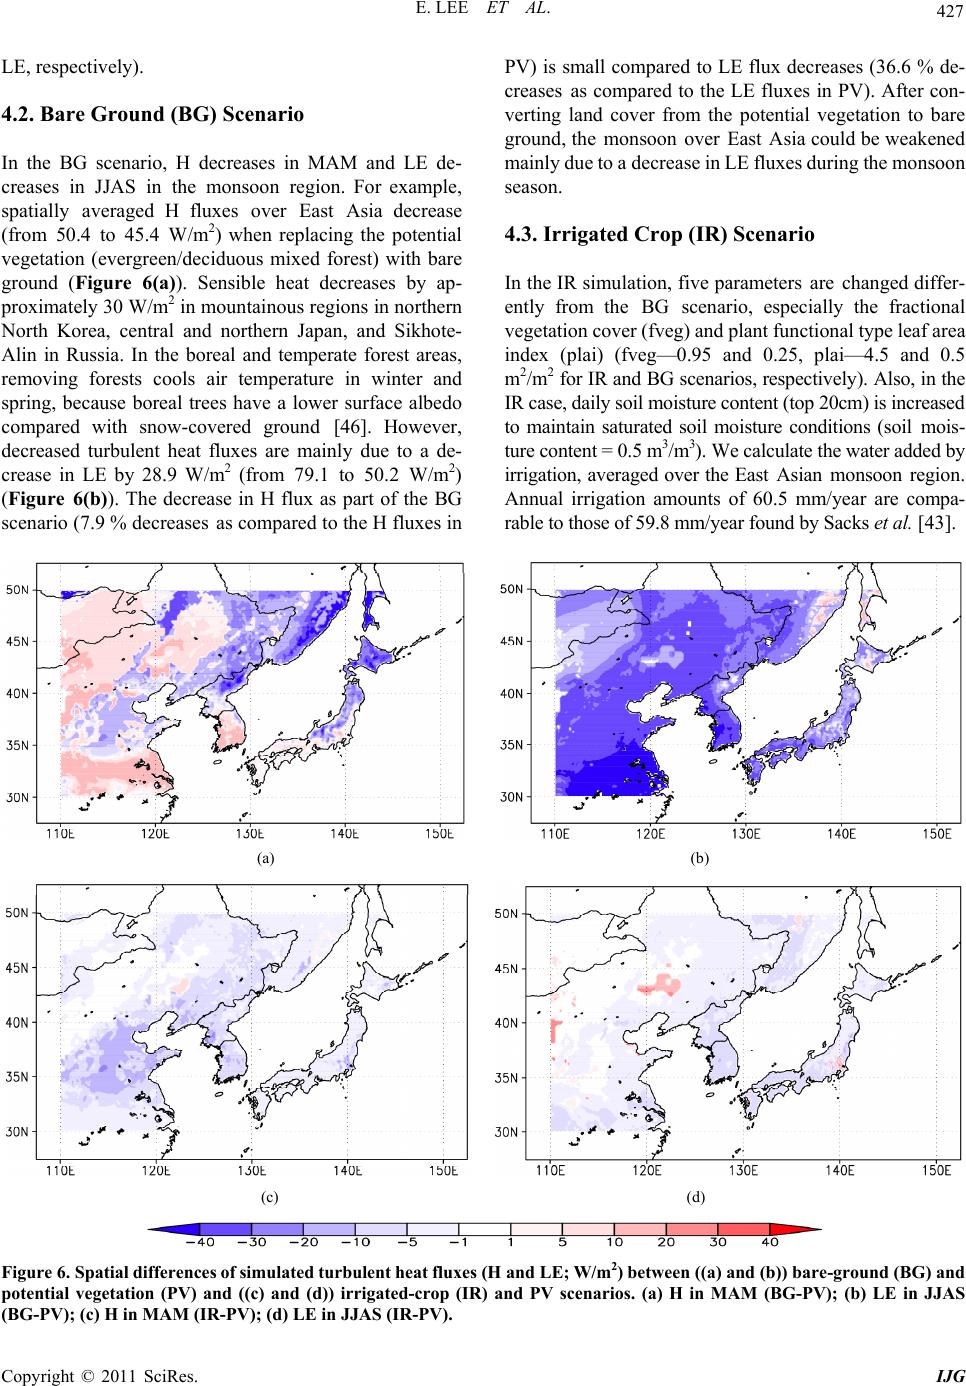 E. LEE ET AL. Copyright © 2011 SciRes. IJG 427 LE, respectively). 4.2. Bare Ground (BG) Scenario In the BG scenario, H decreases in MAM and LE de- creases in JJAS in the monsoon region. For example, spatially averaged H fluxes over East Asia decrease (from 50.4 to 45.4 W/m2) when replacing the potential vegetation (evergreen/deciduous mixed forest) with bare ground (Figure 6(a)). Sensible heat decreases by ap- proximately 30 W/m2 in mountainous regions in northern North Korea, central and northern Japan, and Sikhote- Alin in Russia. In the boreal and temperate forest areas, removing forests cools air temperature in winter and spring, because boreal trees have a lower surface albedo compared with snow-covered ground [46]. However, decreased turbulent heat fluxes are mainly due to a de- crease in LE by 28.9 W/m2 (from 79.1 to 50.2 W/m2) (Figure 6(b)). The decrease in H flux as part of the BG scenario (7.9 % decreases as compared to the H fluxes in PV) is small compared to LE flux decreases (36.6 % de- creases as compared to the LE fluxes in PV). After con- verting land cover from the potential vegetation to bare ground, the monsoon over East Asia could be weakened mainly due to a decrease in LE fluxes during the monsoon season. 4.3. Irrigated Crop (IR) Scenario In the IR simulation, five parameters are changed differ- ently from the BG scenario, especially the fractional vegetation cover (fveg) and plant functional type leaf area index (plai) (fveg—0.95 and 0.25, plai—4.5 and 0.5 m2/m2 for IR and BG scenarios, respectively). Also, in the IR case, daily soil moisture content (top 20cm) is increased to maintain saturated soil moisture conditions (soil mois- ture content = 0.5 m3/m3). We calculate the water added by irrigation, averaged over the East Asian monsoon region. Annual irrigation amounts of 60.5 mm/year are compa- rable to those of 59.8 mm/year found by Sacks et al. [43]. (a) (b) (c) (d) Figure 6. Spatial differences of simu lated turbulent h eat fluxes (H and LE; W/m2) between ((a) and (b)) bare-ground (BG) and potential vegetation (PV) and ((c) and (d)) irrigated-crop (IR) and PV scenarios. (a) H in MAM (BG-PV); (b) LE in JJAS BG-PV); (c) H in MAM (IR-PV); (d) LE in JJAS (IR-PV). ( 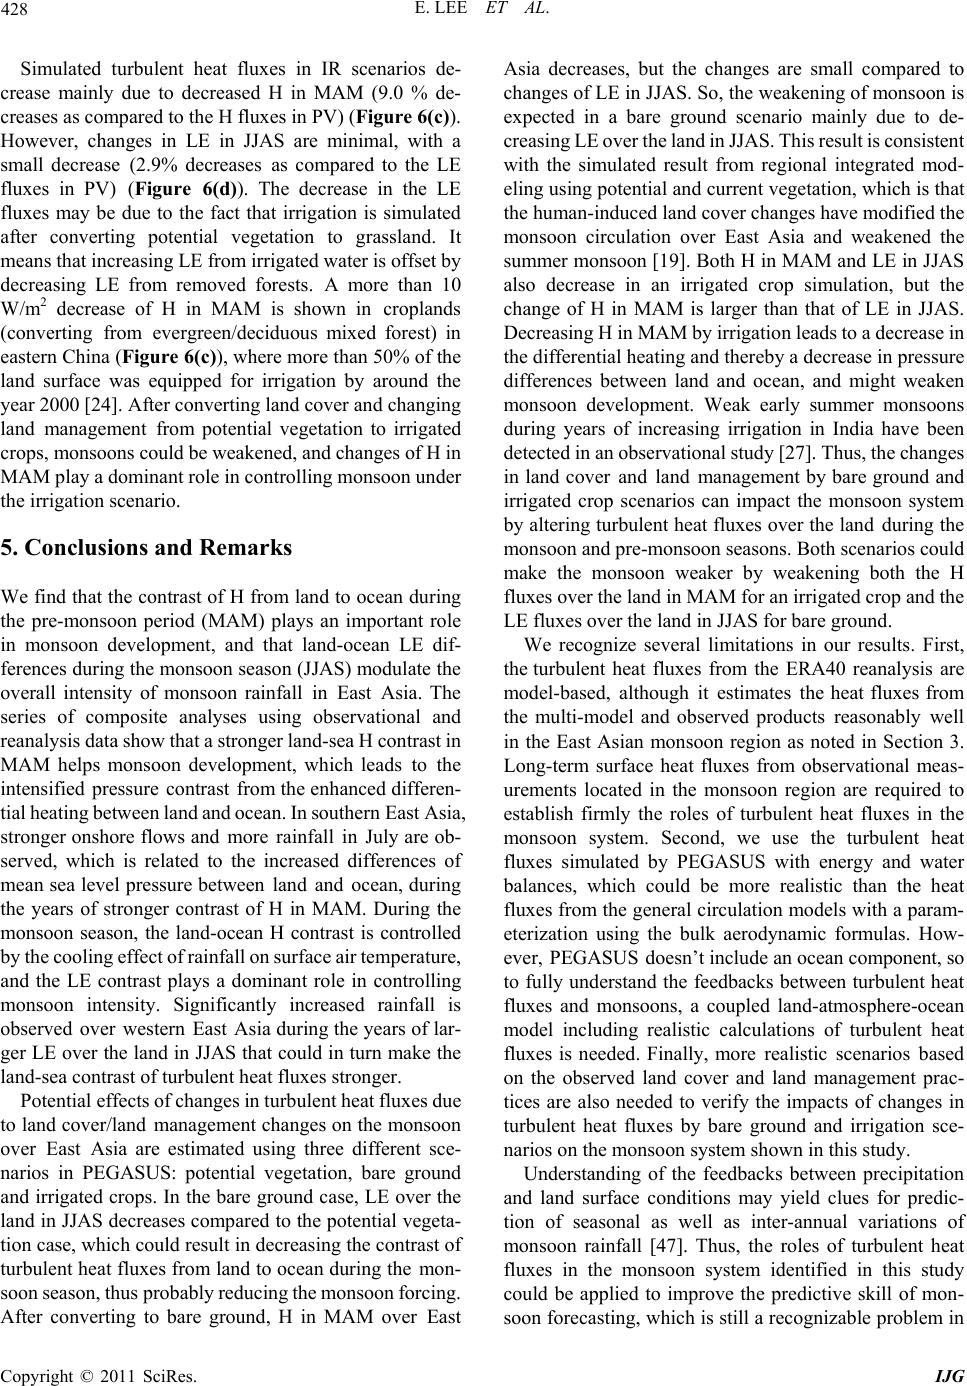 E. LEE ET AL. 428 Simulated turbulent heat fluxes in IR scenarios de- crease mainly due to decreased H in MAM (9.0 % de- creases as compared to the H fluxes in PV) (Figure 6(c)). However, changes in LE in JJAS are minimal, with a small decrease (2.9% decreases as compared to the LE fluxes in PV) (Figure 6(d)). The decrease in the LE fluxes may be due to the fact that irrigation is simulated after converting potential vegetation to grassland. It means that increasing LE from irrigated water is offset by decreasing LE from removed forests. A more than 10 W/m2 decrease of H in MAM is shown in croplands (converting from evergreen/deciduous mixed forest) in eastern China (Figure 6(c)), where more than 50% of the land surface was equipped for irrigation by around the year 2000 [24]. After converting land cover and changing land management from potential vegetation to irrigated crops, monsoons could be weakened, and changes of H in MAM play a dominant role in controlling monsoon under the irrigation scenario. 5. Conclusions and Remarks We find that the contrast of H from land to ocean during the pre-monsoon period (MAM) plays an important role in monsoon development, and that land-ocean LE dif- ferences during the monsoon season (JJAS) modulate the overall intensity of monsoon rainfall in East Asia. The series of composite analyses using observational and reanalysis data show that a stronger land-sea H contrast in MAM helps monsoon development, which leads to the intensified pressure contrast from the enhanced differen- tial heating between land and ocean. In southern East Asia, stronger onshore flows and more rainfall in July are ob- served, which is related to the increased differences of mean sea level pressure between land and ocean, during the years of stronger contrast of H in MAM. During the monsoon season, the land-ocean H contrast is controlled by the cooling effect of rainfall on surface air temperature, and the LE contrast plays a dominant role in controlling monsoon intensity. Significantly increased rainfall is observed over western East Asia during the years of lar- ger LE over the land in JJAS that could in turn make the land-sea contrast of turbulent heat fluxes stronger. Potential effects of changes in turbulent heat fluxes due to land cover/land management changes on the monsoon over East Asia are estimated using three different sce- narios in PEGASUS: potential vegetation, bare ground and irrigated crops. In the bare ground case, LE over the land in JJAS decreases compared to the potential vegeta- tion case, which could result in decreasing the contrast of turbulent heat fluxes from land to ocean during the mon- soon season, thus probably reducing the monsoon forcing. After converting to bare ground, H in MAM over East Asia decreases, but the changes are small compared to changes of LE in JJAS. So, the weakening of monsoon is expected in a bare ground scenario mainly due to de- creasing LE over the land in JJAS. This result is consistent with the simulated result from regional integrated mod- eling using potential and current vegetation, which is that the human-induced land cover changes have modified the monsoon circulation over East Asia and weakened the summer monsoon [19]. Both H in MAM and LE in JJAS also decrease in an irrigated crop simulation, but the change of H in MAM is larger than that of LE in JJAS. Decreasing H in MAM by irrigation leads to a decrease in the differential heating and thereby a decrease in pressure differences between land and ocean, and might weaken monsoon development. Weak early summer monsoons during years of increasing irrigation in India have been detected in an observational study [27]. Thus, the changes in land cover and land management by bare ground and irrigated crop scenarios can impact the monsoon system by altering turbulent heat fluxes over the land during the monsoon and pre-monsoon seasons. Both scenarios could make the monsoon weaker by weakening both the H fluxes over the land in MAM for an irrigated crop and the LE fluxes over the land in JJAS for bare ground. We recognize several limitations in our results. First, the turbulent heat fluxes from the ERA40 reanalysis are model-based, although it estimates the heat fluxes from the multi-model and observed products reasonably well in the East Asian monsoon region as noted in Section 3. Long-term surface heat fluxes from observational meas- urements located in the monsoon region are required to establish firmly the roles of turbulent heat fluxes in the monsoon system. Second, we use the turbulent heat fluxes simulated by PEGASUS with energy and water balances, which could be more realistic than the heat fluxes from the general circulation models with a param- eterization using the bulk aerodynamic formulas. How- ever, PEGASUS doesn’t include an ocean component, so to fully understand the feedbacks between turbulent heat fluxes and monsoons, a coupled land-atmosphere-ocean model including realistic calculations of turbulent heat fluxes is needed. Finally, more realistic scenarios based on the observed land cover and land management prac- tices are also needed to verify the impacts of changes in turbulent heat fluxes by bare ground and irrigation sce- narios on the monsoon system shown in this study. Understanding of the feedbacks between precipitation and land surface conditions may yield clues for predic- tion of seasonal as well as inter-annual variations of monsoon rainfall [47]. Thus, the roles of turbulent heat fluxes in the monsoon system identified in this study could be applied to improve the predictive skill of mon- soon forecasting, which is still a recognizable problem in Copyright © 2011 SciRes. IJG  429 E. LEE ET AL. climate studies. For example, the contrast of sensible heat flux in the pre-monsoon season could be used to enhance the predictability of monsoon precipitation. An improved monsoon prediction algorithm could increase the safety and security for billions of people in the mon- soon regions including West Africa, India, and East Asia. In addition, the simulated weakening of turbulent heat fluxes due to the human-induced land use changes (e.g., deforestation and irrigation) suggests that the expansion and intensification of land use lead to a weakening of monsoon rainfall and correspondingly cause an increasing demand for water. Thus, agricultural and forest agencies in the monsoon regions should be aware of the plausible effects of land use changes on water scarcity and demand when they make land use policy. 6. Acknowledgements We wish to thank Nobuko Saigusa of the Center for Global Environmental Research, National Institute for Environmental Studies, Tsukuba, Japan for providing us with the eddy-covariance data at the Takayama FluxNet site, and Thomas Chase in the CIRES at the University of Colorado, Boulder for reading the manuscript. 7. References [1] E. A. B. Eltahir and C. Gong, “Dynamics of Wet and Dry Years in West Africa,” Journal of Climate, Vol. 9, No. 5, 1996, pp. 1030-1042. doi:10.1175/1520-0442(1996)009<1030:DOWADY>2.0. CO;2 [2] K. K. Kumar, B. Rajagopalan, M. Hoerling, G. Bates and M. Cane, “Unraveling the Mystery of Indian Monsoon Failure during El Niño,” Science, Vol. 314, No. 5796, 2006, pp. 115-119. doi:10.1126/science.1131152 [3] K. Takata, K. Saitoa and T. Yasunari, “Changes in the Asian Monsoon Climate during 1700-1850 Induced by Preindustrial Cultivation,” Proceedings of the National Academy of Sciences, Vol. 106, No. 24, 2009, pp. 9586- 9589. doi:10.1073/pnas.0807346106 [4] P. J. Webster, et al., “Monsoons: Processes, Predictability, and the Prospects for Prediction,” Journal of Geophysical Research, Vol. 103, No. C7, 1998, pp. 14451-14510. doi:10.1029/97JC02719 [5] K. K. Kumar, B. Rajagopalan and M. Cane, “On the Weakening Relationship between the Indian Monsoon and ENSO,” Science, Vol. 284, No. 5423, 1999, pp. 2156-2159. doi:10.1126/science.284.5423.2156 [6] B. Wang, R. Wu and X. Fu, “Pacific-East Asian Tele- connection: How Does ENSO Affect East Asian Climate?” Journal of Climate, Vol. 13, No. 9, 2000, pp. 1517-1536. doi:10.1175/1520-0442(2000)013<1517:PEATHD>2.0.C O;2 [7] T. M. Shanahan, et al., “Atlantic Forcing of Persistent Drought in West Africa,” Science, Vol. 324, No. 5925, 2009, pp. 377-380. doi:10.1126/science.1166352 [8] X. Zheng, E. A. B. Eltahir and K. A. Emanuel, “A Mechanism Relating Tropical Atlantic Spring Sea Sur- face Temperature and West African Rainfall,” Quarterly Journal of the Royal Meteorological Society, Vol. 125, 1999, pp. 1129-1163. [9] G. B. Pant and B. Parthasarathy, “Some Aspects of an Association between the Southern Oscillation and Indian Summer Monsoon,” Meteorology and Atmospheric Physics, Vol. 29, 1981, pp. 245-252. [10] C.-P. Chang, Y. Zhang and T. Li, “Interannual and Inter- decadal Variations of the East Asian Summer Monsoon and Tropical Pacific SSTs. Part I: Roles of the Subtropi- cal Ridge,” Journal of Climate, Vol. 13, No. 24, 2000, pp. 4310-4325. doi:10.1175/1520-0442(2000)013<4310:IAIVOT>2.0.C O;2 [11] E. Lee, T. N. Chase, P. J. Lawrence and B. Rajagopalan, “Model Assessment of the Observed Relationship be- tween El Niño and the Northern East Asian Summer Monsoon Using CAM-CLM3,” Journal of Geophysical Research, Vol. 113, 2008, D20118. doi:10.1029/2008JD009926 [12] E. M. Rasmusson and T. H. Carpenter, “The Relationship between Eastern Equatorial Pacific Sea Surface Tem- peratures and Rainfall over India and Sri Lanka,” Monthly Weather Review, Vol. 111, No. 3, 1983, pp. 517-528. doi:10.1175/1520-0493(1983)111<0517:TRBEEP>2.0.C O;2 [13] J. G. Charney, “Dynamics of Deserts and Drought in Sahel,” Quarterly Journal of the Royal Meteorological Society, Vol. 101, No. 428, 1975, pp. 193-202. doi:10.1002/qj.49710142802 [14] X. Zheng and E. A. B. Eltahir, “The Role of Vegetation in the Dynamics of West African Monsoons,” Journal of Climate, 11, No. 8, 1998, pp. 2078-2096. doi:10.1175/1520-0442-11.8.2078 [15] G. L. Wang, E. A. B. Eltahir, J. A. Foley, D. Pollard and S. Levis, “Decadal Variability of Rainfall in the Sahel: Results from the Coupled GENESIS-IBIS Atmosphere- Biosphere Model,” Climate Dynamics, Vol. 22, No. 6-7, 2004, pp. 625-637. doi:10.1007/s00382-004-0411-3 [16] Y. C. Sud and W. E. Smith, “Influence of Local Land- Surface Processes on the Indian Monsoon: A Numerical Study,” Journal of Climate and Applied Meteorology, Vol. 24, No. 10, 1985, pp. 1015-1036. doi:10.1175/1520-0450(1985)024<1015:IOLLSP>2.0.C O;2 [17] G. A. Meehl, “Influence of the Land Surface in the Asian Summer Monsoon: External Condition versus Internal Feedbacks,” Journal of Climate, Vol. 7, No. 7, 1994, pp. 1033-1049. doi:10.1175/1520-0442(1994)007<1033:IOTLSI>2.0.CO ;2 [18] F. Saeed, S. Hagemann and D. Jacob, “Impact of Irriga- tion on the South Asian Summer Monsoon,” Geophysical Copyright © 2011 SciRes. IJG  E. LEE ET AL. 430 Research Letters, Vol. 36, 2009, L20711. doi:10.1029/2009GL040625 [19] C. Fu, “Potential Impacts of Human-Induced Land Cover Change on East Asia Monsoon, Global Planet,” Change, Vol. 37, 2003, pp. 219-229. [20] E. Lee, T. N. Chase and B. Rajagopalan, “Highly Im- proved Predictive Skill in the Forecasting of the East Asian Summer Monsoon,” Water Resources Research, Vol. 44, 2008, W10422. doi:10.1029/2007WR006514 [21] E. M. Douglas, A. Beltrán-Przekurat, D. Niyogi, R. A. Pielke Sr. and C. J. Vörösmarty, “The Impact of Agricul- tural Intensification and Irrigation on Land–Atmosphere Interactions and Indian Monsoon Precipitation—A Me- soscale Modeling Perspective,” Global and Planetary Change, Vol. 67, No. 1-2, 2009, pp. 117-128. doi:10.1016/j.gloplacha.2008.12.007 [22] N. Gedney and P. J. Valdes, “The Effect of Amazonian Deforestation on the Northern Hemisphere Circulation and Climate,” Geophysical Research Letters, Vol. 27, No. 19, 2000, pp. 3053-3056. doi:10.1029/2000GL011794 [23] J. O. Adegoke, R. A. Pielke Sr., J. Eastman, R. Mahmood and K. G. Hubbard, “Impact of Irrigation on Midsummer Surface Fluxes and Temperature under Dry Synoptic Conditions: A Regional Atmospheric Model Study of the U.S. High Plains,” Monthly Weather Review, Vol. 131, No. 3, 2003, pp. 556-564. doi:10.1175/1520-0493(2003)131<0556:IOIOMS>2.0.C O;2 [24] S. Siebert, P. Döll, J. Hoogeveen, J. M. Faures, K. Fren- ken and S. Feick, “Development and Validation of the Global Map of Irrigation Areas,” Hydrology and Earth System Sciences, Vol. 9, 2005, pp. 535-547. doi:10.5194/hess-9-535-2005 [25] N. Ramankutty, A. Evan, C. Monfreda and J. A. Foley, “Farming the Planet. Part 1: The Geographic Distribution of Global Agricultural Lands in the Year 2000,” Global Biogeochemical Cycles, Vol. 22, 2008, GB1003. doi:10.1029/2007GB002952 [26] T. W. Biggs, C. A. Scott, A. Gaur, J.-P. Venot, T. Chase and E. Lee, “Impacts of Irrigation and Anthropogenic Aerosols on the Water Balance, Heat Fluxes, And Sur- face Temperature in a River Basin,” Water Resources Re- search, Vol. 44, 2008, W12415. doi:10.1029/2008WR006847 [27] E. Lee, T. N. Chase, B. Rajagopalan, R. G. Barry, T. W. Biggs and P. J. Lawrence, “Effects of Irrigation and Ve- getation Activity on Early Indian Summer Monsoon Variability,” International Journal of Climatology, Vol. 29, No. 4, 2009, pp. 573-581. doi:10.1002/joc.1721 [28] S. M. Uppala, et al., “The ERA-40 Reanalysis,” Quar- terly Journal of the Royal Meteorological Society, Vol. 131, No. 612, 2005, pp. 2961-3012. doi:10.1256/qj.04.176 [29] P. A. Dirmeyer, X. Gao, M. Zhao, Z. Guo, T. Oki and N. Hanasaki, “GSWP-2: Multimodel Analysis and Implica- tions for Our Perception of the Land Surface,” Bulletin of the American Meteorological Society, Vol. 87, No. 10, 2006, pp. 1381-1397. doi:10.1175/BAMS-87-10-1381 [30] L. Yu, X. Jin and R. A. Weller, “Multidecade Global Flux Datasets from the Objectively Analyzed Air-Sea Fluxes (OAFlux) Project: WHOI,” OAFlux Project Tech- nical Report OA-2008-01, Woods Hole, 2008. [31] A. Boone, I. Poccard-Leclerq, Y. Xue, J. Feng and P. de Rosnay, “Evaluation of the WAMME Model Surface Fluxes Using Results from the AMMA Land-Surface Model Intercomparison Project,” Climate Dynamics, Vol. 35, No. 1, 2010, pp. 127-142. doi:10.1007/s00382-009-0653-1 [32] T. D. Mitchell, R. C. Timothy, D. J. Philip, H. Mike and N. Mark, “A Comprehensive Set of Climate Scenarios for Europe and the Globe,” Tyndall Centre Working Paper, Vol. 55, 2004, p. 30. [33] P. C. West, G. T. Narisma, C. C. Barford, C. J. Kucharik and J. A. Foley, “A Simple Approach for Quantifying Climate Regulation by Ecosystems,” Frontiers in Ecol- ogy and the Environment, Vol. 9, No. 2, 2011, pp. 126- 133. doi:10.1890/090015 [34] D. Deryng, W. J. Sacks, C. C. Barford and N. Ra- mankutty, “Simulating the Effects of Climate and Agri- cultural Management Practices on Global Crop Yield,” Global Biogeochemical Cycles, Vol. 25, 2011, GB2006. doi:10.1029/2009GB003765 [35] H. L. Penman, “Natural Evaporation from Open Water, Bare Soil and Grass,” Proceedings of the Royal Society of London, Vol. 1032, 1948, pp. 120-145. [36] C. H. B. Priestley and R. J. Taylor, “On the Assessment of Surface Heat Flux and Evaporation Using Large-Scale Parameters,” Monthly Weather Review, Vol. 100, No. 2, 1972, pp. 81-92. doi:10.1175/1520-0493(1972)100<0081:OTAOSH>2.3.C O;2 [37] N. Ramankutty, J. A. Foley, J. Norman and K. McSweeney, “The Global Distribution of Cultivable Lands: Current Patterns and Sensitivity to Possible Climate Change,” Global Ecology and Biogeography, Vol. 11, No. 5, 2002, pp. 377-392. doi:10.1046/j.1466-822x.2002.00294.x [38] D. Gerten, S. Schaphoff, U. Haberlandt, W. Lucht and S. Sitch, “Terrestrial Vegetation and Water Balance—Hy- drological Evaluation of a Dynamic Global Vegetation Model,” Journal of Hydrology, Vol. 286, No. 1-4, 2004, pp. 249-270. doi:10.1016/j.jhydrol.2003.09.029 [39] M. New, D. Lister, M. Hulme and I. Makin, “A High- Resolution Data Set of Surface Climate over Global land Areas,” Climate Research, Vol. 21, No. 1, 2002, pp. 1-25. doi:10.3354/cr021001 [40] P. K. Snyder, C. L. Delire and J. A. Foley, “Evaluating the Influence of Different Vegetation Biomes on the Global Climate,” Climate Dynamics, Vol. 23, No. 3-4, 2004, pp. 279-302. doi:10.1007/s00382-004-0430-0 [41] K. L. Findell, E. Shevliakova, P. C. D. Milly and R. J. Stouffer, “Modeled Impact of Anthropogenic Land Cover Change on Climate,” Journal of Climate, Vol. 20, No. 14, 2007, pp. 3621-3634. doi:10.1175/JCLI4185.1 Copyright © 2011 SciRes. IJG  E. LEE ET AL. Copyright © 2011 SciRes. IJG 431 [42] M. Ozdogan, M. Rodell, H. K. Beaudoing and D. L. Toll, “Simulating the Effects of Irrigation over the U.S. in a Land Surface Model Based on Satellite Derived Agricul- tural Data,” Journal of Hydrometeorology, Vol. 11, No. 1, 2010, pp. 171-184. doi:10.1175/2009JHM1116.1 [43] W. J. Sacks, B. I. Cook, N. Buenning, S. Levis and J. H. Helkowski, “Effects of Global Irrigation on the Near-Surface Climate,” Climate Dynamics, Vol. 33, No. 2-3, 2009, pp. 159-175. doi:10.1007/s00382-008-0445-z [44] J. H. Helkowski, “Global Patterns of Soil Moisture and Runoff: An Assessment of Water Availability,” M.S. Thesis, University of Wisconsin-Madison, Madison, 2004. [45] N. Saigusa, S. Yamamoto, S. Murayama, H. Kondo and N. Nishimura, “Gross Primary Production and Net Eco- system Exchange of a Cool-Temperate Deciduous Forest Estimated by the Eddy Covariance Method,” Agricultural and Forest Meteorology, Vol. 112, No. 3-4, 2002, pp. 203-215. doi:10.1016/S0168-1923(02)00082-5 [46] G. Bonan, “Ecological Climatology,” Cambridge Univer- sity Press, Cambridge, 2008. [47] T. Yasunari, “Land-Atmosphere Interaction,” In B. Wang, Ed., The Asian Monsoon, Springer, Berlin, 2006. doi:10.1007/3-540-37722-0_11
|