 Vol.2, No.4, 392-405 (2011) doi:10.4236/as.2011.24051 C opyright © 2011 SciRes. Openly accessible at http://www.scirp.org/journal/AS/ Agricultural Scienc es Spatial and temporal variability of soil freeze-thaw cycling across Southern Alberta, Canada Andrew J. Phillips1,2*, Nathaniel K. Newlands1 1Environmental Health, Agriculture and Agri-Food Canada, Lethbridge Research Centre, Lethbridge, Canada; *Corresponding Author: ajphilli@ucalgary.ca 2Department of Geomatics Engineering, Schulich School of Engineering, University of Calgary, Calgary, Canada. Received 9 September 2011; revised 21 October 2011; accepted 30 October 2011. ABSTRACT Soil freeze-thaw cycles play an important role in all aspects of agro-ecosystems, such as crop productivity, the evolution of the soil matrix, including trace-gas emissions. In regions that experience synoptic weather conditions through- out the winter, freeze-thaw cycles generally oc- cur in one of two categories; seasonal or winter cycles. Current soil vegetation atmosphere mod- els (SVAT’s) often include a heat-transport soil freeze-thaw algorithm, but lack detail on complex interactions between the main driving variables. Boundary conditions for these models are often based only on a few climate variables and typi- cally lack regional context. A nested statistical analysis was applied to identify the optimal set of environmental variables (via a stepwise re- gression selection procedure) to track soil freeze-thaw dynamics. Historical data collected between the years 2006-2009, for 17 long-term climate stations distributed across southern Alberta Canada was utilized. Cross-correlation between wind speed and maximum air tem- perature identified Chinook-driven freeze-thaw events, with such interaction varying signifi- cantly across the region and by soil depth. Cli- mate-soil interactions were most significant predictors of soil temperature during winter months. The seasonal freeze-thaw cycle is es- timated to vary between 112 - 131 days, consist- ing of 12 - 20 winter cycles (1 cm depth), and 1-5 winter cycles (5 cm depth) with average lag time of 26 - 112 days. Freeze-thaw prediction was greatly improved when higher-order climate in- teraction terms were considered. Our findings highlight the importance of soil-water assume- ptions within complex ecosystem SVAT models in resolving regional-driven climatic trends. Alon g - side improved representation of regional trends aimed at reducing model-based uncertainty, such efforts are expected to, in tandem, help advance the geostatistical design, and imple- mentation of agroenvironmental monitoring sys- tems that combine in-situ and satellite/remote- sensing derived estimates of near-surface soil moisture. Keywords: Freeze-Thaw; Soil Temperature; Agro-Ecosystem Modeling; Regional Climate; Soil Science 1. INTRODUCTION Soil freeze-thaw cycles affect plant growth, greenhouse gas emissions, soil structure, stability, microbe popula- tions and nutrients. Freeze-thaw cycles have been shown to increase grassland above-ground productivity, while causing root damage [1]. Significant increases in nitrous oxide (N2O) emissions, a major greenhouse gas that con- tributes to global warming from agricultural systems, has been documented during thawing events, with the great- est emissions occurring during the spring thaw [2,3]. Freeze-thaw variability regulates the cumulative release of N2O by controlling how water, in its different states, physically blocks emission from the soil surface. At depth, soil temperature, that regulates biological micro- bial activity, is also affected by freeze-thaw variability. Freeze-thaw cycles reduce soil aggregate size and make soils more susceptible to erosion [4]. There is evidence that soil microorganism populations adapt in order to survive in regions that experience multiple winter freeze- thaw cycles [5]. Recent findings indicate that climate change may increase the frequency of freeze-thaw cycles [6]. Alongside anticipated changes in the frequency of freeze-thaw events, the amplitude or strength of influ- ence is also expected to increase, given the longer ab- sence of insulating snow cover (i.e., longer growing sea- sons at polar latitudes) that accompanies a rise in global 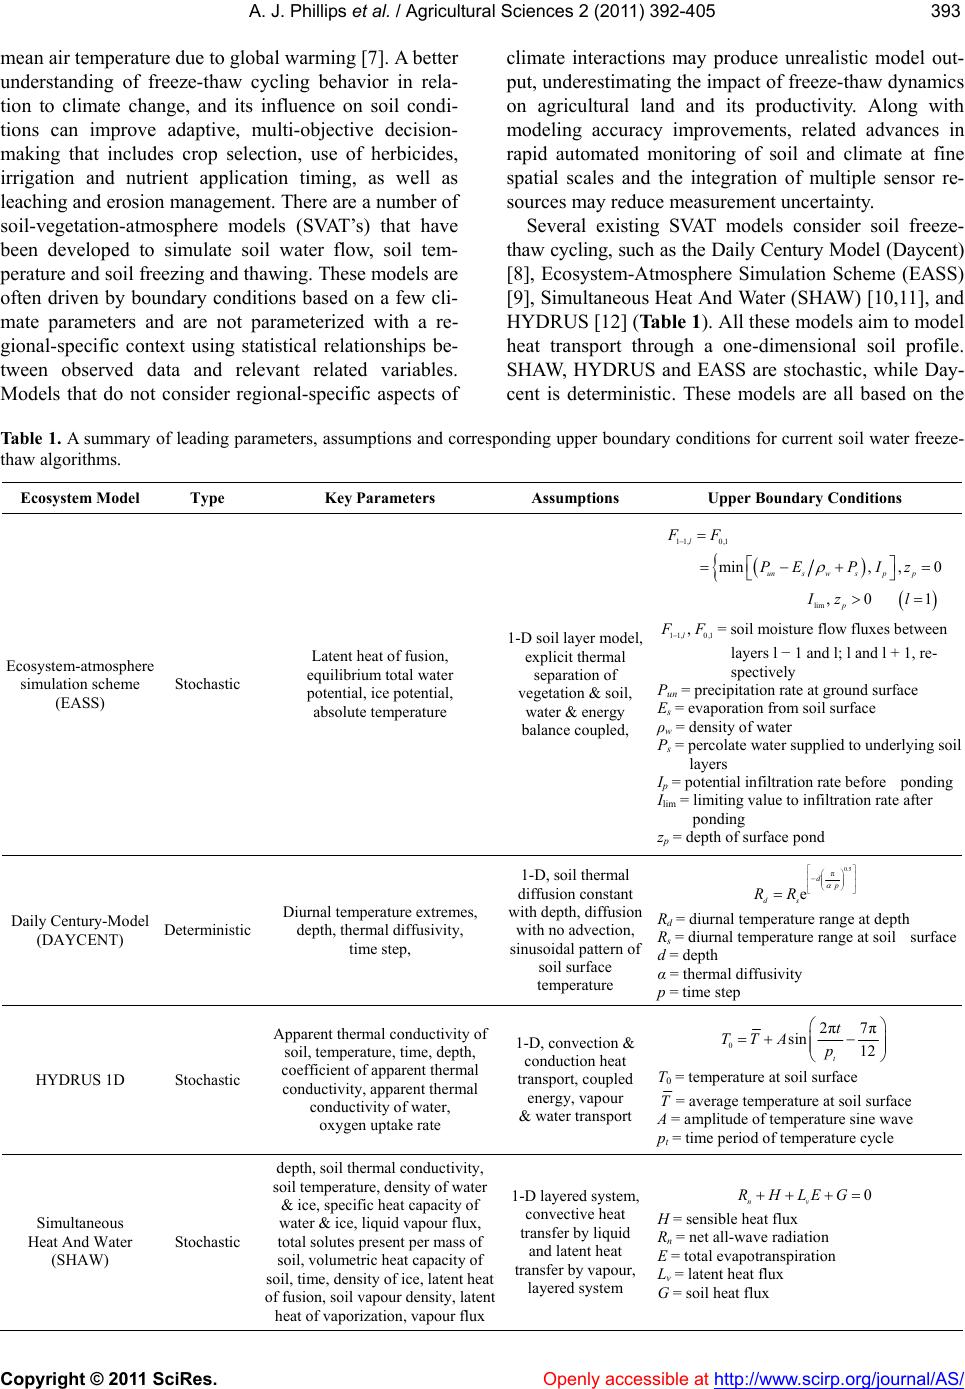 A. J. Phillips et al. / Agricultural Sciences 2 (2011) 392-405 Copyright © 2011 SciRes. Openly accessible at http://www.scirp.org/journal/AS/ 393393 mean air temperature due to global warming [7]. A better understanding of freeze-thaw cycling behavior in rela- tion to climate change, and its influence on soil condi- tions can improve adaptive, multi-objective decision- making that includes crop selection, use of herbicides, irrigation and nutrient application timing, as well as leaching and erosion management. There are a number of soil-vegetation-atmosphere models (SVAT’s) that have been developed to simulate soil water flow, soil tem- perature and soil freezing and thawing. These models are often driven by boundary conditions based on a few cli- mate parameters and are not parameterized with a re- gional-specific context using statistical relationships be- tween observed data and relevant related variables. Models that do not consider regional-specific aspects of climate interactions may produce unrealistic model out- put, underestimating the impact of freeze-thaw dynamics on agricultural land and its productivity. Along with modeling accuracy improvements, related advances in rapid automated monitoring of soil and climate at fine spatial scales and the integration of multiple sensor re- sources may reduce measurement uncertainty. Several existing SVAT models consider soil freeze- thaw cycling, such as the Daily Century Model (Daycent) [8], Ecosystem-Atmosphere Simulation Scheme (EASS) [9], Simultaneous Heat And Water (SHAW) [10,11], and HYDRUS [12] (Table 1). All these models aim to model heat transport through a one-dimensional soil profile. SHAW, HYDRUS and EASS are stochastic, while Day- cent is deterministic. These models are all based on the Table 1. A summary of leading parameters, assumptions and corresponding upper boundary conditions for current soil water freeze- thaw algorithms. Ecosystem Model Type Key Parameters Assumptions Upper Boundary Conditions Ecosystem-atmosphere simulation scheme (EASS) Stochastic Latent heat of fusion, equilibrium total water potential, ice potential, absolute temperature 1-D soil layer model, explicit thermal separation of vegetation & soil, water & energy balance coupled, 11, 0,1 lim min,,0 ,0 1 l uns wspp p FF PE PIz Iz l 11, 0,1 , l F = soil moisture flow fluxes between layers l − 1 and l; l and l + 1, re- spectively Pun = precipitation rate at ground surface Es = evaporation from soil surface ρw = density of water Ps = percolate water supplied to underlying soil layers Ip = potential infiltration rate before ponding Ilim = limiting value to infiltration rate after ponding zp = depth of surface pond Daily Century-Model (DAYCENT) Deterministic Diurnal temperature extremes, depth, thermal diffusivity, time step, 1-D, soil thermal diffusion constant with depth, diffusion with no advection, sinusoidal pattern of soil surface temperature 0.5 π e dp ds RR Rd = diurnal temperature range at depth Rs = diurnal temperature range at soil surface d = depth α = thermal diffusivity p = time step HYDRUS 1D Stochastic Apparent thermal conductivity of soil, temperature, time, depth, coefficient of apparent thermal conductivity, apparent thermal conductivity of water, oxygen uptake rate 1-D, convection & conduction heat transport, coupled energy, vapour & water transport 0 2π7π sin 12 t t TTA p T0 = temperature at soil surface T = average temperature at soil surface A = amplitude of temperature sine wave pt = time period of temperature cycle Simultaneous Heat And Water (SHAW) Stochastic depth, soil thermal conductivity, soil temperature, density of water & ice, specific heat capacity of water & ice, liquid vapour flux, total solutes present per mass of soil, volumetric heat capacity of soil, time, density of ice, latent heat of fusion, soil vapour density, latent heat of vaporization, vapour flux 1-D layered system, convective heat transfer by liquid and latent heat transfer by vapour, layered system 0 nv RHLEG H = sensible heat flux Rn = net all-wave radiation E = total evapotranspiration Lv = latent heat flux G = soil heat flux 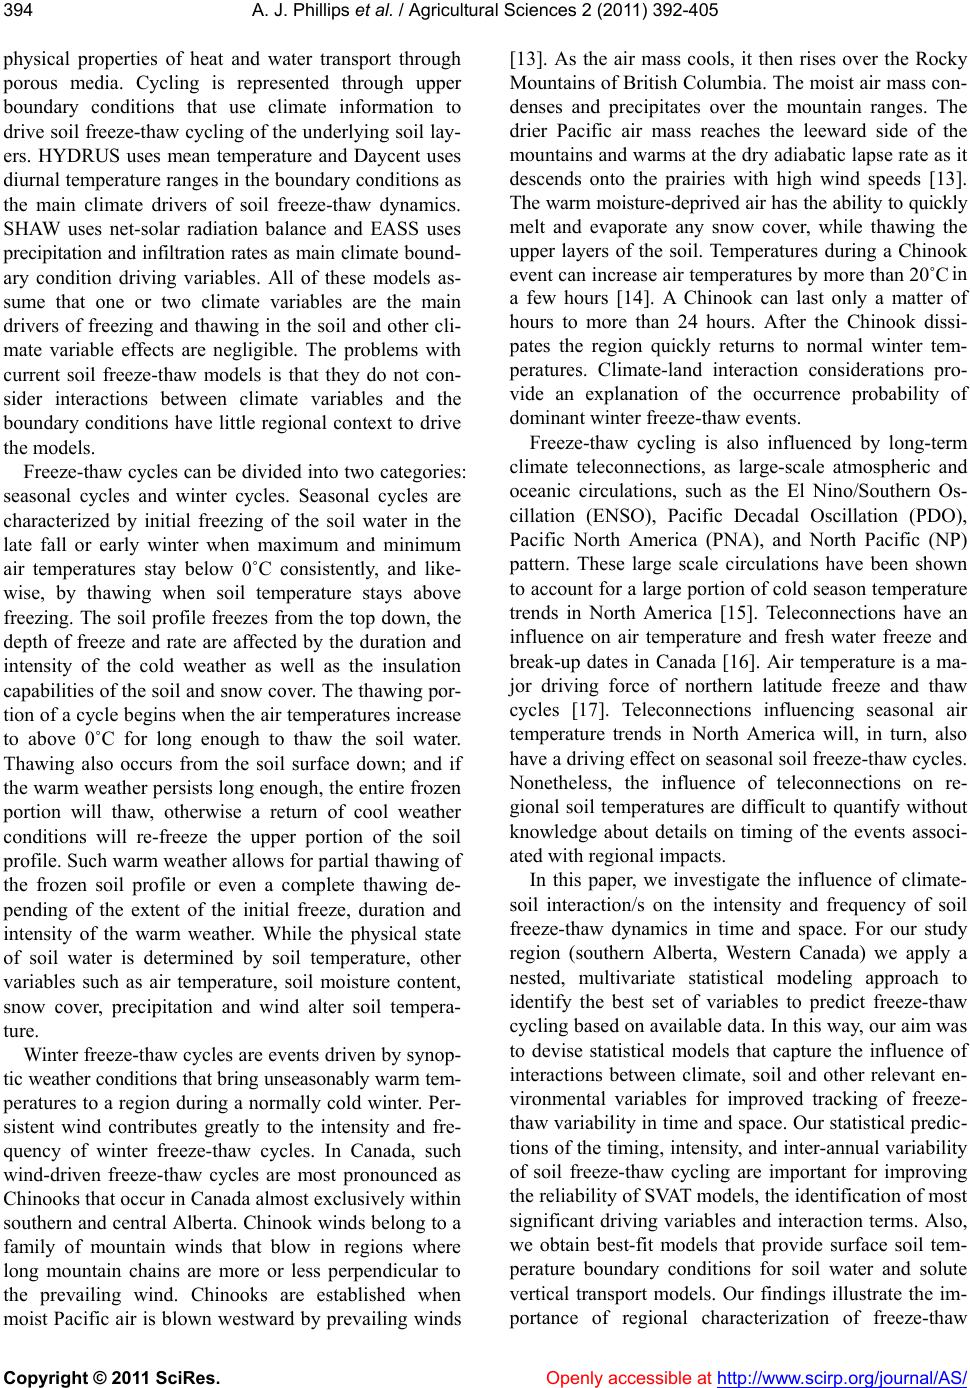 A. J. Phillips et al. / Agricultural Sciences 2 (2011) 392-405 Copyright © 2011 SciRes. Openly accessible at http://www.scirp.org/journal/AS/ 394 physical properties of heat and water transport through porous media. Cycling is represented through upper boundary conditions that use climate information to drive soil freeze-thaw cycling of the underlying soil lay- ers. HYDRUS uses mean temperature and Daycent uses diurnal temperature ranges in the boundary conditions as the main climate drivers of soil freeze-thaw dynamics. SHAW uses net-solar radiation balance and EASS uses precipitation and infiltration rates as main climate bound- ary condition driving variables. All of these models as- sume that one or two climate variables are the main drivers of freezing and thawing in the soil and other cli- mate variable effects are negligible. The problems with current soil freeze-thaw models is that they do not con- sider interactions between climate variables and the boundary conditions have little regional context to drive the models. Freeze-thaw cycles can be divided into two categories: seasonal cycles and winter cycles. Seasonal cycles are characterized by initial freezing of the soil water in the late fall or early winter when maximum and minimum air temperatures stay below 0˚C consistently, and like- wise, by thawing when soil temperature stays above freezing. The soil profile freezes from the top down, the depth of freeze and rate are affected by the duration and intensity of the cold weather as well as the insulation capabilities of the soil and snow cover. The thawing por- tion of a cycle begins when the air temperatures increase to above 0˚C for long enough to thaw the soil water. Thawing also occurs from the soil surface down; and if the warm weather persists long enough, the entire frozen portion will thaw, otherwise a return of cool weather conditions will re-freeze the upper portion of the soil profile. Such warm weather allows for partial thawing of the frozen soil profile or even a complete thawing de- pending of the extent of the initial freeze, duration and intensity of the warm weather. While the physical state of soil water is determined by soil temperature, other variables such as air temperature, soil moisture content, snow cover, precipitation and wind alter soil tempera- ture. Winter freeze-thaw cycles are events driven by synop- tic weather conditions that bring unseasonably warm tem- peratures to a region during a normally cold winter. Per- sistent wind contributes greatly to the intensity and fre- quency of winter freeze-thaw cycles. In Canada, such wind-driven freeze-thaw cycles are most pronounced as Chinooks that occur in Canada almost exclusively within southern and central Alberta. Chinook winds belong to a family of mountain winds that blow in regions where long mountain chains are more or less perpendicular to the prevailing wind. Chinooks are established when moist Pacific air is blown westward by prevailing winds [13]. As the air mass cools, it then rises over the Rocky Mountains of British Columbia. The moist air mass con- denses and precipitates over the mountain ranges. The drier Pacific air mass reaches the leeward side of the mountains and warms at the dry adiabatic lapse rate as it descends onto the prairies with high wind speeds [13]. The warm moisture-deprived air has the ability to quickly melt and evaporate any snow cover, while thawing the upper layers of the soil. Temperatures during a Chinook event can increase air temperatures by more than 20˚C in a few hours [14]. A Chinook can last only a matter of hours to more than 24 hours. After the Chinook dissi- pates the region quickly returns to normal winter tem- peratures. Climate-land interaction considerations pro- vide an explanation of the occurrence probability of dominant winter freeze-thaw events. Freeze-thaw cycling is also influenced by long-term climate teleconnections, as large-scale atmospheric and oceanic circulations, such as the El Nino/Southern Os- cillation (ENSO), Pacific Decadal Oscillation (PDO), Pacific North America (PNA), and North Pacific (NP) pattern. These large scale circulations have been shown to account for a large portion of cold season temperature trends in North America [15]. Teleconnections have an influence on air temperature and fresh water freeze and break-up dates in Canada [16]. Air temperature is a ma- jor driving force of northern latitude freeze and thaw cycles [17]. Teleconnections influencing seasonal air temperature trends in North America will, in turn, also have a driving effect on seasonal soil freeze-thaw cycles. Nonetheless, the influence of teleconnections on re- gional soil temperatures are difficult to quantify without knowledge about details on timing of the events associ- ated with regional impacts. In this paper, we investigate the influence of climate- soil interaction/s on the intensity and frequency of soil freeze-thaw dynamics in time and space. For our study region (southern Alberta, Western Canada) we apply a nested, multivariate statistical modeling approach to identify the best set of variables to predict freeze-thaw cycling based on available data. In this way, our aim was to devise statistical models that capture the influence of interactions between climate, soil and other relevant en- vironmental variables for improved tracking of freeze- thaw variability in time and space. Our statistical predic- tions of the timing, intensity, and inter-annual variability of soil freeze-thaw cycling are important for improving the reliability of SVAT models, the identification of most significant driving variables and interaction terms. Also, we obtain best-fit models that provide surface soil tem- perature boundary conditions for soil water and solute vertical transport models. Our findings illustrate the im- portance of regional characterization of freeze-thaw 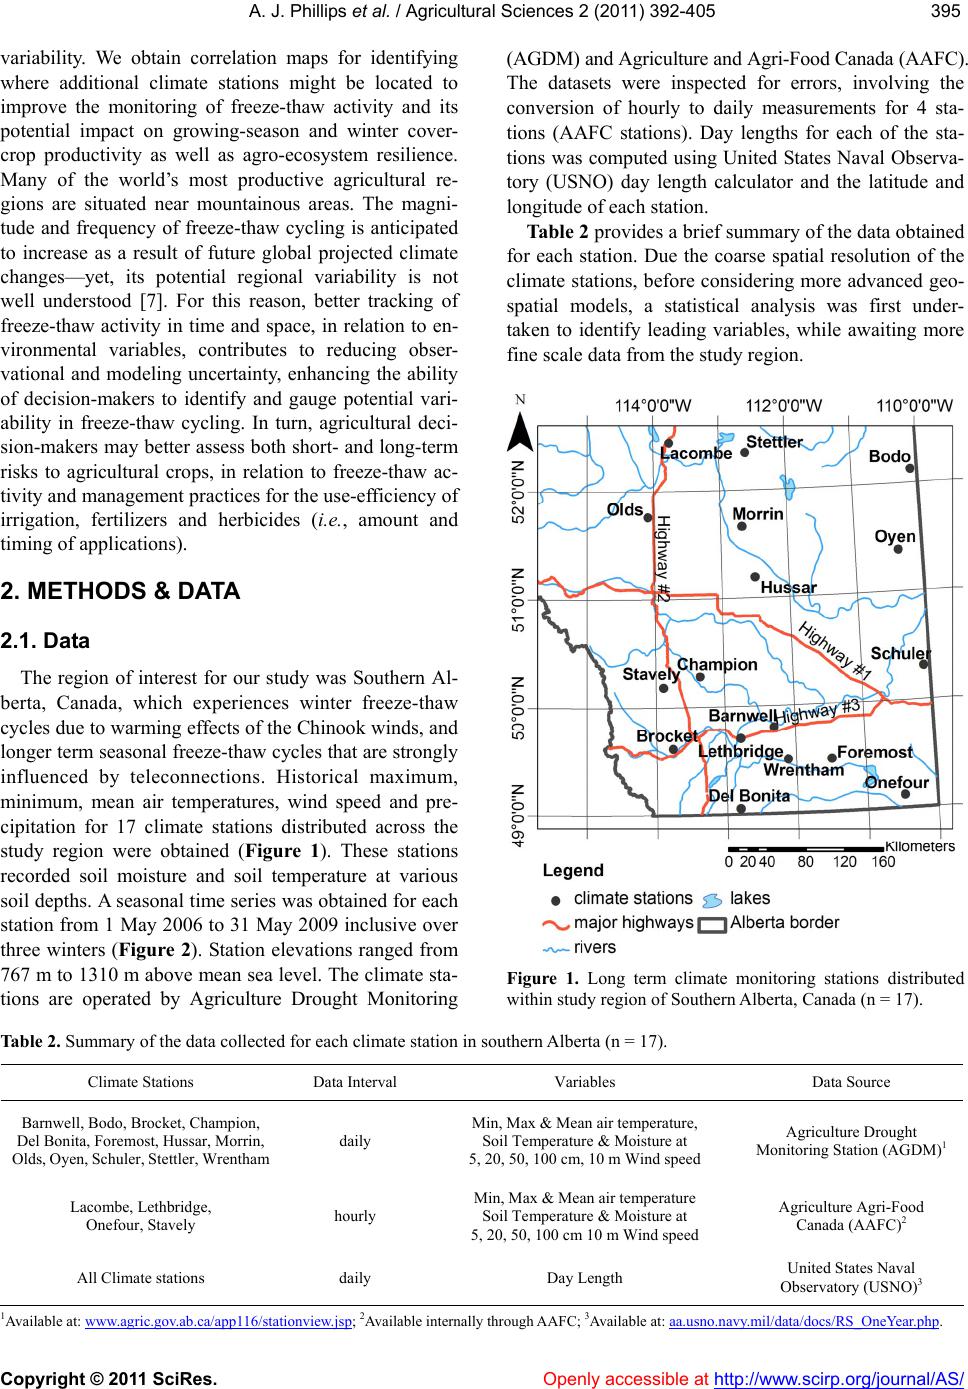 A. J. Phillips et al. / Agricultural Sciences 2 (2011) 392-405 Copyright © 2011 SciRes. Openly accessible at http://www.scirp.org/journal/AS/ 395395 variability. We obtain correlation maps for identifying where additional climate stations might be located to improve the monitoring of freeze-thaw activity and its potential impact on growing-season and winter cover- crop productivity as well as agro-ecosystem resilience. Many of the world’s most productive agricultural re- gions are situated near mountainous areas. The magni- tude and frequency of freeze-thaw cycling is anticipated to increase as a result of future global projected climate changes—yet, its potential regional variability is not well understood [7]. For this reason, better tracking of freeze-thaw activity in time and space, in relation to en- vironmental variables, contributes to reducing obser- vational and modeling uncertainty, enhancing the ability of decision-makers to identify and gauge potential vari- ability in freeze-thaw cycling. In turn, agricultural deci- sion-makers may better assess both short- and long-term risks to agricultural crops, in relation to freeze-thaw ac- tivity and management practices for the use-efficiency of irrigation, fertilizers and herbicides (i.e., amount and timing of applications). 2. METHODS & DATA 2.1. Data The region of interest for our study was Southern Al- berta, Canada, which experiences winter freeze-thaw cycles due to warming effects of the Chinook winds, and longer term seasonal freeze-thaw cycles that are strongly influenced by teleconnections. Historical maximum, minimum, mean air temperatures, wind speed and pre- cipitation for 17 climate stations distributed across the study region were obtained (Figure 1). These stations recorded soil moisture and soil temperature at various soil depths. A seasonal time series was obtained for each station from 1 May 2006 to 31 May 2009 inclusive over three winters (Figure 2). Station elevations ranged from 767 m to 1310 m above mean sea level. The climate sta- tions are operated by Agriculture Drought Monitoring (AGDM) and Agriculture and Agri-Food Canada (AAFC). The datasets were inspected for errors, involving the conversion of hourly to daily measurements for 4 sta- tions (AAFC stations). Day lengths for each of the sta- tions was computed using United States Naval Observa- tory (USNO) day length calculator and the latitude and longitude of each station. Table 2 provides a brief summary of the data obtained for each station. Due the coarse spatial resolution of the climate stations, before considering more advanced geo- spatial models, a statistical analysis was first under- taken to identify leading variables, while awaiting more fine scale data from the study region. Figure 1. Long term climate monitoring stations distributed within study region of Southern Alberta, Canada (n = 17). Table 2. Summary of the data collected for each climate station in southern Alberta (n = 17). Climate Stations Data Interval Variables Data Source Barnwell, Bodo, Brocket, Champion, Del Bonita, Foremost, Hussar, Morrin, Olds, Oyen, Schuler, Stettler, Wrentham daily Min, Max & Mean air temperature, Soil Temperature & Moisture at 5, 20, 50, 100 cm, 10 m Wind speed Agriculture Drought Monitoring Station (AGDM)1 Lacombe, Lethbridge, Onefour, Stavely hourly Min, Max & Mean air temperature Soil Temperature & Moisture at 5, 20, 50, 100 cm 10 m Wind speed Agriculture Agri-Food Canada (AAFC)2 All Climate stations daily Day Length United States Naval Observatory (USNO)3 1Available at: www.agric.gov.ab.ca/app116/stationview.jsp; 2Available internally through AAFC; 3Available at: aa.usno.navy.mil/data/docs/RS_OneYear.php. 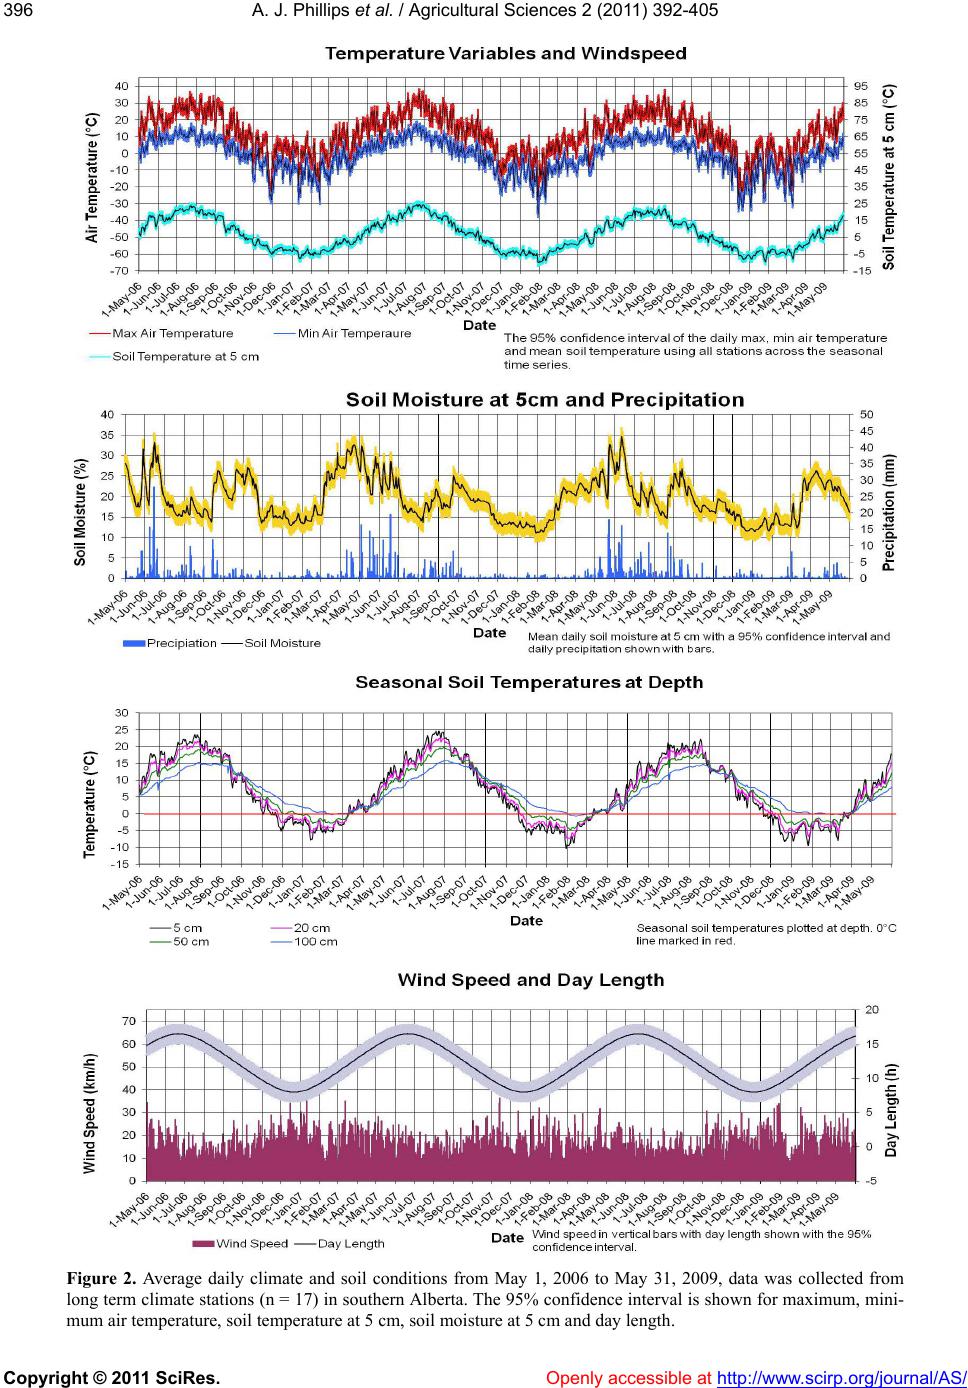 A. J. Phillips et al. / Agricultural Sciences 2 (2011) 392-405 Copyright © 2011 SciRes. Openly accessible at http://www.scirp.org/journal/AS/ 396 Figure 2. Average daily climate and soil conditions from May 1, 2006 to May 31, 2009, data was collected from long term climate stations (n = 17) in southern Alberta. The 95% confidence interval is shown for maximum, mini- mum air temperature, soil temperature at 5 cm, soil moisture at 5 cm and day length. 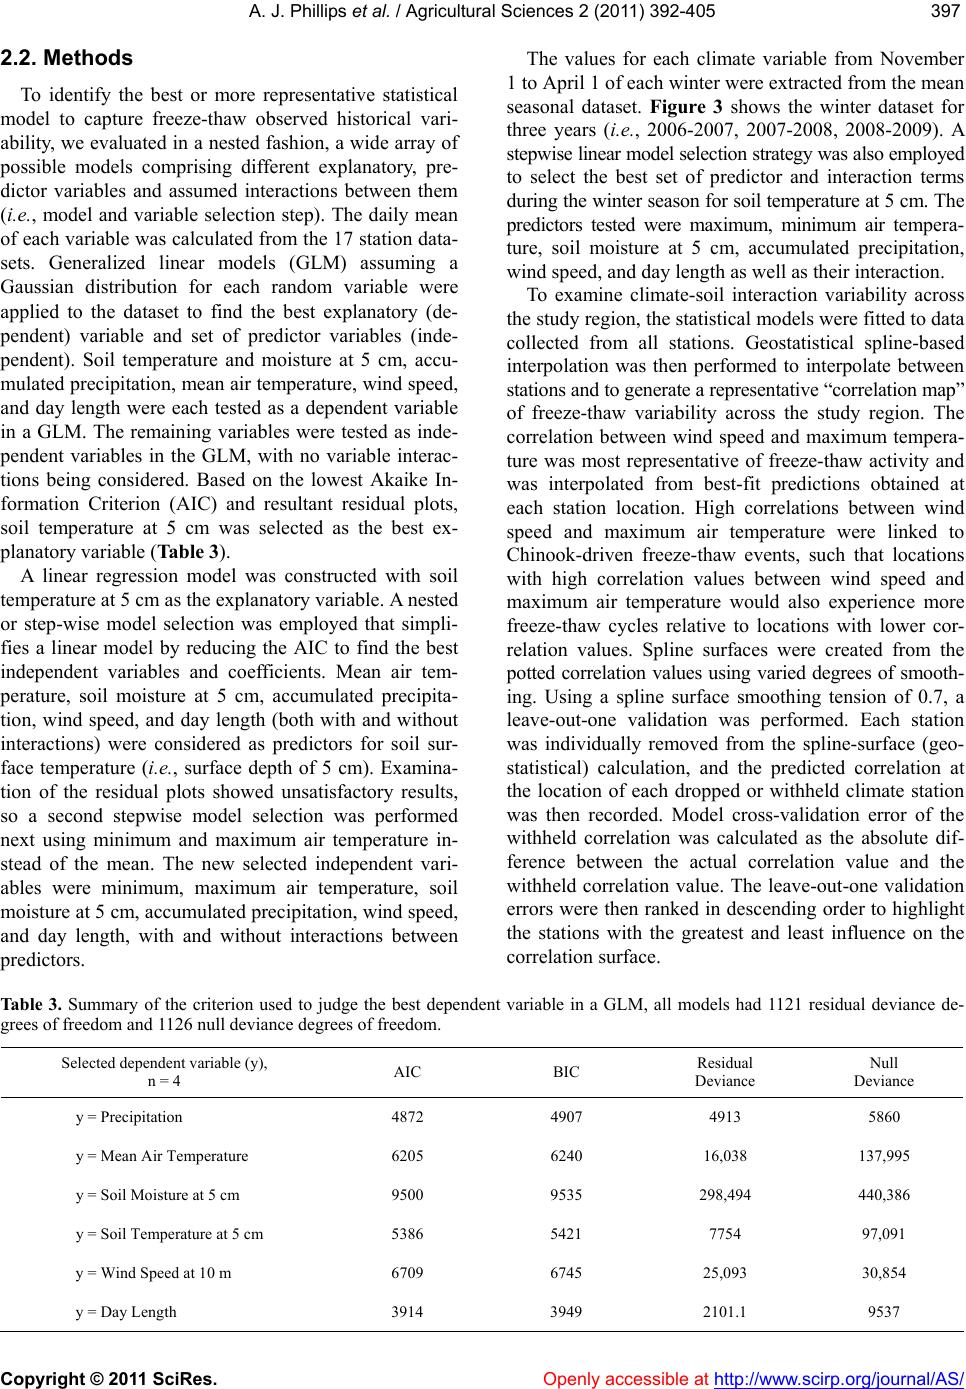 A. J. Phillips et al. / Agricultural Sciences 2 (2011) 392-405 Copyright © 2011 SciRes. http://www.scirp.org/journal/AS/Openly accessible at 397397 2.2. Methods To identify the best or more representative statistical model to capture freeze-thaw observed historical vari- ability, we evaluated in a nested fashion, a wide array of possible models comprising different explanatory, pre- dictor variables and assumed interactions between them (i.e., model and variable selection step). The daily mean of each variable was calculated from the 17 station data- sets. Generalized linear models (GLM) assuming a Gaussian distribution for each random variable were applied to the dataset to find the best explanatory (de- pendent) variable and set of predictor variables (inde- pendent). Soil temperature and moisture at 5 cm, accu- mulated precipitation, mean air temperature, wind speed, and day length were each tested as a dependent variable in a GLM. The remaining variables were tested as inde- pendent variables in the GLM, with no variable interac- tions being considered. Based on the lowest Akaike In- formation Criterion (AIC) and resultant residual plots, soil temperature at 5 cm was selected as the best ex- planatory variable (Table 3). A linear regression model was constructed with soil temperature at 5 cm as the explanatory variable. A nested or step-wise model selection was employed that simpli- fies a linear model by reducing the AIC to find the best independent variables and coefficients. Mean air tem- perature, soil moisture at 5 cm, accumulated precipita- tion, wind speed, and day length (both with and without interactions) were considered as predictors for soil sur- face temperature (i.e., surface depth of 5 cm). Examina- tion of the residual plots showed unsatisfactory results, so a second stepwise model selection was performed next using minimum and maximum air temperature in- stead of the mean. The new selected independent vari- ables were minimum, maximum air temperature, soil moisture at 5 cm, accumulated precipitation, wind speed, and day length, with and without interactions between predictors. The values for each climate variable from November 1 to April 1 of each winter were extracted from the mean seasonal dataset. Figure 3 shows the winter dataset for three years (i.e., 2006-2007, 2007-2008, 2008-2009). A stepwise linear model selection strategy was also employed to select the best set of predictor and interaction terms during the winter season for soil temperature at 5 cm. The predictors tested were maximum, minimum air tempera- ture, soil moisture at 5 cm, accumulated precipitation, wind speed, and day length as well as their interaction. To examine climate-soil interaction variability across the study region, the statistical models were fitted to data collected from all stations. Geostatistical spline-based interpolation was then performed to interpolate between stations and to generate a representative “correlation map” of freeze-thaw variability across the study region. The correlation between wind speed and maximum tempera- ture was most representative of freeze-thaw activity and was interpolated from best-fit predictions obtained at each station location. High correlations between wind speed and maximum air temperature were linked to Chinook-driven freeze-thaw events, such that locations with high correlation values between wind speed and maximum air temperature would also experience more freeze-thaw cycles relative to locations with lower cor- relation values. Spline surfaces were created from the potted correlation values using varied degrees of smooth- ing. Using a spline surface smoothing tension of 0.7, a leave-out-one validation was performed. Each station was individually removed from the spline-surface (geo- statistical) calculation, and the predicted correlation at the location of each dropped or withheld climate station was then recorded. Model cross-validation error of the withheld correlation was calculated as the absolute dif- ference between the actual correlation value and the withheld correlation value. The leave-out-one validation errors were then ranked in descending order to highlight the stations with the greatest and least influence on the correlation surface. Table 3. Summary of the criterion used to judge the best dependent variable in a GLM, all models had 1121 residual deviance de- grees of freedom and 1126 null deviance degrees of freedom. Selected dependent variable (y), n = 4 AIC BIC Residual Deviance Null Deviance y = Precipitation 4872 4907 4913 5860 y = Mean Air Temperature 6205 6240 16,038 137,995 y = Soil Moisture at 5 cm 9500 9535 298,494 440,386 y = Soil Temperature at 5 cm 5386 5421 7754 97,091 y = Wind Speed at 10 m 6709 6745 25,093 30,854 y = Day Length 3914 3949 2101.1 9537 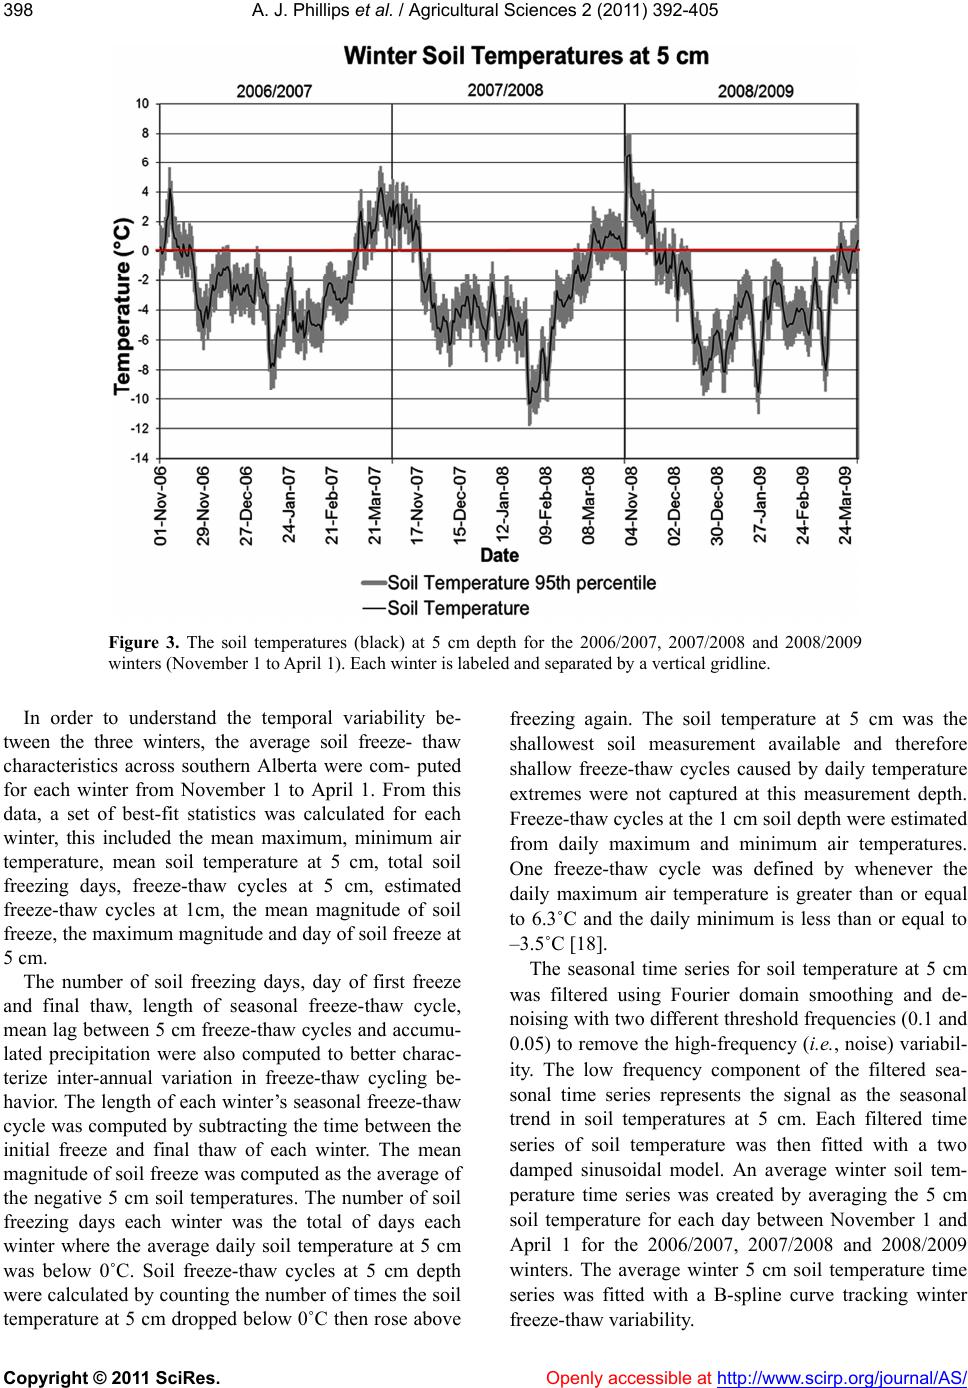 A. J. Phillips et al. / Agricultural Sciences 2 (2011) 392-405 Copyright © 2011 SciRes. Openly accessible at http://www.scirp.org/journal/AS/ 398 Figure 3. The soil temperatures (black) at 5 cm depth for the 2006/2007, 2007/2008 and 2008/2009 winters (November 1 to April 1). Each winter is labeled and separated by a vertical gridline. In order to understand the temporal variability be- tween the three winters, the average soil freeze- thaw characteristics across southern Alberta were com- puted for each winter from November 1 to April 1. From this data, a set of best-fit statistics was calculated for each winter, this included the mean maximum, minimum air temperature, mean soil temperature at 5 cm, total soil freezing days, freeze-thaw cycles at 5 cm, estimated freeze-thaw cycles at 1cm, the mean magnitude of soil freeze, the maximum magnitude and day of soil freeze at 5 cm. The number of soil freezing days, day of first freeze and final thaw, length of seasonal freeze-thaw cycle, mean lag between 5 cm freeze-thaw cycles and accumu- lated precipitation were also computed to better charac- terize inter-annual variation in freeze-thaw cycling be- havior. The length of each winter’s seasonal freeze-thaw cycle was computed by subtracting the time between the initial freeze and final thaw of each winter. The mean magnitude of soil freeze was computed as the average of the negative 5 cm soil temperatures. The number of soil freezing days each winter was the total of days each winter where the average daily soil temperature at 5 cm was below 0˚C. Soil freeze-thaw cycles at 5 cm depth were calculated by counting the number of times the soil temperature at 5 cm dropped below 0˚C then rose above freezing again. The soil temperature at 5 cm was the shallowest soil measurement available and therefore shallow freeze-thaw cycles caused by daily temperature extremes were not captured at this measurement depth. Freeze-thaw cycles at the 1 cm soil depth were estimated from daily maximum and minimum air temperatures. One freeze-thaw cycle was defined by whenever the daily maximum air temperature is greater than or equal to 6.3˚C and the daily minimum is less than or equal to –3.5˚C [18]. The seasonal time series for soil temperature at 5 cm was filtered using Fourier domain smoothing and de- noising with two different threshold frequencies (0.1 and 0.05) to remove the high-frequency (i.e., noise) variabil- ity. The low frequency component of the filtered sea- sonal time series represents the signal as the seasonal trend in soil temperatures at 5 cm. Each filtered time series of soil temperature was then fitted with a two damped sinusoidal model. An average winter soil tem- perature time series was created by averaging the 5 cm soil temperature for each day between November 1 and April 1 for the 2006/2007, 2007/2008 and 2008/2009 winters. The average winter 5 cm soil temperature time series was fitted with a B-spline curve tracking winter freeze-thaw variability. 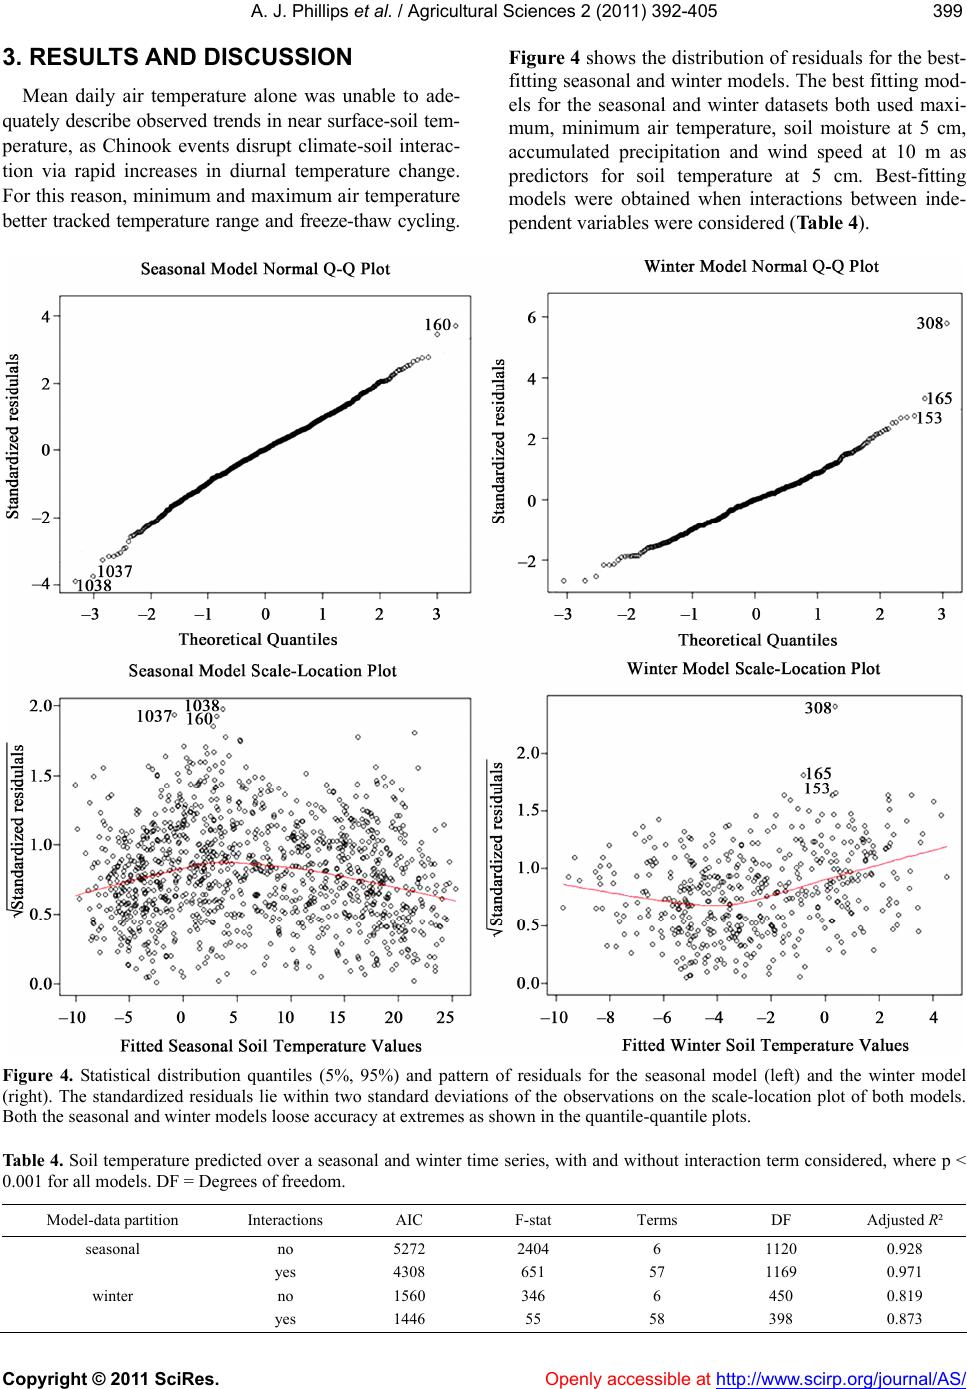 A. J. Phillips et al. / Agricultural Sciences 2 (2011) 392-405 Copyright © 2011 SciRes. Openly accessible at http://www.scirp.org/journal/AS/ 399399 3. RESULTS AND DIS CUSSION Mean daily air temperature alone was unable to ade- quately describe observed trends in near surface-soil tem- perature, as Chinook events disrupt climate-soil interac- tion via rapid increases in diurnal temperature change. For this reason, minimum and maximum air temperature better tracked temperature range and freeze-thaw cycling. Figure 4 shows the distribution of residuals for the best- fitting seasonal and winter models. The best fitting mod- els for the seasonal and winter datasets both used maxi- mum, minimum air temperature, soil moisture at 5 cm, accumulated precipitation and wind speed at 10 m as predictors for soil temperature at 5 cm. Best-fitting models were obtained when interactions between inde- pendent variables were considered (Table 4). Figure 4. Statistical distribution quantiles (5%, 95%) and pattern of residuals for the seasonal model (left) and the winter model (right). The standardized residuals lie within two standard deviations of the observations on the scale-location plot of both models. Both the seasonal and winter models loose accuracy at extremes as shown in the quantile-quantile plots. Table 4. Soil temperature predicted over a seasonal and winter time series, with and without interaction term considered, where p < 0.001 for all models. DF = Degrees of freedom. Model-data partition Interactions AIC F-stat Terms DF Adjusted R² seasonal no 5272 2404 6 1120 0.928 yes 4308 651 57 1169 0.971 winter no 1560 346 6 450 0.819 yes 1446 55 58 398 0.873  A. J. Phillips et al. / Agricultural Sciences 2 (2011) 392-405 Copyright © 2011 SciRes. Openly accessible at http://www.scirp.org/journal/AS/ 400 T Nested/stepwise model selection for the winter dataset did not improve the prediction skill of the winter model with interactions as much as the seasonal model with interactions. While more interactions were considered in the best fit winter model, the greater number of predictor terms in the best-fitting winter model is likely due to stronger climate fluctuations during winter. The quan- tile-quantile plot in Figure 4 shows that both the sea- sonal and winter models need improved prediction ac- curacy at soil temperature extremes. Eq.1 represents the reduced form of the best fitting statistical model for the seasonal time series. All predictor terms of soil tempera- ture in Eq.1 had a p < 0.001. Eq.1 can be used to esti- mate the soil temperature at 5 cm in the study region. Eq.2 estimates winter soil temperatures between No- vember 1 and April 1 in the study region and represents the reduced form of the best fitting statistical model for the winter time series. All the terms used for predicting soil temperature in Eq.2 had a p < 0.01. Eqs.1 and 2 are regional-specific and therefore capture complex interac- tions between climate variables that drive soil tempera- ture throughout the year and during the winter season. max min minmax min 5.4 0.23430.0474 0.053220.007781 0.00787750.58. s TD MDPTT PT MT T M PMW (1) max minmaxmin maxmin 0.1237 0.1877 0.009223. s TTT PT TTM (2) Ts = soil temperature at 5 cm Tmax = daily max temperature Tmin =daily min temperature M = soil moisture at 5 cm W =wind speed at 10 m P =precipitation D =day length Maximum and minimum air temperature, as individ- ual predictors of soil temperature in both the winter and seasonal models, were significant (p < 0.01), with their interaction also significant (winter p < 0.001, seasonal p < 0.05). The higher significance level of climate-soil interactions during winter indicates that diurnal tem- perature range is critical for predicting soil temperature during the winter season. In the seasonal model the only significant predictors of soil temperature were: day length (p < 0.001), soil moisture (p < 0.01) and precipi- tation (p < 0.05). The high significance level of day length in the seasonal model was expected because in Northern mid-latitudes the length of day has been pre- viously shown to drive seasonal climate variation. Southern Alberta receives very little winter precipitation; the av- erage accumulated precipitation for the region was 138 mm in total over the three winters. Whereas the average accumulated precipitation between May 1, 2006 and May 31, 2009 for the study region was 1078 mm. In the winter model, precipitation did not significantly (p > 0.1) contribute to the prediction of soil temperature, but pre- cipitation was significant (p < 0.05) in predicting soil temperature in the seasonal model. Soil moisture was only a significant (p < 0.01) predictor of soil temperature in the seasonal model. Likely precipitation and soil mois- ture individually play a more significant role in driving soil temperature during the spring and summer when precipitation events are more frequent and soil water is unfrozen. Despite the low amount of precipitation during the winter, precipitation and soil moisture still had sig- nificant predictive ability for soil temperature when in- teracting with other climate variables in the winter model. Interacting terms were significant predictors of soil temperature in the winter model, indicating that winter soil temperatures are driven by complex interactions between climate variables. A notable significant interac- tion term in the winter model was maximum air tem- perature, minimum air temperature and wind speed (p < 0.05), this interaction had a positive influence on soil temperature. The maximum, minimum air temperature and wind speed interaction may be capturing the Chi- nook events; these events can increase daily maximum, minimum air temperatures associated with high wind speed [13]. The specific interaction terms that may be related to long term synoptic climate events, such as teleconnections nonetheless require more investigation as the complex nature of how teleconnections influence climate and freeze-thaw events over large areas. Between November 1 and April 1, wind speed and soil moisture were strongly correlated across all stations, with correlation ranging between 0.81 at Barnwell and Stavely to 0.96 at Oyen, with a mean of 0.88. The strong winter co-occurrence of soil moisture and wind speed in southern Alberta is best explained as driven by Chinook events. Chinooks bring warm-dry-high-speed winds that have the ability to melt snow and thaw the upper layers of soil [14], snow melt that is not evaporated can infil- trate into the thawed upper soil layers. Maximum air temperature and wind speed were not as strongly corre- lated as wind speed and soil moisture during the winter, 0.66 at Onefour to 0.89 at Oyen with an average correla- tion of 0.71 (Table 5). Figure 5 shows significant spatial variability in the correlation between maximum air tem- perature and wind speed. The various fitted spline sur- faces of this correlation pattern of climate-soil variability reveal a similar spatial pattern to the observed regional pattern of Alberta’s Chinook signal from 1951-1990 [13]. The similar spatial pattern between Alberta’s average Chinook signal and the maximum air temperature and wind speed correlation surface supports the idea that a  A. J. Phillips et al. / Agricultural Sciences 2 (2011) 392-405 Copyright © 2011 SciRes. Openly accessible at http://www.scirp.org/journal/AS/ 401401 Table 5. Best-fit model cross-validation (leave-one-out) statistical results: Maximum air temperature and wind speed correlations at each station before and after each station is withheld from the spatial interpolation, with the absolute error of predicted correlation value error and error rank of each station. The maximum air temperature and wind speed correlation values were used as an indicator potential freeze-thaw cycling due the relationship between Chinook events, unseasonably warm temperatures and wind speed. Station name Correlation of wind speed and max air temperature Predicted correlation at withheld station Absolute error of predicted correlation Error rank of predicted correlation Barnwell 0.70 0.700 0.000 17 Bodo 0.72 0.924 0.204 1 Brocket 0.76 0.778 0.018 14 Champion 0.70 0.744 0.044 6 Del Bonita 0.76 0.718 0.042 9 Foremost 0.66 0.602 0.058 5 Hussar 0.66 0.704 0.044 7 Lacombe 0.68 0.681 0.001 16 Lethbridge 0.74 0.734 0.007 15 Morrin 0.71 0.667 0.043 8 Olds 0.69 0.708 0.018 13 Onefour 0.60 0.636 0.036 10 Oyen 0.89 0.707 0.183 2 Schuler 0.71 0.771 0.067 3 Stavely 0.76 0.727 0.033 12 Stettler 0.68 0.713 0.033 11 Wrentham 0.64 0.699 0.057 4 Mean error: 0.052 Figure 5. Predicted strength of spatial occurrence of freeze- thaw, based on station monitoring data (n = 17) for maximum air temperature and wind speed (10 m) using thin-plate spline interpolation under varying degrees of smoothing. Chinook event is a complex interaction between two or more climate variables. Locations with high correlation values between wind speed and maximum air tempera- ture were expected to have an increased occurrence of Chinook events and freeze-thaw cycles. Tab le 5 shows the results of the leave-one-out cross-validation, the pre- dicted wind speed and maximum temperature correlation value at the location of each withheld station was re- corded, the absolute difference between observed corre- lation value and the predicted values were calculated and ranked. Barnwell, Lethbridge and Lacombe had the low- est absolute difference between observed and predicted correlation values, this can be explained by these sta- tions’ relative close proximity to surrounding stations with similar wind speed and maximum temperature cor- relation values (Tabl e 5 ). The results of the leave-one- out validation show that Oyen, Bodo and Schuler had the largest errors (Ta b l e 5) and therefore were the most in- fluential stations in calculation of the spline surfaces (Figure 6). Oyen, Bodo and Schuler are all in the most eastern part of the study region with a large spatial gap between these monitoring stations and the nearest sta- tions to the west. For example, there is a larger variation in correlation pattern at Hussar (0.66) and Oyen (0.89). In order to better track climatic influences on agro-eco- systems, additional monitoring stations likely need to be placed near such locations where higher observed corre- lation between climate and soil interaction is detected. The area between Hussar and to the east Oyen, Bodo and Schuler is a prime candidate for an additional climate monitoring station that would improve the tracking of Chinook related climate interactions in eastern Alberta. The winter of 2006/2007 was the mildest of the three winters; it had the warmest mean soil temperature, mean maximum and minimum air temperatures (Table 6). The average and the maximum magnitude of soil freeze were warmer than the following winters. Consistently warmer air temperatures would have led to repetitive thawing and refreezing of the upper 1 cm of the soil leading to an  A. J. Phillips et al. / Agricultural Sciences 2 (2011) 392-405 Copyright © 2011 SciRes. Openly accessible at http://www.scirp.org/journal/AS/ 402 Figure 6. The results of the leave-one-validation for the three stations with the largest absolute error of the predicted strength of freeze-thaw spatial occurrence (spline tension = 0.7). estimated 18 freeze-thaw cycles at 1 cm soil depth. One explanation for there being only 4 freeze-thaw cycles at 5 cm depth is soil temperature at 1 cm depth will be sen- sitive to daily fluctuations in air temperature, whereas soil at 5 cm depth will need prolonged exposure to warm temperatures to thaw [19]. The difference between the length of the seasonal freeze-thaw cycle and soil freez- ing days within the cycle show that when the soil thawed at 5 cm depth it remained unfrozen for multiple days. The 2006/2007 winter received the second most winter precipitation that may have provided some insulation to the soil [20] preventing the soil from freezing to the 5 cm depth. The 2006/2007 winter had the earliest date of initial soil freeze and final thaw at 5 cm, cold tempera- tures may have come early with warmer temperatures coming earlier as well. The date of maximum magnitude of soil freeze being in mid-January instead of later in the month provides evidence of an earlier winter. The winter of 2007/2008 had the lowest amount of accumulated winter precipitation; this may have contributed to the low average soil temperature, the coldest minimum soil temperature and the low number of freeze-thaw cycles at 5 cm depth (Tab le 6). The lack of winter precipitation may have led to minimal snow cover to insulate the soil. Without much snow cover the soil surface would be more susceptible to air temperature extremes [20]. The 2007/2008 winter experienced the largest range between the mean minimum air temperature and the mean maxi- mum air temperature; this would explain the larger num- ber of 1 cm depth freeze-thaw cycles when compared to the 2008/2009 winter. A contributing factor to the lack of freeze-thaw cycles at 5 cm depth during the 2007/2008 winter may be that the positive temperatures lacked per- sistence and intensity to thaw the soil much below 1 cm depth, leading to an estimated 20 cycles near the surface and yet only 1 at the 5 cm depth. An interesting aspect of the 2007/2008 winter is that the soil freezing days and length of the seasonal cycle are the same, supporting the idea that the warm weather was never able to thaw the soil to 5 cm. The date of coldest soil temperature, initial soil freeze and final thaw indicate that the 2007/2008 winter was shorter, with a late start and earlier end than the preceding and following winters. The coldest of the winters was 2008/2009; the mean maximum and mini- mum air temperatures were the lowest of the three win- ters. The 2008/2009 winter had a warmer mean soil tem- perature, mean and maximum magnitude of soil freeze at Table 6. The average climate variability of the southern Albertan winters (November 1 to April 1) for each winter. Each reported variable is an average value computed using all the southern Alberta climates stations (n = 17). Winters Variables related to freeze-thaw 2006/2007 2007/2008 2008/2009 mean max air temperature (˚C) 1.302 0.533 –0.716 mean min air temperature (˚C) –9.923 –11.557 –12.172 mean soil temperature at 5 cm depth (˚C) –2.013 –2.894 –2.867 soil freezing days 114 112 127 Freeze-thaw cycles at 5 cm depth 4 1 5 estimated freeze-thaw cycles at 1 cm depth 18 20 12 average magnitude of soil freeze at 5 cm depth (˚C) –3.253 –4.469 –3.916 coldest soil temperature at 5 cm depth (˚C) –7.848 –10.325 –9.546 day of coldest soil temperature at 5 cm depth 12-Jan-07 29-Jan-08 26-Jan-09 first freeze 02-Nov-06 19-Nov-07 20-Nov-08 final thaw 10-Mar-07 10-Mar-08 31-Mar-09 length of winter freeze-thaw cycle 128 112 131 average lag time between freeze-thaw cycles 32 112 26 accumulated precipitation (mm) 52.415 36.943 69.118  A. J. Phillips et al. / Agricultural Sciences 2 (2011) 392-405 Copyright © 2011 SciRes. Openly accessible at http://www.scirp.org/journal/AS/ 403403 Figure 7. B-spline curve fitted to average soil temperature (5 cm depth, R² = 0.99) in southern Alberta between November 1 and April 1. Fitted soil temperature B-spline curve represents the boundary condi- tion calibrated with a regional-specific context. All fitted soil temperature fit within the observed soil temperature at 5 cm depth 95th percentiles. 5 cm than the previous winter (Tab le 6). More accumu- lated winter precipitation is likely the main reason for warmer soils, snow cover may have insulated the soil from colder air temperatures [20]. The 2008/2009 winter had the least number of soil freeze-thaw cycles at 1 cm (12) and the most at 5 cm (5); this is likely caused by a few intense warming events with a long enough duration thaw deeper soil layers instead of many short-duration low-intensity warming events. The 2008/2009 winter had the latest day of initial soil freeze and final thaw at 5 cm but was still the longest winter as indicated by the soil freezing days (Table 6). Figure 7 shows the fitted B-spline curve fitted to the average winter soil temperature time series for southern Alberta. The B-spline fitted curve had a R² = 0.99 when compared to the actual average winter soil temperature at 5 cm depth and was used as the winter season regional- specific portion of Eq.3. The B-spline cure fitted tends to overestimate the peaks and under estimate troughs observed in the average winter soil temperature time series. The regional-specific soil surface boundary con- dition is represented by Eq.3 and can be used to drive freeze-thaw algorithms using regional-specific climate data. Fitting sinusoidal curves to a temporally filtered seasonal signal provides the regional-specific seasonal boundary condition for seasonal soil temperature trends in Eq.3. Fitting the B-spline curve the average winter time series provides a regional-specific winter boundary condition that can estimate winter freeze-thaw cycles. The proposed model was developed using regional-spe- cific climate data instead of generic boundary conditions that require only one or two climate variable inputs. , 0 13.247sin 0.0030.244 20.945sin3.496, ,Apr. 1Nov. 1 Apr. 1Nov. 1, Nov. 1Apr. 1 t tn iin i et t Tt t tP t bt (3) T = temperature [˚C] t = time [s] λ = decay rate n = degree of B-spline Pi = knot (control point) bi = B-spline coefficient 4. CONCLUSIONS Our findings illustrate the importance of regional context in modeling freeze-thaw cycles. Our results in- dicate that the interaction between air temperature and wind drives variability in soil temperatures and if in- cluded when specifying boundary conditions or cali-  A. J. Phillips et al. / Agricultural Sciences 2 (2011) 392-405 Copyright © 2011 SciRes. Openly accessible at http://www.scirp.org/journal/AS/ 404 brating to historical climate, may significantly improve the prediction skills of models framed at many different spatial and temporal scales, e.g. soil water and solute vertical transport or ecosystem scale models. By consid- ering a nested statistical modeling approach to capture regional-specific freeze-thaw variability, we utilize a set of best-fit measures (leave-one-out cross validation), and geostatistical spine interpolation, to better identify the influence of measurement and model-based uncertainty on our model predictions of freeze-thaw variability over our study region and both annual-scale and winter time- periods. The spatial analysis of the correlation of wind speed and maximum air temperature revealed areas of southern Alberta where the correlation between these two variables varies most strongly. This kind of spatial analysis that reveals the most influential climate monitoring stations on model predictions and can be used to infer where additional climate monitoring stations could be located to better track climate signals and freeze-thaw dynamics within the study region (southern Alberta). The interwinter variability revealed that freeze-thaw cycling behaviour varies differently in the winter months compared to the full annual seasonal cycle. From this result, we infer that, to more reliably predict and track freeze-thaw activity, its spatial and temporal variability needs to be better represented. Often historical data is limited, but none- theless statistical modeling can be performed and used to guide how new monitoring data can, in the future, be collected to improve SVAT model prediction skill. Specifically, our findings suggest that freeze-thaw sig- nalling within southern Alberta is strongest during winter months at several key monitoring stations. Where climate-soil correlation is most statistically significant are guiding regions where monitoring activity could be sampled at higher frequency and at greater resolution using networks of wireless soil moisture sensors. Our findings also provide a statistical soil surface boundary condition that captures both the seasonal and winter-scale variability of soil temperature. This boundary condition can be incorporated in SVAT and soil water/ solute vertical transport models. Our work illustrates how models can be given regional context, by calibrating them to a representative statistical model that captures main climatic trends, regional variation, and climate-soil interaction terms. In such a statistical representative model, we show here that freeze-thaw cycling is one ex- ample of a climate-soil interaction term. Using this statistical approach, regional calibration of models that require tracking of soil water movement can be improved, especially in regions where freeze-thaw activity is strong. Use of a single, simplified statistical model also potentially offers a way to simplify climate-related inputs to complex SVAT and agro-ecosystem models. Future modeling work will explore how the spatial pattern and inter-annual variation of soil freeze-thaw cycling dynamics is regulated by climate teleconnections and synoptic climate events. Related work will look at the integration of fine scale climate and soil data with multiple sensor resources to help advance the geostatis- tical design, and implementation of agro-environmental monitoring systems that combine in-situ and satellite/ remote-sensing derived estimates of near-surface soil moisture. 5. ACKNOWLEDGEMENTS The authors would to acknowledge R. Scott Erickson (Agriculture and Agri-Food Canada) and Prof. Steven Liang (University of Calgary) for helpful editorial comments that improved an earlier version of this manuscript. This work was made possible by funding from the Sus- tainable Agriculture Environmental Systems (SAGES) Growing For- ward Program, Agriculture and Agri-Food Canada (Federal Govern- ment of Canada). REFERENCES [1] Kreyling, J., Beierkuhnlein, C., Pritsch, K., Schloter, M. and Jentsch, A. (2008) Recurrent soil freeze-thaw cycles enhance grassland productivity. New Phytologist, 177, 938-945. doi:10.1111/j.1469-8137.2007.02309.x [2] Chang, C. and Hao, X. (2001) Source of N2O emission from a soil during freezing and thawing. Phyton, 41, 49-60. [3] Matzner, E. and Borken, W. (2008) Do freeze-thaw events enhance C and N losses from soils of different ecosystems? A review. European Journal of Soil Science, 59, 274-284. doi:10.1111/j.1365-2389.2007.00992.x [4] Bullock, M.S., Larney, F.J., Izaurralde, R.C.S. and Feng, Y. (2001) Overwinter changes in wind erodibility of clay loam soils in Southern Alberta. Soil Science Society of America, 65, 423-430. doi:10.2136/sssaj2001.652423x [5] Walker, V.K., Palmer, G.R. and Voordouw, G. (2006) Freeze-thaw tolerance and clues to the winter survival of a soil community. Applied and Environmental Microbiology, 73, 1784-1792. doi:10.1128/AEM.72.3.1784-1792.2006 [6] Henry, H.A.L. (2008) Climate change and soil freezing dynamics: Historical trends and projected changes. Cli- matic Change, 87, 421-434. doi:10.1007/s10584-007-9322-8 [7] IPCC (2007) Climate change 2007: Synthesis report. In: Pachauri, R.K and Reisinger, A., Eds., 4th Assessment Report of the Intergovernmental Panel on Climate Change IPCC, Geneva, 104. [8] Eitzinger, J., Parton, W.J. and Hartman, M. (2000) Im- provment and validation of a daily soil temperature sub- model for freezing/thawing. Soil Science, 165, 525-534. doi: 10.1007/s10584-007-9322-8 [9] Chen, B., Chen, J.M. and Ju, W. (2007) Remote sensing- based ecosystem-atmosphere simulation scheme (EASS)— Model formulation and test with multiple-year data.  A. J. Phillips et al. / Agricultural Sciences 2 (2011) 392-405 Copyright © 2011 SciRes. http://www.scirp.org/journal/AS/Openly accessible at 405405 Ecological Modelling, 209, 277-300. doi: 10.1016/j.ecolmodel.2007.06.032 [10] Flerchinger, G.N. and Saxton, K.E. (1989) Simultaneous heat and water model of a freezing snow-residue-soil system. I. Theory and development. Transactions of the American Society of Agricultural Engineers, 32, 565- 571. [11] Flerchinger, G.N. (2000) The simultaneous heat and wa- ter (SHAW) Model: Technical documentation. Northwest Watershed Research Center, USDA Agricultural Research Service, Boise. http://afrsweb.usda.gov/SP2UserFiles/Place/53620000/S hawDocumentation.pdf [12] Šimůnek, J., Sejna, M., Saito, H., Sakai, M. and Genuch- ten, M.T.V. (2009) The HYDRUS-1D software package for simulating the one-dimensional movement of water, heat, and multiple solutes in variably-saturated media. PC Progress, Prague. http://www.pc-progress.com/en/Default.aspx?h1d-downl oads [13] Nkemdirim, L.C. (1996) Canada’s chinook belt. Inter- national Journal of Climatology, 16, 441-462. doi:10.1002/(SICI)1097-0088(199604)16:4<441::AID-J OC21>3.0.CO;2-T [14] Nkemdirim, L.C. (1991) Chinooks and winter evapora- tion. Theoretical and Applied Climatology, 43, 129-136. doi: 10.1007/BF00867470 [15] Hurrell, J.W. (1996) Influence of variations in extra- tropical wintertime teleconnections on northern hemis- phere temperature. Geophysical Research Letters, 23, 665-668. doi: 10.1029/96GL00459 [16] Bonsal, B.R., Prowse, T.D., Duguay, C.R. and Lacroix, M. P. (2006) Impacts of large-scale teleconnections on freshwater-ice break/freeze-up dates over Canada. Jour- nal of Hydrology, 330, 340-353. doi:10.1016/j.jhydrol.2006.03.022 [17] Smith, N.V., Saatchi, S.S. and Randerson, J.T. (2004) Trends in high northern latitude soil freeze thaw cycles from 1988 to 2002. Journal of Geophysical Research, 109, 1-14. doi:10.1029/2003/2003JD004472 [18] Baker, D.G. and Ruschy, D.L. (1995). Calculated and measured air and soil freeze thaw frequencies. Journal of Applied Meteorology, 34, 2197-2205. doi:10.1175/1520-0450(1995)034<2197:CAMAAS>2.0. CO;2 [19] Henry, H.A.L. (2007) Soil freeze-thaw cycle experiments: Trends, methodological weaknesses and suggested im- provements. Soil Biology and Biochemistry, 39, 977-986. doi: 10.1016/j.soilbio.2006.11.017 [20] Groffman, P.M., Driscoll, C.T., Fahey, T.J., Hardy, J.P., Fitzhugh, R.D. and Tierney, G.L. (2001) Colder soils in a warmer world: A snow manipulation study in a northern hardwood forest ecosystem. Biogeochemistry, 56, 135- 150. doi:10.1023/A:1013039830323
|