Energy and Power En gi neering, 2011, 3, 593-599
doi:10.4236/epe.2011.35074 Published Online November 2011 (http://www.SciRP.org/journal/epe)
Copyright © 2011 SciRes. EPE
An Investigation into Substation Grounding and Its
Implementation on Gaza Substation
Ahmed Hammuda1, Hassan Nouri1, Mohammed Saleh Al-Ayoubi2
1Department of Engineering Design and Mathematics, University of the West of England, Bristol, United Kingdom
2Faculty of Mechanical & Electrical Engineering, University of Damascus, Damascus, Syria
E-mail: ahmedhammuda@hotmail.com, Hassan.Nouri@uwe.ac.uk, ayoubi.msaleh@gmail.com
Recieved October 2, 2011; revised November 10, 2011; accepted November 18, 2011
Abstract
An investigation into the optimal design of a substation grounding system for the transmission substation in
Gaza City, Palestine has been carried out. A research into the most influential parameters on the effective-
ness of the substation grid system has been performed and its results have been incorporated into the Gaza
case study. Through modelling and simulating the power station in Gaza while considering some field data,
an optimal substation grounding grid has been designed and has shown complete conformance to safety. It is
thus considered that such a design will protect personnel in any area of the substation in addition to the in-
stalled machinery if the largest possible fault current was to traverse the earth.
Keywords: Gaza, Grounding Grid, Ground Resistance, Substation, Step Voltage, Touch Voltage
1. Introduction
Grounding is by far one of the most imperative aspects
of electrical systems design the significance of which has
attained modest mention. The design of the substation is
complex and constitutes a copious number of interlinked
factors that all need taking into account. A substation
grounding system is an underground, regular mesh con-
ductor network that serves the purpose of providing the
path of least resistance to the traversing current so that in
the case of a fault it is distributed in all directions of the
underlying earth. If efficient, the resulting ground poten-
tial due to a fault and the ensuing touch and step voltages
will be low enough to guarantee the safety of personnel
working on the substation in addition to safety of the
installed machinery.
This paper research investigates the effects of altering
certain parameters on the effectiveness of the grounding
system, focusing on the most relevant parameters before
applying the findings of the investigation on the substa-
tion of the Gaza Power Generating Company in Gaza
City, Palestine. The selection of this case study is due to
the intrinsic characteristics of the substation earth being
sandy and in close proximity to the sea, and for this rea-
son, at least the accessible top layers will be of consid-
erably high resistivity. Additionally, the power station
being the only one locally generating power exhibits a
substantial fault current in such a case. The substantial
necessity to protect the personnel and the dependable
machinery stipulates the design of a completely trust-
worthy and effective grounding system exhibiting touch
and step voltages within tolerable margins.
Seeing as the ground resistance
g
R is a major deter-
minant of the system safety, it becomes of interest to
study parameters that aid in reducing this quantity. It
should be noted that a low ground resistance does not
necessitate an even distribution of surface potentials
across the grid thus it becomes necessary to study some
parameters that help to regulate surface voltages. For this
parametric analysis and for the corresponding design
pertaining to Gaza substation, the grounding grid analy-
sis module in ETAP is utilised. While to determine the
fault current that can potentially be available at Gaza
power station, PSCAD is used.
2. Ground Potential Rise, Touch Voltage and
Step Voltage
2.1. Ground Potential Rise
The ground potential rise (GPR) is the product of the
ground resistance
g
R which is a function of the number
of grid conductors, its area, its depth and the resistivity
of the surrounding soil multiplied by the current G
I
entering the grid during a fault [1].
A. HAMMUDA ET AL.
594
e
q
2.2. Touch Voltage and Step Voltage
At the instant of a fault, the potentials that occur at the
surface of the earth are such that voltage “spikes” appear
above the grid conductors while depressions occur above
the mesh areas. At typical operational frequencies, this
potential distribution is relatively equal regardless of the
point of current injection [2].
The touch voltage results from a person making con-
tact with a grounded piece of equipment which resem-
bles the GPR while standing on any point on the substa-
tions surface. Thus the touch voltage becomes
T
VGPRV (1)
where e is the voltage at the point where the person is
standing. Clearly, where is lowest the touch voltage
is greatest [3].
V
e
V
The step voltage is then simply the difference of po-
tential occurring between two points on the surface of the
earth, 1m apart. If “p” and “q” are the locations where a
mans feet touch the earth surface, the step voltage be-
comes
Sp
VVV (2)
Both phenomena can be diagrammatically as in Fig-
ure 1.
In the general case, the human can tolerate a greater
step voltage than the touch voltage seeing as in the for-
mer case, a given tolerable current level b
I
will traverse
from one foot to the other each with resistance
f
R, en-
countering the body resistance, all in series (Figure 2)
while in the touch voltage case the current will traverse a
body resistance in series with two parallel foot resis-
tances (Figure 3) [4].
Earth surface
Grid section
Earth
surface
voltage
I
f
V
s
Vt
Figure 1. Diagrammatic representation of the step voltage
and the touch voltage appearing on the substation earth
during a fault.
Figure 2. Touch voltage and body resistance, adapted from
[4].
Figure 3. Step voltage and body resistance, adapted from
[4].
3. Comparing Simulation with Calculation
For the purpose of adding validity to the results of the
parametric analysis in the forthcoming section, where
possible, the curves obtained through ETAP simulation
will be shown alongside those calculated utilising the
accepted expression for
g
R derived by Sverak [5],
11 1
() 1
20 20
1
gT
Rh LAhA


 



(3)
where
is the soil resistivity in m, T is the total
length of all of the conductors combined, h is the depth
of the grid and A is its area. Simulations not involving
ground rods will be carried out using the Finite Element
(FEM) functionality in ETAP as oppose to the IEEE
method.
L
Copyright © 2011 SciRes. EPE
A. HAMMUDA ET AL.595
4. Grounding Grid Performance Results and
Analysis
4.1. The Ground Resistance against the Area
Bounded by the Grid
The first consideration after conducting any thorough
field study is the area of the substation in which the
grounding system is to be installed. It can be seen in
Figure 4 that increasing grid size is one of the most fun-
damental and effective factors in reducing the ground
resistance.
Since most substations are well above 2000 m2, it is
clear that the entire area of the substation should be cov-
ered by the grid to ensure the lowest possible resistance
(1 or less). The results were obtained for a grid at a
depth of 0.5 m in soil of resistivity 100 m with a con-
stant mesh size of 25 m2.
The other advantage of such design is to ensure that
the substation work area is not built over the grid pe-
rimeter where the step voltage and touch voltages are
greatest due to the abrupt change in surface potential.
4.2. The Ground Resistance against the
Conductor Length
The typical relationship between the two variables, c
and
L
g
R is most appropriately shown on a logarithmic
scale to demonstrate the “saturation” effect that occurs
when the length of the conductor is minimal. This effect
is the result of interaction between the neighbouring grid
conductors, such that as the conductors tend towards one
another, the mutual interaction begins to limit the amount
of current that can be ejected thus increasing saturation
(Figure 5). The results were obtained for a grid of size
3600 m2 at a depth of 0.5 m in soil of resistivity 100 m.
It can be said that the reduction in the conductor
length or the increase in the number of meshes along one
0
1
2
3
4
5
6
7
05000 10000
Grid size (metres squared)
Calculated
Simulated
Ground resistance (Ohms)
Figure 4. The variation of the ground resistance with re-
spect to the area occupied the grid.
Ground resistance
(
Ohms
)
0
0.2
0.4
0.6
0.8
1
1.2
1.4
1.6
1.8
110 100
Conductor length (m)
Calculated
Simula te d
Figure 5. The variation of the ground resistance with re-
spect to the grid conductor length (mesh size).
side of the grid has limited effect in reducing the ground
resistance beyond a certain number of meshes. For this
reason, this particular enhancement can be optimized.
4.3. The Ground Resistance against the Soil
Resistivity
Quite understandably, the relationship between the soil
resistivity and the ground resistance is linear for the
simulated curve using the FEM method and likewise
through calculation as
is the external multiplying
term in Sverak’s ground resistance calculation formula as
can be seen from Figure 6.
It can be seen from Figure that for low resistivities, an
increase from 100 m to 200 m will result in a two
fold increase in
g
R. The results pertain to a 2500 m2
grid with meshes of 25 m2 at a depth of 0.5 m modelled
in single layered soil.
4.4. The Ground Resistance against the Inclusion
of Rods
An enhancement that shows remarkable decrease in
0
2
4
6
8
10
12
05001000 1500
Soil resistivity (ohm-m)
Ground resistance (ohms
)
Calculated
Simulated
Ground resistance (Ohms)
Soil resistivity (Ohm-m)
Figure 6. The variation of the ground resistance with re-
spect to the soil resistivity surrounding the grid.
Copyright © 2011 SciRes. EPE
A. HAMMUDA ET AL.
596
grounding resistance when a two soil model is used, yet
small decrease in
g
R when a homogenous soil model is
used is the inclusion of ground rods bound to the grid.
The two layer soil model is a more accurate model that
more closely resembles the practical situation of the
earth beneath the substation. This assumes that the soil is
split into two layers, one above the other, each with its
own resistivity value. This model is characterized by the
reflection factor K defined by
21
21
K
(4)
where 1
is the upper soil resistivity and 2
is the
lower soil resistivity [6]. The more the reflective factor
tends towards –1 or 1 the greater the respective differ-
ence in resistivity between the two layers. A reflective
factor of 0 denotes that the soil is uniform as was the
assumption for the previous analysis. If the lower soil
resistivity is much lower than the upper soil resistivity
the value of K will tend towards –1 and vice versa.
Figure 7 shows the effect of adding 8 m rods to a grid
of size 2500 m2 when the reflection factor is 0 (1000 m
homogeneous soil) and –0.8 where the 1000 m upper
soil extends to a depth of 5 m before the presence of the
lower soil of resistivity 100 m. The mesh size in either
case is 25 m2 and the rod diameter is 2 cm.
It can be seen from Figure 7 that rods are only greatly
effective if they penetrate the lower resistivity soil layers,
reducing
g
R by a factor of 0.5 following the inclusion
of 10 rods in the above situation. Therefore the feasibil-
ity of their addition is determined by the studied soil
model in concern and is constrained by their length.
4.5. Touch and Step Potentials against the
Length of the Grid Conductor
Increasing the number of meshes, or equally reducing the
length of the grid conductors will significantly draw nea-
rer the difference of surface potential between any two
points on the grid (Figure 8).
This has the effect of reducing the difference between
two points on the earth’s surface, thus the step potential
and will draw nearer the value of the surface potential to
the GPR thus reduce the touch voltage as shown graphi-
cally in Figure 8.
The grid occupies an area of 3600 m2 and resides in
the soil of resistivity 100 m at a depth of 0.5 m. The
meshes are square thus 60 m is the extreme 1 mesh sce-
nario showing the greatest touch and step voltages as
anticipated. Seemingly the effect of mesh size reduction
on the touch voltage is greater. This is confirmed by the
numerical results where it is found that the drop in the
touch voltage between the greatest mesh size and the
0
2
4
6
8
10
12
010203040
Number of rods in grid area
Ground resistance (ohms
)
K = 0
K = -0.8
Ground resistance (Ohms)
Figure 7. A graph showing the relationship between the
grounding resistance against the number of ground rods in
two layer soil.
0
200
400
600
800
1000
1200
1400
020406
Conductor length (m)
Voltage (v
0
)
To u ch
Step
Voltage (V)
Figure 8. The touch and step voltages against the conductor
length (number of meshes).
smallest is 82.5% while that of the step voltage is 57.1%.
4.6. Surface Layer Incorporation against the
Tolerable Touch (T-tol) and Step Voltages
(S-tol)
The significant effect of adding a surface layer for the
purpose of increasing the series resistance of the person-
nel hence raising tolerable voltage levels [7] is not em-
phasised enough. Figure 9 shows the results obtained
through incorporating a 1000 m and a 5000 m (typi-
cal for pea gravel) surface layer. The grid is 2500 m2
with 25 m2 meshes and the soil is of 100 m resistivity.
It can be seen that the incorporation of a 2000 sur-
face layer as thick as just 5 cm can improve the tolerable
touch voltage significantly, precisely by 130.5% while
increasing the tolerable step voltage by 374.9%. It is
Copyright © 2011 SciRes. EPE
A. HAMMUDA ET AL.597
0
500
1000
1500
2000
2500
00.05 0.10.15
Resistive layer thickness (m)
1000 ohm TTouch
1000 ohm TStep
2000 ohm TTouch
2000 ohm TStep
Tolerable voltage (V)
1000 Ohm T-tol
1000 Ohm S-tol
2000 Ohm T-tol
2000 Ohm S-tol
Figure 9. The resistive layer thickness against tolerable vol-
tages.
noted that surface layers of much higher resistivity are
widely available. This cost effective approach can con-
siderably increase the safety of the system while avoid-
ing excessive structural improvements. This technique
was employed for improving the Gaza grounding system
after reaching the “saturation” of structural improve-
ments as will be shown in the succeeding section.
5. Modeling the Gaza Study
5.1. Substation Field Study
Following consultation with the management of the Gaza
Power Generating Company (GPGC) [8] it was found
that the substation occupies an area of 24267 m2 (204 m
× 119 m). The substation is approximately 7.5 km from
the Mediterranean shoreline and built above a region of
dry sandstone [9] almost 7 m above sea level [10]. Dry
sandstone can resemble a resistivity as high as 1000 m.
It is suggested that the earth at depths below 7 m will be
both rich in moisture and will possess a high salt content
due to sea water intrusion. According to the curves shown
in [6] this can reduce the resistivity up to 100 fold due to
the electrolytic nature of water and salt thus the resistive-
ity for the second sandstone layer below a 7 m depth is
modelled at 10 m.
5.2. Generating Station Model for Fault
Determination
Further consultation with the management of the (GPGC)
[8], it was found that the power station constitutes 4 ma-
jor generators. Generators 1 and 2 can potentially pro-
duce a power output of 30.470 MW and have a MVA
rating of 35.847 MVA. They develop a voltage of 11 kV
and are connected to separate transformers. The trans-
formers step up the generating voltage at the substation
to 66 kV and are both rated at 31 MVA. The reactance of
generators 1 and 2 are arbitrarily assumed to be 0.7 .
The generators 3 and 4 can potentially produce a power
output of 59.3 MW, are rated at 67.764 MVA and de-
velop a voltage of 11 kV. Generators 3 and 4 are arbi-
trarily assumed to have a reactance of 0.5 . They are
connected to a bus coupled with two parallel connected
transformers rated at 62.5 MVA each stepping up the
voltage to 66 kV. It is assumed that a fault occurs at the
transmission bus coupled with the aforementioned trans-
formers and that the fault is of three phase to ground na-
ture as shown in the PSCAD model of Figure 10.
5.3. Simulating the Three Phase Fault
The phases are faulted after 0.5 s of normal operation
assumingly lasting a period of 0.5 s. The resultant wave-
form is shown in Figure 11, attaining a peak of 15.46 kA
before settling at a magnitude of 6.05 kA. Closer evalua-
tion of the resultant waveform yielded a DC component
attenuation time constant of 2 s.
This time constant
a
T and the fault period
f
t
can be placed into the formulation for the “decrement
factor”
f
D [7] and multiplied by the symmetrical cur-
rent
f
I to obtain the symmetrical fault current equiva-
lent over the 0.5 s period where
2
11
f
a
t
T
a
ff
T
Dt

 

(5)
yielding a decrement factor of 1.6. The symmetrical fault
current “IF”, over the initial period of 0.5 s, has a value of
ABC > G
Figure 10. Figure 8 PSCAD model of Gaza power station
with a connected 3 phase to ground fault logic component.
Copyright © 2011 SciRes. EPE
A. HAMMUDA ET AL.
598
Figure 11. Three phase fault current waveform produced
by Gaza power station.
6.05 kA × 1.6 = 9.68 kA. Finally, and assuming the cur-
rent that traverses the grid is 80% of the fault, guided by
the curves deduced by Garett et al. [11] and allowing for
the worst case scenario, the “split factor”, and
the grid current .
0.8
f
S
6.05 kA1.60.8
G
I
5.4. Initial Design and Tolerable Voltages
The conductor length is commonly in the region of 5 - 10
m depending on the area of the substation. If the con-
ductor length is 8.5 m for a square mesh, 24 and 14
meshes can be placed in the x and y direction respec-
tively.
The grid contains 710 copper conductors and resides
in a soil of resistivity 1000 m. The tolerable touch
@Ttol
and tolerable step @Stol
voltages for this par-
ticular situation are 1554.2 V and 555.1 V respectively
for an average 70 kg individual. The objective of the
system is to develop voltages below these limits.
V V
5.5. Initial Simulation
Following a 7.7 kA current injection, the resultant touch
and step voltages greatly exceed the permitted limits at
3360.4 V and 2319.8 V correspondingly. ETAP valued
g
R at 3.06 . The imperative task is thus to reduce the
touch voltage, and on regulating this, it is expected that
the step voltage will also adhere to safety.
5.6. Improvement of Design by Rod
Incorporation
As aforementioned, a two layer soil structure with a
negative K factor can be harnessed to the advantage of
the engineer by incorporating resistance reducing rods.
Figure 12 shows this effect and demonstrates how the
inclusion of 8 m penetrating rods has caused the ground
resistance to fall to a value well below 0.5 a very sat-
isfactory decrease of 83.7%.
Adding more than 150 rods is unfeasible in terms of
reducing the grounding resistance. The curve reaches
almost a horizontal gradient and any further addition of
0
0.5
1
1.5
2
2.5
3
050100 150
Number of rods in grid area
Ground resistance (Ohms)
Figure 12. Adding resistance reducing rods to the initial
design.
rods will only affect the potential gradient rather than the
grounding resistance and the overall GPR of the system.
The new touch voltage after re-simulation has fallen
35.2% to 2179 V while the step voltage has dropped
18.4% to 1893.2 V. More enhancements are required to
meet the tolerable criteria.
5.7. Improvement of Design by Mesh Size
Reduction
Revisiting the previous section, it is seen than a reduc-
tion in mesh size promotes a respectable reduction in the
touch voltage. Decreasing the mesh size to 5.2 m5.2 m
resulting in 39 and 23 meshes in the x and y direction
correspondingly, the system can be re-simulated to yield
a further drop in the touch voltage of 30.2% (1520 V). It
is interesting to note that the new step voltage is 11.1%
greater at 2105.2 V. The increase in the step voltage is an
exceptional case and has occurred due to the fact that the
grid potential has been raised with respect to the area at
the immediate vicinity of the grid. It is suggested that
this exceptional case occurs when the grounding resis-
tance reaches a “saturated” low value that no longer falls
significantly when physical structural enhancements are
made to the grid. The result of this is that the GPR essen-
tially remains at its previous value. The decrease in touch
voltage then occurs due to raised surface potentials.
5.8. Incorporation of a High Resistivity Surface
Layer
It is forecasted that further physical improvement to the
metallic grounding structure is uneconomical, thus the
system’s solid structure is ready to incorporate a layer of
high resistive surface material to raise tolerable voltages.
Adding a surface layer of pea gravel of depth 0.15 m
and resistivity 5000 m according to [7] and as valued
by ETAP produces new results showing full confor-
mance to safety for both the touch and step voltages.
This adjustment shows a remarkable increase in the
Copyright © 2011 SciRes. EPE
A. HAMMUDA ET AL.
Copyright © 2011 SciRes. EPE
599
7. Acknowledgements touch and step tolerable voltages, 184.6% and 263.7%
correspondingly. The results are summarised in Table 1.
Dr Rafiq Maliha, the plant manager at the main power
station in Gaza, Palestine is acknowledged for supplying
useful information and for his correspondence in the
formation of the research.
6. Conclusions
A grounding system for the transmission substation in
Gaza City, Palestine has been designed and simulated
and is believed to safely dissipate the largest possible
fault current at the plant. The final design shows that the
resultant touch and step voltages are within tolerable
regions and no more enhancements are necessary. It was
found that in the study, the incorporation of ground rods
long enough to penetrate the moist soil layers deemed
reachable at depths beyond 7 m decreases the overall
grounding resistance by above 80%. The touch and step
voltages are reduced by 35% and 18% correspondingly.
8. References
[1] IEEE, “IEEE Recommended Practice for Determining the
Electric Power Station Ground Potential Rise and In-
duced Voltage From a Power Fault,” IEEE Std 367-1996,
1996, pp. 1-125.
[2] J. Ma and F. P. Dawalibi, “Modern Computational Meth-
ods for the Design and Analysis of Power System Ground-
ing,” Proceedings of International Conference on Power
System Technology, Beijing, Vol. 1, 18-21 August 1998,
pp. 122-126.
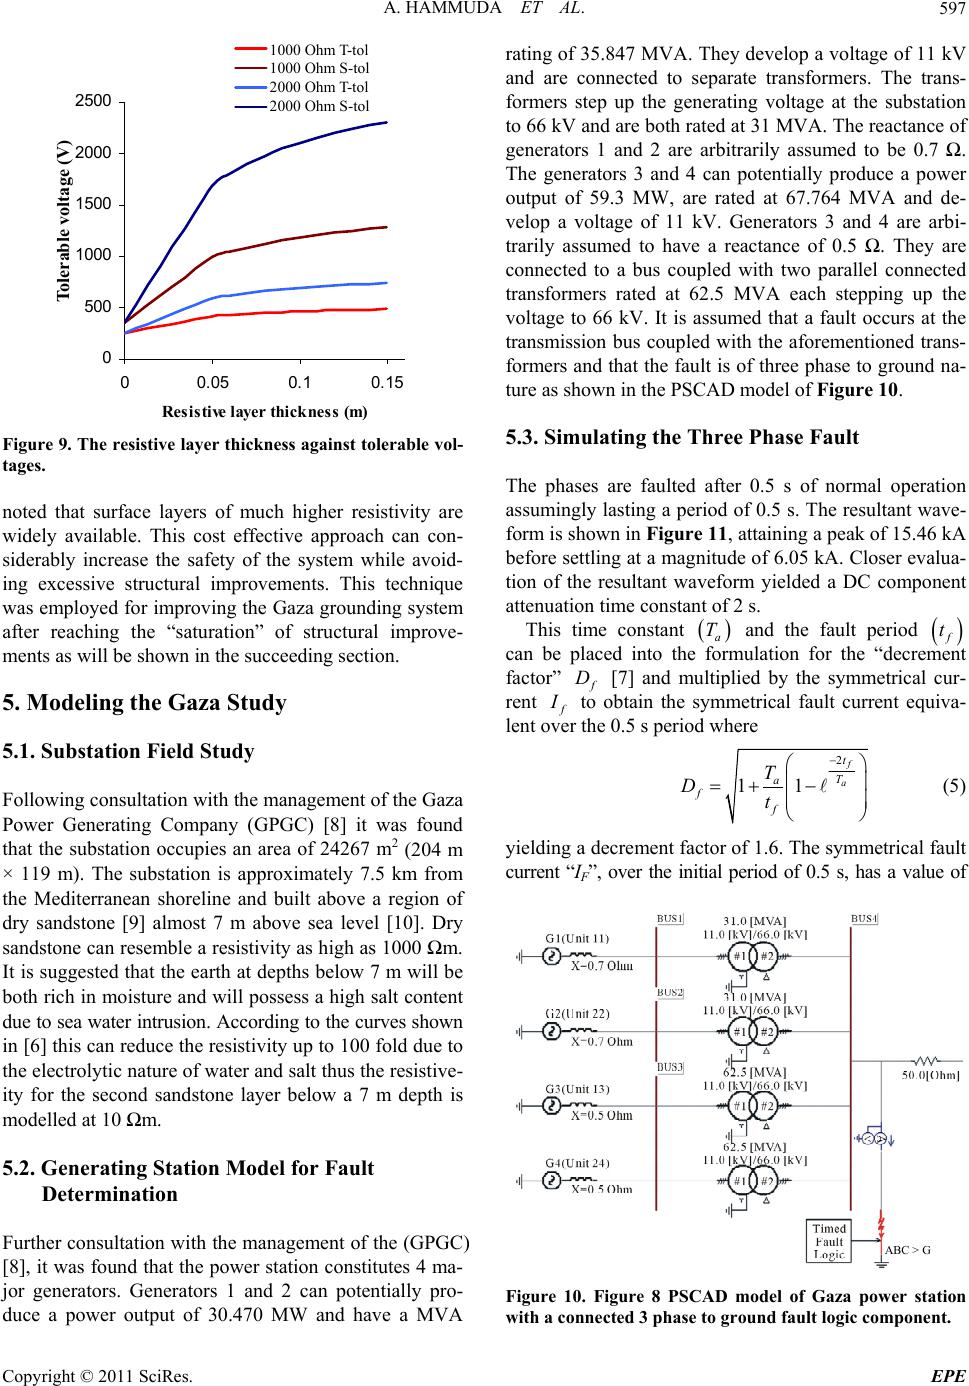
Further structural improvements for the purpose of
reducing the touch voltage included the reduction of the
mesh size before the incorporation of a pea gravel sur-
face layer of depth 0.15 m and of resistivity 5000 m.
This adjustment remarkably increased the touch and step
tolerable voltages to 184.6% and 263.7% respectively
and formed the adequate grounding system for the Gaza
study. It also establishes the importance of including a
high resistivity surface layer if it is found that the touch
and step voltages are beyond acceptable while further
structural improvements in the grid are unfeasible. In this
particular case its inclusion is indispensable.
[3] S. Ghoneim, H. Hirsch, A. Elmorshey and R. Amer, “Sur-
face Potential Calculation for Grounding Grids,” IEEE
Power and Energy Conference, Jaya, 28-29 November
2006, pp. 501-505. doi:10.1109/PECON.2006.346703
[4] IEEE, “IEEE Recommended Practice for Industrial and
Commercial Power System Analysis,” IEEE Std 399-1997,
1997, pp. 1-483.
[5] J. G. Sverak, “Simplified Analysis of Electrical Gradients
above a Ground Grid, Part I: How Good Is the Present
IEEE Method?” IEEE Power Engineering Review, Vol.
PER-4, No.1, 1984, pp. 26-27.
doi:10.1109/MPER.1984.5525426
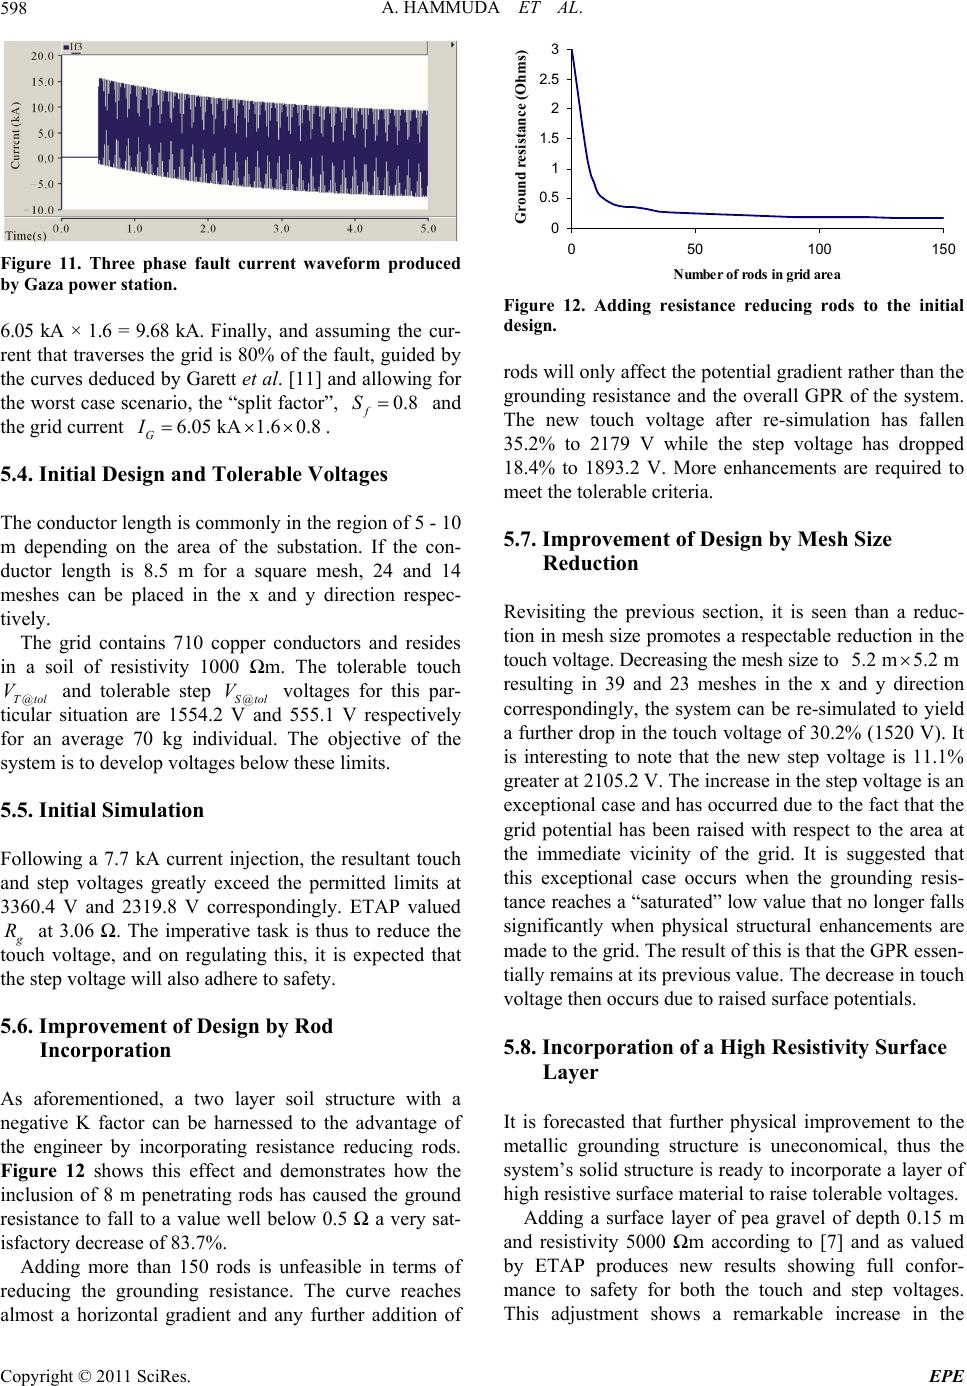
The performed parametric analysis and research estab-
lishes that the most effectual grid improvement factor is
its area being inversely proportional to the grounding re-
sistance. This is followed by the soil resistivity being
directly proportional. Other design modifications are use-
ful in obtaining specific results. Rods are only effective
in two layer soils of negative K coefficient when they are
long enough to penetrate the lower soil. Reducing the
mesh size is an admirable touch voltage reducing factor
and when accompanied by a reduction in the overall
ground resistance assists in reducing the step voltage.
[6] F. Dawalibi and D. Mukhedkar, “Parametric Analysis of
Grounding Grids,” IEEE Transactions on Power Appa-
ratus and Systems, Vol. PAS-98, No. 5, 1979, pp. 1659-
1668. doi:10.1109/TPAS.1979.319484
[7] IEEE, “IEEE Guide for Safety in AC Substation Ground-
ing,” IEEE Std 80-2000, 2000, pp. 1-192.
[8] R. Maliha, “Gaza Power Station Management,”
(rmaliha@gpgc.ps). Part of Gaza power station grounding
project at UWE, 2010. (ahmedhammuda@hotmail.com)
[9] H. Baalousha, “Analysis of Nitrate Occurrence and Dis-
tribution in Groundwater in the Gaza Strip Using Major
Ion Chemistry,” Global NEST Journal, Vol. 10, No. 3,
2008, pp. 337-349.
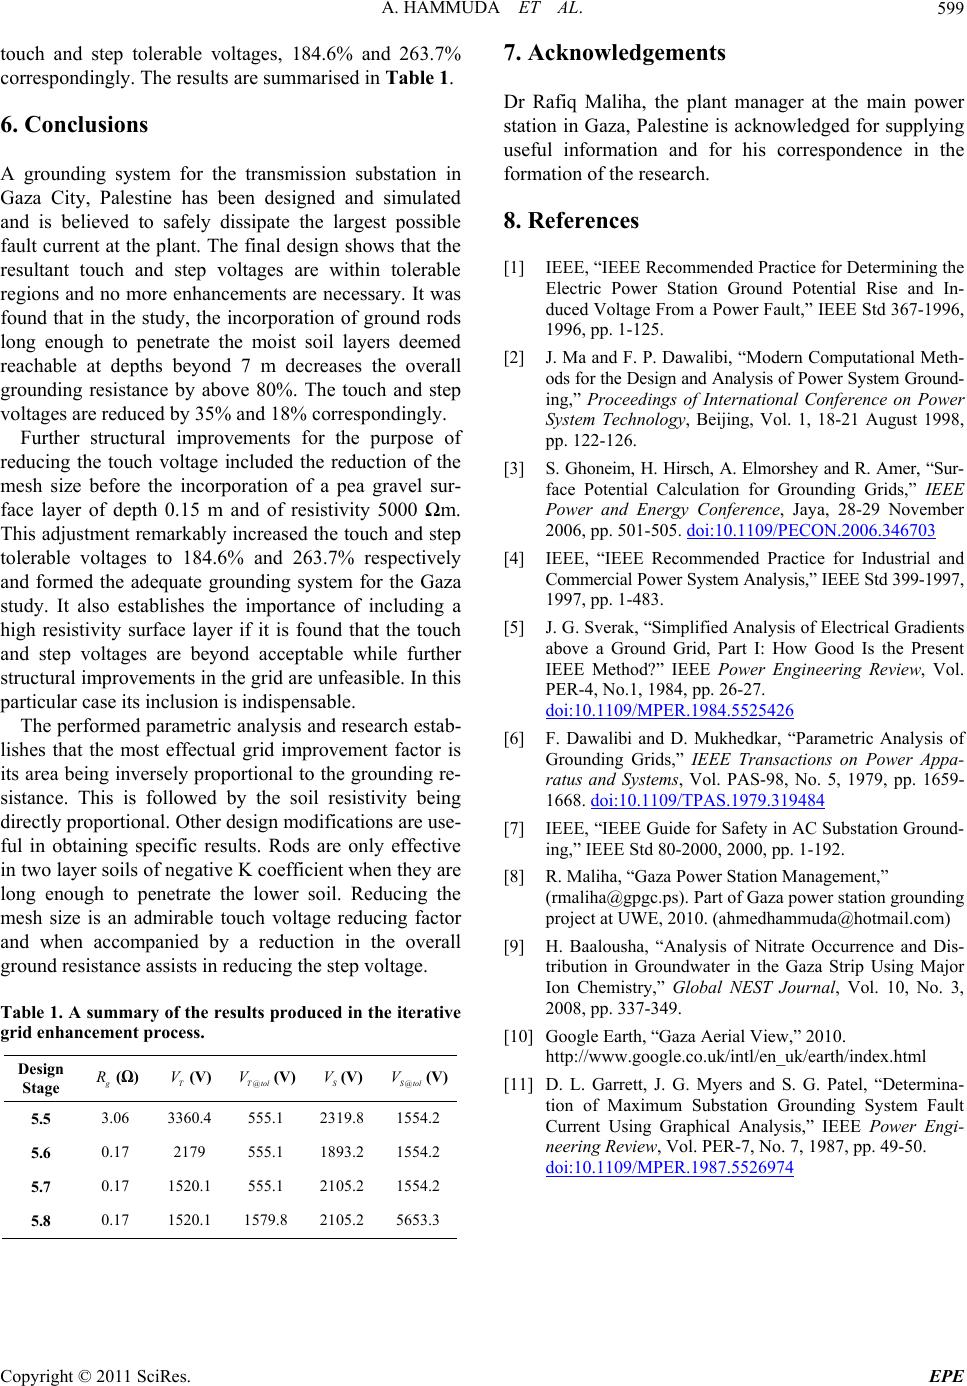
Table 1. A summary of the results produced in the iterative
grid enhancement process. [10] Google Earth, “Gaza Aerial View,” 2010.
http://www.google.co.uk/intl/en_uk/earth/index.html
Design
Stage
g
R
() T
V(V) @Ttol
V(V) S
V(V) @Stol
V(V)
5.5 3.06 3360.4 555.1 2319.8 1554.2
5.6 0.17 2179 555.1 1893.2 1554.2
5.7 0.17 1520.1 555.1 2105.2 1554.2
5.8 0.17 1520.1 1579.8 2105.2 5653.3
[11] D. L. Garrett, J. G. Myers and S. G. Patel, “Determina-
tion of Maximum Substation Grounding System Fault
Current Using Graphical Analysis,” IEEE Power Engi-
neering Revie w, Vol. PER-7, No. 7, 1987, pp. 49-50.
doi:10.1109/MPER.1987.5526974