 Energy and Power En gi neering, 2011, 3, 630-640 doi:10.4236/epe.2011.35079 Published Online November 2011 (http://www.SciRP.org/journal/epe) Copyright © 2011 SciRes. EPE A Comparative Study of the Economic Feasibility of Employing CHP Systems in Different Industrial Manufacturing Applications Chad A. Wheeley, Pedro J. Mago, Rogelio Luck Department of Mechanical Engineering, Mississippi St at e Uni versi t y, Oktibbeha County, USA E-mail: wheeley@me.msstate.edu Recieved August 26, 2011; revised September 29, 2011; accepted October 5, 2011 Abstract Extensive research work including multiple methodologies and numerous simulations have been completed in order to determine the economic effectiveness of employing CHP at commercial and residential sites. In contrast to the above, very few attempts have been made to develop methodologies to study the feasibility of CHP systems at industrial manufacturing facilities. As a result, practical opportunities for CHP at industrial sites are often not realized or even investigated. It follows that there is a need in the CHP related literature for an analysis that is explicit and yet general enough to determine the economic viability and potential for success of CHP systems at industrial manufacturing facilities. Therefore, the purpose of this paper is to clearly outline a methodology to determine the economic effectiveness of installation and operation of a CHP system at industrial facilities that have a need for space or process heating in the form of steam. The effect on the CHP system economic performance of several parameters, such as the project payback, internal rate of return, net present value, etc., are considered in the proposed methodology. The applicability and generality of the methodology is illustrated by examples including four different manufacturing facilities. The effects of the variability of factors such as annual facility operational hours during which both process heat and elec- tricity are needed, facility average hourly thermal load, cost of utility supplied electricity, and CHP fuel type and associated fuel cost, on the outcome of the economic analysis are also examined. Keywords: CHP Systems, CHP for Industrial Manufacturing Facilities, Economic Feasibility Study 1. Introduction When considering a base-load combined heat and power (CHP) system for an industrial manufacturing facility, a number of different parameters must be examined and addressed before one can determine its estimated eco- nomic viability and potential for success. The most widely accepted parameter that is used to estimate the feasibility of any proposed CHP project is known as spark spread, which is essentially the difference in the cost of utility supplied electricity and the fuel cost asso- ciated with production of electricity on site [1]. A spark spread of $12/MMBtu ($0.041/kWh) is typically consid- ered to be the threshold that is representative of an eco- nomically attractive CHP project, meaning that projects that exhibit spark spreads in excess of $12/MMBtu ($0.041/kWh) will have a good potential for low payback periods and overall economic success [1]. Graves et al. [2] developed a more sophisticated method that incorpo- rates generator heat rate, thermal recovery efficiency, equipment cost, and acceptable payback period, allowing for a more accurate indication of CHP viability. In a similar manner, Smith et al. [3] developed a detailed model, based on the spark spread, which compares the electrical energy and heat energy produced by a CHP system against equivalent amounts of energy produced by a traditional, or separate heating and power (SHP), system. In addition, they introduced an expression for the spark spread based on the cost of the fuel and some of the CHP system efficiencies as well as an expression for the payback period for a given capital cost and spark spread. However, for industrial manufacturing facilities, in addition to the spark spread, there are other factors that must be considered when analyzing the economic feasibility of a CHP system, such as the type of prime mover, the fuel availability and cost, operation hours, among others. Typically prime movers used in manufac- turing facilities include, but are not limited to: steam 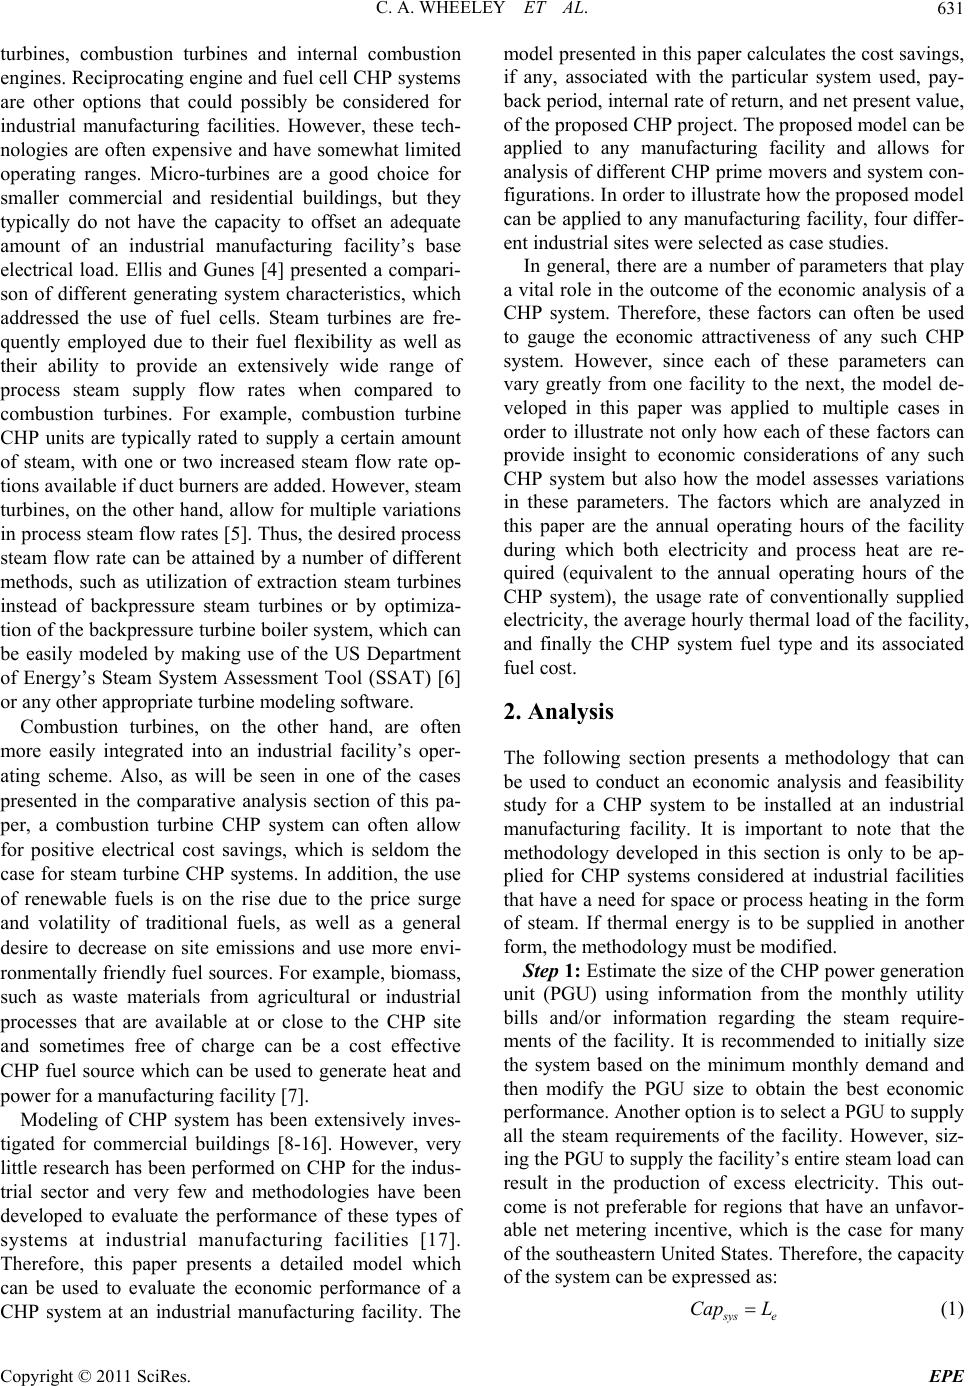 C. A. WHEELEY ET AL.631 turbines, combustion turbines and internal combustion engines. Reciprocating engine and fuel cell CHP systems are other options that could possibly be considered for industrial manufacturing facilities. However, these tech- nologies are often expensive and have somewhat limited operating ranges. Micro-turbines are a good choice for smaller commercial and residential buildings, but they typically do not have the capacity to offset an adequate amount of an industrial manufacturing facility’s base electrical load. Ellis and Gunes [4] presented a compari- son of different generating system characteristics, which addressed the use of fuel cells. Steam turbines are fre- quently employed due to their fuel flexibility as well as their ability to provide an extensively wide range of process steam supply flow rates when compared to combustion turbines. For example, combustion turbine CHP units are typically rated to supply a certain amount of steam, with one or two increased steam flow rate op- tions available if duct burners are added. However, steam turbines, on the other hand, allow for multiple variations in process steam flow rates [5]. Thus, the desired process steam flow rate can be attained by a number of different methods, such as utilization of extraction steam turbines instead of backpressure steam turbines or by optimiza- tion of the backpressure turbine boiler system, which can be easily modeled by making use of the US Department of Energy’s Steam System Assessment Tool (SSAT) [6] or any other appropriate turbine modeling software. Combustion turbines, on the other hand, are often more easily integrated into an industrial facility’s oper- ating scheme. Also, as will be seen in one of the cases presented in the comparative analysis section of this pa- per, a combustion turbine CHP system can often allow for positive electrical cost savings, which is seldom the case for steam turbine CHP systems. In addition, the use of renewable fuels is on the rise due to the price surge and volatility of traditional fuels, as well as a general desire to decrease on site emissions and use more envi- ronmentally friendly fuel sources. For example, biomass, such as waste materials from agricultural or industrial processes that are available at or close to the CHP site and sometimes free of charge can be a cost effective CHP fuel source which can be used to generate heat and power for a manufacturing facility [7]. Modeling of CHP system has been extensively inves- tigated for commercial buildings [8-16]. However, very little research has been performed on CHP for the indus- trial sector and very few and methodologies have been developed to evaluate the performance of these types of systems at industrial manufacturing facilities [17]. Therefore, this paper presents a detailed model which can be used to evaluate the economic performance of a CHP system at an industrial manufacturing facility. The model presented in this paper calculates the cost savings, if any, associated with the particular system used, pay- back period, internal rate of return, and net present value, of the proposed CHP project. The proposed model can be applied to any manufacturing facility and allows for analysis of different CHP prime movers and system con- figurations. In order to illustrate how the proposed model can be applied to any manufacturing facility, four differ- ent industrial sites were selected as case studies. In general, there are a number of parameters that play a vital role in the outcome of the economic analysis of a CHP system. Therefore, these factors can often be used to gauge the economic attractiveness of any such CHP system. However, since each of these parameters can vary greatly from one facility to the next, the model de- veloped in this paper was applied to multiple cases in order to illustrate not only how each of these factors can provide insight to economic considerations of any such CHP system but also how the model assesses variations in these parameters. The factors which are analyzed in this paper are the annual operating hours of the facility during which both electricity and process heat are re- quired (equivalent to the annual operating hours of the CHP system), the usage rate of conventionally supplied electricity, the average hourly thermal load of the facility, and finally the CHP system fuel type and its associated fuel cost. 2. Analysis The following section presents a methodology that can be used to conduct an economic analysis and feasibility study for a CHP system to be installed at an industrial manufacturing facility. It is important to note that the methodology developed in this section is only to be ap- plied for CHP systems considered at industrial facilities that have a need for space or process heating in the form of steam. If thermal energy is to be supplied in another form, the methodology must be modified. Step 1: Estimate the size of the CHP power generation unit (PGU) using information from the monthly utility bills and/or information regarding the steam require- ments of the facility. It is recommended to initially size the system based on the minimum monthly demand and then modify the PGU size to obtain the best economic performance. Another option is to select a PGU to supply all the steam requirements of the facility. However, siz- ing the PGU to supply the facility’s entire steam load can result in the production of excess electricity. This out- come is not preferable for regions that have an unfavor- able net metering incentive, which is the case for many of the southeastern United States. Therefore, the capacity of the system can be expressed as: ys e Cap L (1) Copyright © 2011 SciRes. EPE 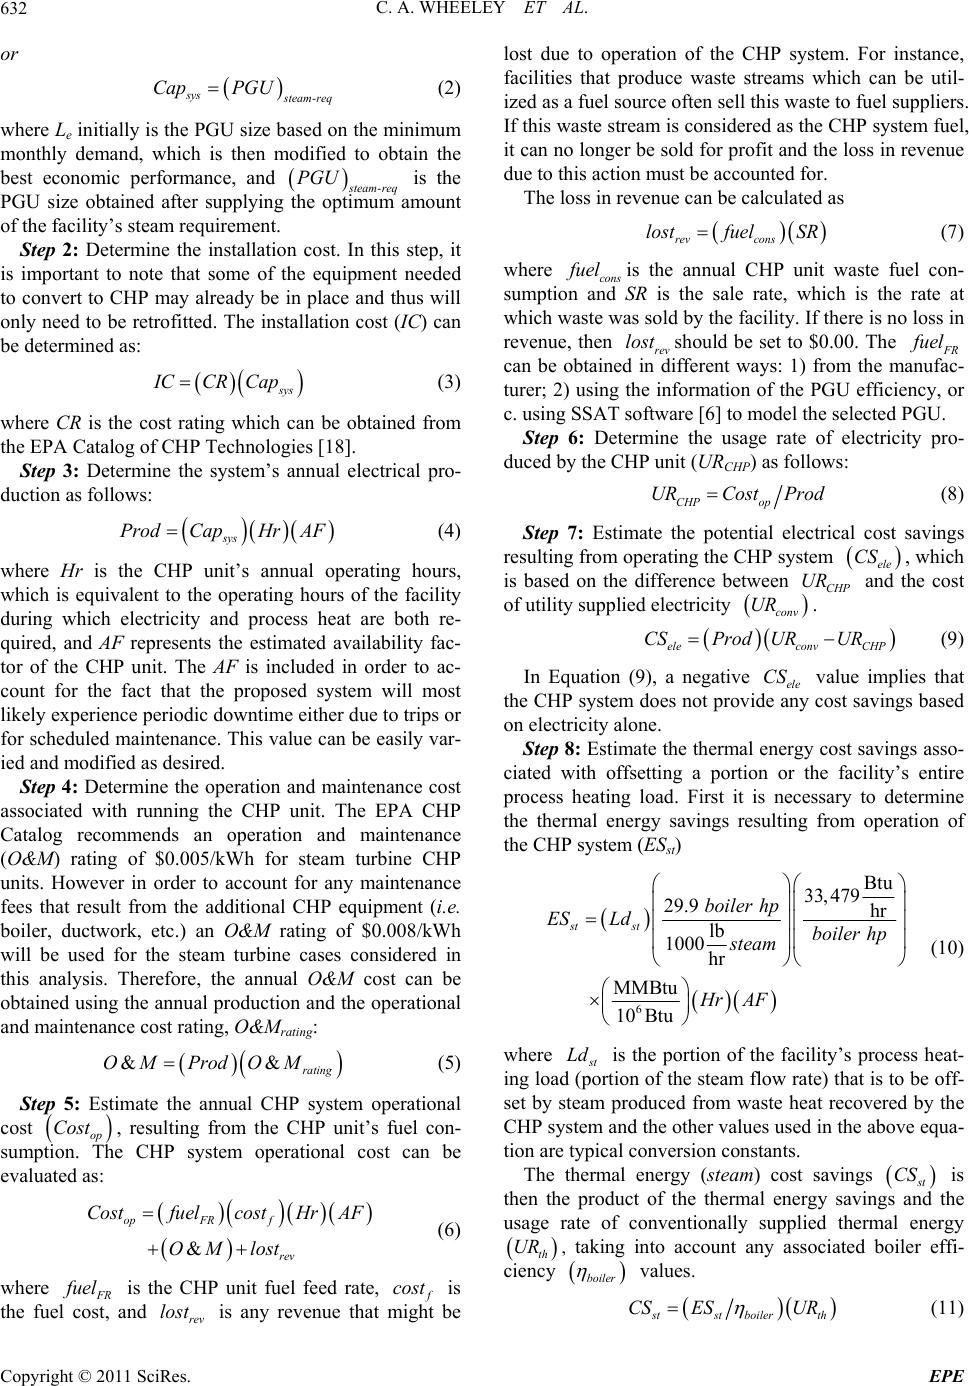 C. A. WHEELEY ET AL. 632 or - sys team req Cap PGU (2) where Le initially is the PGU size based on the minimum monthly demand, which is then modified to obtain the best economic performance, and - team req is the PGU size obtained after supplying the optimum amount of the facility’s steam requirement. PGU Step 2: Determine the installation cost. In this step, it is important to note that some of the equipment needed to convert to CHP may already be in place and thus will only need to be retrofitted. The installation cost (IC) can be determined as: ys CCRCap (3) where CR is the cost rating which can be obtained from the EPA Catalog of CHP Technologies [18]. Step 3: Determine the system’s annual electrical pro- duction as follows: sys rodCapHr AF (4) where Hr is the CHP unit’s annual operating hours, which is equivalent to the operating hours of the facility during which electricity and process heat are both re- quired, and AF represents the estimated availability fac- tor of the CHP unit. The AF is included in order to ac- count for the fact that the proposed system will most likely experience periodic downtime either due to trips or for scheduled maintenance. This value can be easily var- ied and modified as desired. Step 4: Determine the operation and maintenance cost associated with running the CHP unit. The EPA CHP Catalog recommends an operation and maintenance (O&M) rating of $0.005/kWh for steam turbine CHP units. However in order to account for any maintenance fees that result from the additional CHP equipment (i.e. boiler, ductwork, etc.) an O&M rating of $0.008/kWh will be used for the steam turbine cases considered in this analysis. Therefore, the annual O&M cost can be obtained using the annual production and the operational and maintenance cost rating, O&Mrating: && rating OM ProdOM (5) Step 5: Estimate the annual CHP system operational cost , resulting from the CHP unit’s fuel con- sumption. The CHP system operational cost can be evaluated as: op Cost & opFR f rev CostfuelcostHr AF OM lost (6) where R uel is the CHP unit fuel feed rate, cost is the fuel cost, and is any revenue that might be lost due to operation of the CHP system. For instance, facilities that produce waste streams which can be util- ized as a fuel source often sell this waste to fuel suppliers. If this waste stream is considered as the CHP system fuel, it can no longer be sold for profit and the loss in revenue due to this action must be accounted for. rev lost The loss in revenue can be calculated as rev cons lostfuel SR (7) where cons uel is the annual CHP unit waste fuel con- sumption and SR is the sale rate, which is the rate at which waste was sold by the facility. If there is no loss in revenue, then rev should be set to $0.00. The lost R uel can be obtained in different ways: 1) from the manufac- turer; 2) using the information of the PGU efficiency, or c. using SSAT software [6] to model the selected PGU. Step 6: Determine the usage rate of electricity pro- duced by the CHP unit (URCHP) as follows: CHP op URCost Prod (8) Step 7: Estimate the potential electrical cost savings resulting from operating the CHP system , which is based on the difference between and the cost of utility supplied electricity . ele CS P CH UR conv UR eleconv CHP CSProd URUR (9) In Equation (9), a negative ele value implies that the CHP system does not provide any cost savings based on electricity alone. CS Step 8: Estimate the thermal energy cost savings asso- ciated with offsetting a portion or the facility’s entire process heating load. First it is necessary to determine the thermal energy savings resulting from operation of the CHP system (ESst) 6 Btu 33,479 29.9 hr lb 1000 hr MMBtu 10 Btu st stboiler hp ES Ldboiler hp steam Hr AF (10) where t is the portion of the facility’s process heat- ing load (portion of the steam flow rate) that is to be off- set by steam produced from waste heat recovered by the CHP system and the other values used in the above equa- tion are typical conversion constants. Ld The thermal energy (steam) cost savings t CS is then the product of the thermal energy savings and the usage rate of conventionally supplied thermal energy th UR , taking into account any associated boiler effi- ciency boiler values. tst boilerth CS ESUR (11) Copyright © 2011 SciRes. EPE 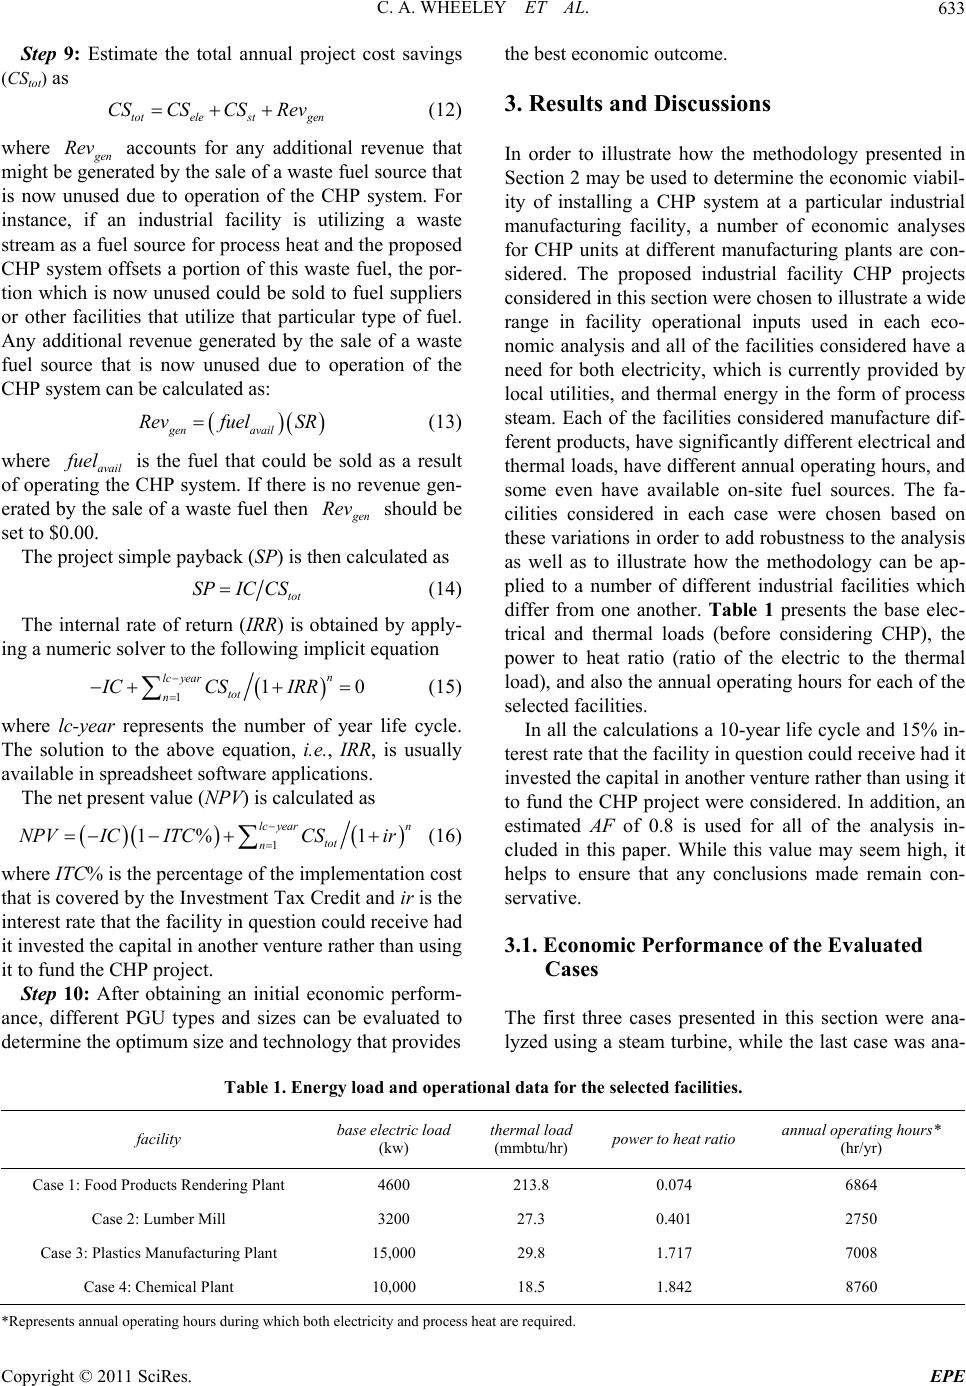 C. A. WHEELEY ET AL. Copyright © 2011 SciRes. EPE 633 Step 9: Estimate the total annual project cost savings (CStot) as the best economic outcome. 3. Results and Discussions totele stgen CSCSCS Rev (12) where en accounts for any additional revenue that might be generated by the sale of a waste fuel source that is now unused due to operation of the CHP system. For instance, if an industrial facility is utilizing a waste stream as a fuel source for process heat and the proposed CHP system offsets a portion of this waste fuel, the por- tion which is now unused could be sold to fuel suppliers or other facilities that utilize that particular type of fuel. Any additional revenue generated by the sale of a waste fuel source that is now unused due to operation of the CHP system can be calculated as: Rev In order to illustrate how the methodology presented in Section 2 may be used to determine the economic viabil- ity of installing a CHP system at a particular industrial manufacturing facility, a number of economic analyses for CHP units at different manufacturing plants are con- sidered. The proposed industrial facility CHP projects considered in this section were chosen to illustrate a wide range in facility operational inputs used in each eco- nomic analysis and all of the facilities considered have a need for both electricity, which is currently provided by local utilities, and thermal energy in the form of process steam. Each of the facilities considered manufacture dif- ferent products, have significantly different electrical and thermal loads, have different annual operating hours, and some even have available on-site fuel sources. The fa- cilities considered in each case were chosen based on these variations in order to add robustness to the analysis as well as to illustrate how the methodology can be ap- plied to a number of different industrial facilities which differ from one another. Table 1 presents the base elec- trical and thermal loads (before considering CHP), the power to heat ratio (ratio of the electric to the thermal load), and also the annual operating hours for each of the selected facilities. gen avail Revfuel SR (13) where avail uel is the fuel that could be sold as a result of operating the CHP system. If there is no revenue gen- erated by the sale of a waste fuel then en Rev should be set to $0.00. The project simple payback (SP) is then calculated as tot SPIC CS (14) The internal rate of return (IRR) is obtained by apply- ing a numeric solver to the following implicit equation 11 n lc year tot n ICCS IRR 0 (15) where lc-year represents the number of year life cycle. The solution to the above equation, i.e., IRR, is usually available in spreadsheet software applications. In all the calculations a 10-year life cycle and 15% in- terest rate that the facility in question could receive had it invested the capital in another venture rather than using it to fund the CHP project were considered. In addition, an estimated AF of 0.8 is used for all of the analysis in- cluded in this paper. While this value may seem high, it helps to ensure that any conclusions made remain con- servative. The net present value (NPV) is calculated as 1 1% 1 n lc year tot n NPV ICITCCSir (16) where ITC% is the percentage of the implementation cost that is covered by the Investment Tax Credit and ir is the interest rate that the facility in question could receive had it invested the capital in another venture rather than using it to fund the CHP project. 3.1. Economic Performance of the Evaluated Cases Step 10: After obtaining an initial economic perform- ance, different PGU types and sizes can be evaluated to determine the optimum size and technology that provides The first three cases presented in this section were ana- lyzed using a steam turbine, while the last case was ana- Table 1. Energy load and operational data for the selected facilities. facility base electric load (kw) thermal load (mmbtu/hr) power to heat rati o annual operating hours* (hr/yr) Case 1: Food Products Rendering Plant 4600 213.8 0.074 6864 Case 2: Lumber Mill 3200 27.3 0.401 2750 Case 3: Plastics Manufacturing Plant 15,000 29.8 1.717 7008 Case 4: Chemical Plant 10,000 18.5 1.842 8760 *Represents annual operating hours during which both electricity and process heat are required. 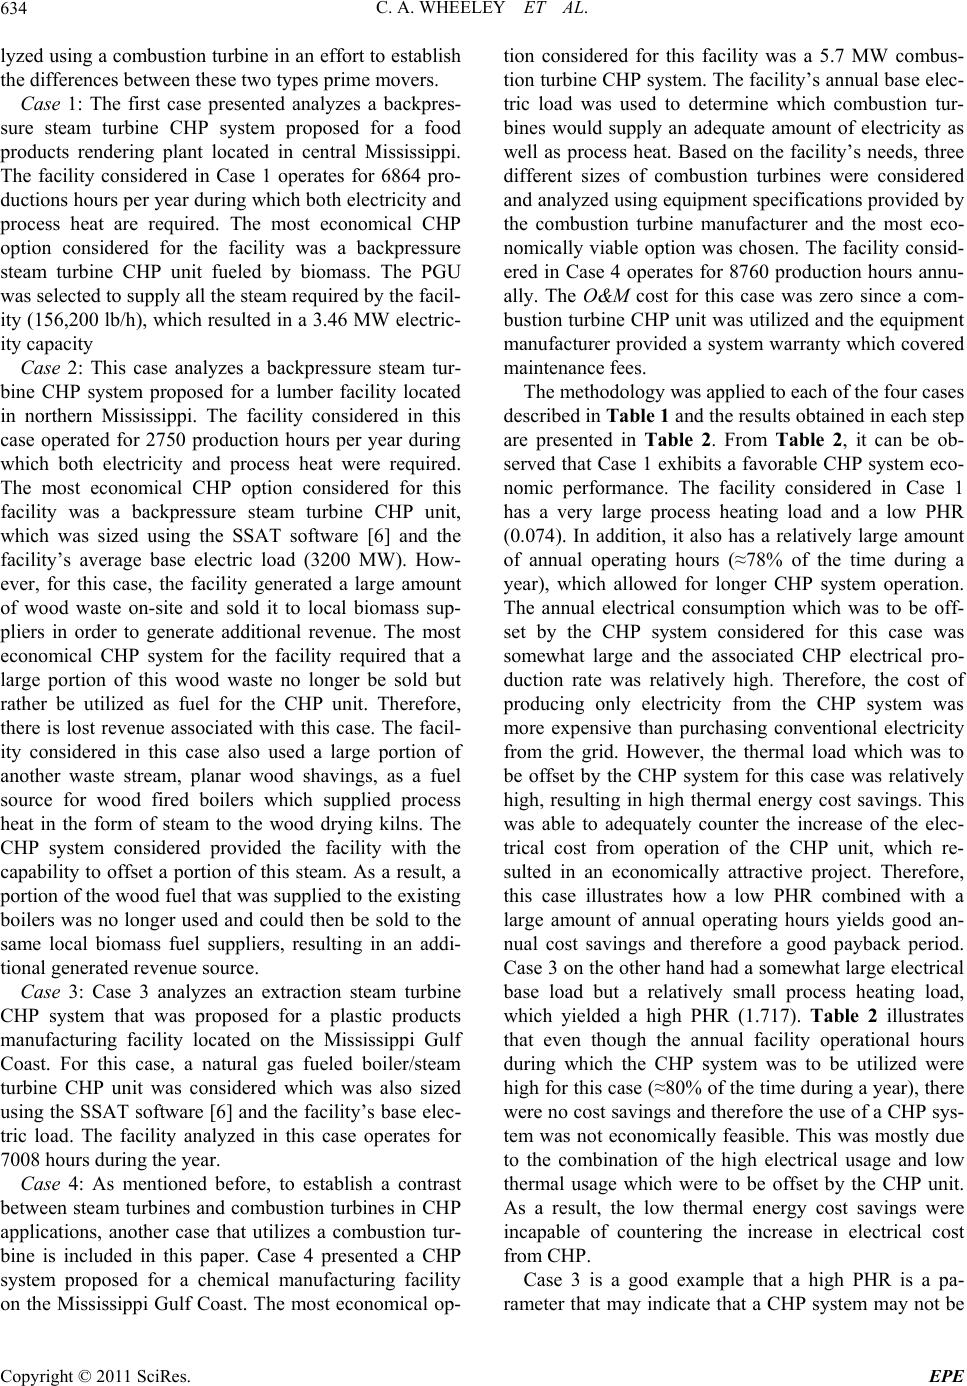 C. A. WHEELEY ET AL. Copyright © 2011 SciRes. EPE 634 lyzed using a combustion turbine in an effort to establish the differences between these two types prime movers. Case 1: The first case presented analyzes a backpres- sure steam turbine CHP system proposed for a food products rendering plant located in central Mississippi. The facility considered in Case 1 operates for 6864 pro- ductions hours per year during which both electricity and process heat are required. The most economical CHP option considered for the facility was a backpressure steam turbine CHP unit fueled by biomass. The PGU was selected to supply all the steam required by the facil- ity (156,200 lb/h), which resulted in a 3.46 MW electric- ity capacity Case 2: This case analyzes a backpressure steam tur- bine CHP system proposed for a lumber facility located in northern Mississippi. The facility considered in this case operated for 2750 production hours per year during which both electricity and process heat were required. The most economical CHP option considered for this facility was a backpressure steam turbine CHP unit, which was sized using the SSAT software [6] and the facility’s average base electric load (3200 MW). How- ever, for this case, the facility generated a large amount of wood waste on-site and sold it to local biomass sup- pliers in order to generate additional revenue. The most economical CHP system for the facility required that a large portion of this wood waste no longer be sold but rather be utilized as fuel for the CHP unit. Therefore, there is lost revenue associated with this case. The facil- ity considered in this case also used a large portion of another waste stream, planar wood shavings, as a fuel source for wood fired boilers which supplied process heat in the form of steam to the wood drying kilns. The CHP system considered provided the facility with the capability to offset a portion of this steam. As a result, a portion of the wood fuel that was supplied to the existing boilers was no longer used and could then be sold to the same local biomass fuel suppliers, resulting in an addi- tional generated revenue source. Case 3: Case 3 analyzes an extraction steam turbine CHP system that was proposed for a plastic products manufacturing facility located on the Mississippi Gulf Coast. For this case, a natural gas fueled boiler/steam turbine CHP unit was considered which was also sized using the SSAT software [6] and the facility’s base elec- tric load. The facility analyzed in this case operates for 7008 hours during the year. Case 4: As mentioned before, to establish a contrast between steam turbines and combustion turbines in CHP applications, another case that utilizes a combustion tur- bine is included in this paper. Case 4 presented a CHP system proposed for a chemical manufacturing facility on the Mississippi Gulf Coast. The most economical op- tion considered for this facility was a 5.7 MW combus- tion turbine CHP system. The facility’s annual base elec- tric load was used to determine which combustion tur- bines would supply an adequate amount of electricity as well as process heat. Based on the facility’s needs, three different sizes of combustion turbines were considered and analyzed using equipment specifications provided by the combustion turbine manufacturer and the most eco- nomically viable option was chosen. The facility consid- ered in Case 4 operates for 8760 production hours annu- ally. The O&M cost for this case was zero since a com- bustion turbine CHP unit was utilized and the equipment manufacturer provided a system warranty which covered maintenance fees. The methodology was applied to each of the four cases described in Table 1 and the results obtained in each step are presented in Table 2. From Table 2, it can be ob- served that Case 1 exhibits a favorable CHP system eco- nomic performance. The facility considered in Case 1 has a very large process heating load and a low PHR (0.074). In addition, it also has a relatively large amount of annual operating hours (≈78% of the time during a year), which allowed for longer CHP system operation. The annual electrical consumption which was to be off- set by the CHP system considered for this case was somewhat large and the associated CHP electrical pro- duction rate was relatively high. Therefore, the cost of producing only electricity from the CHP system was more expensive than purchasing conventional electricity from the grid. However, the thermal load which was to be offset by the CHP system for this case was relatively high, resulting in high thermal energy cost savings. This was able to adequately counter the increase of the elec- trical cost from operation of the CHP unit, which re- sulted in an economically attractive project. Therefore, this case illustrates how a low PHR combined with a large amount of annual operating hours yields good an- nual cost savings and therefore a good payback period. Case 3 on the other hand had a somewhat large electrical base load but a relatively small process heating load, which yielded a high PHR (1.717). Table 2 illustrates that even though the annual facility operational hours during which the CHP system was to be utilized were high for this case (≈80% of the time during a year), there were no cost savings and therefore the use of a CHP sys- tem was not economically feasible. This was mostly due to the combination of the high electrical usage and low thermal usage which were to be offset by the CHP unit. As a result, the low thermal energy cost savings were incapable of countering the increase in electrical cost from CHP. Case 3 is a good example that a high PHR is a pa- ameter that may indicate that a CHP system may not be r  C. A. WHEELEY ET AL. Copyright © 2011 SciRes. EPE 635 Table 2. Methodology results for the four evaluated cases. Methodology Case 1 Case 2 Case 3 Case 4 Step 1 Capsys [MW] 3.463 0.63 15.45 5.7 CR [$/kW] 2900 2900 1100 1313 Step 2 IC [$] 10,042,700 2,661,820 16,997,200 7,484,100 HR (hours) 6864 2750 7008 8760 AF 0.8 0.8 0.8 0.8 Step 3 Prod [MWh/yr] 19,016 1386 86,630 39,945 Step 4 O&M [$/yr] 152,128 11,088 693,040 0 Lostrev [$/yr] 0 118,800 0 0 costf $21.00/ton $0.00/ton $4.510/MMBtu $4.421/MMBtu fuelFR 25.8 tons/hr 4.5 tons/hr 312.7 MMBtu/hr 61.0 MMBtu/hr Step 5 Costop [$/yr] 3,127,260 129,888 8,599,617 1,889,924 Step 6 URCHP [$/kWh] 0.16445 0.09371 0.09927 0.047312 URconv [$/kWh] 0.0825888 0.05497 0.0732886 0.061793 Step 7 CSele [$/yr] –1,556,674 –53,693 –2,250,771 578,434 Ldst [lb/hr] 156,200 27,222 22,000 18,500 Step 8 ESst [MMBtu/yr] 858,602 59,949 123,467 129,780 CSst [$/yr] 4,007,096 106,531 556,835 675,011 Revgen [$/yr] 0 97,092 0 0 Step 9 CStot [$/yr] 2,450,421 149,929 -1,693,935 1,253,445 lc-year [yr] 10 10 10 10 ITC% 10% 10% 10% 10% SP [yr] 3.69 15.98 N/A 5.37 IRR 23.94% N/A N/A 13.24% NPV [$] 3,259,668 –1,643,176 N/A –444,937 economically feasible for that particular facility despite the fact that the CHP system could be utilized for a high amount of annual operating hours and the system in- stalled cost rating ($/kW) was the lowest for all of the cases considered. Case 2 differed from all of the other cases considered in that the fuel needed to operate the proposed CHP sys- tem was generated on site as a waste stream. However, this waste fuel was sold by the facility to local biomass fuel suppliers, so any amount that was to be utilized as a CHP system fuel source resulted in a loss in revenue for the facility. The thermal load for this case was also rela-  C. A. WHEELEY ET AL. 636 tively small, which yielded a low PHR (0.041). However, the thermal energy cost savings was still adequate to counter the associated electrical cost increase from use of the CHP system considered in this case. On the other hand, the annual facility operating hours during which both process heat and electricity were needed were very low. Therefore, the proposed CHP unit only operated 2750 hours annually (31% of the time), which signify- cantly decreased its capability to provide overall project cost savings. The low operating hours of the proposed CHP unit along with the associated revenue loss related to utilization of the waste fuel ultimately resulted in a poor economic performance and a relatively long project payback period for this case. In general, for the cases that employed steam turbines (1, 2, and 3), the electricity production from the CHP system was more expensive than the electricity produced using conventional technologies. However, if the thermal load which was to be offset by CHP system is relatively high, the thermal energy cost savings can counter the increase of the electrical cost from the CHP operation, resulting in an economically attractive implementation. On the other hand, if the thermal load to be offset by the CHP unit is small, the thermal energy cost savings will be low and will most likely result in poor overall project cost savings. This can be clearly seen in Equation (11), in which the cost savings associated with the thermal load and any revenue that might be generated by the sale of a waste fuel source that is unutilized due to operation of the CHP system attempt to balance the negative cost savings typically associated with generation of electricity on site. Comparison of steam turbine prime movers to com- bustion turbine prime movers for industrial facility CHP systems. Case 4 analyzed a CHP system for a chemical manu- facturing plant that had an average base electrical load but a relatively small process heating load, which in turn yielded a high PHR (1.842). However, rather than ana- lyzing a steam turbine, a combustion turbine CHP system was considered for this case. The facility considered in this case operated for 8760 hours per year (non-stop) and the resulting CHP electrical production rate was lower than the conventional electrical purchase rate, meaning that there were electrical cost savings resulting from use of the CHP unit, which is seldom the case for a steam turbine CHP system. The resulting annual electrical cost savings was still somewhat low. The corresponding thermal energy cost savings was also relatively low due to the facility’s low process heating load which was to be offset by the CHP system. However, much of the equip- ment needed for the CHP project was already installed or could easily be retrofitted and much of this equipment was not being utilized to its full potential. As a result, the CHP system installation cost was very low. Therefore the use of a CHP system for this case exhibited good eco- nomic considerations in spite of the fact that the annual cost savings were lower for this case than for many of the other cases considered. It is important to highlight that Case 4 is the only case in which the cost of the electricity produced by the CHP system is lower than the conventional electrical cost. However, when using a combustion turbine, it is impor- tant to note that the ability to significantly vary the CHP system steam supply rate will be greatly decreased. For instance, the steam supply rate for a steam turbine CHP system can be relatively easily increased or decreased over a wide range by modifying the boiler fuel input and boiler steam flow rate. Typically, combustion turbine CHP systems are rated to recover a certain amount of heat from the exhaust and utilize that heat source for process steam production. If additional steam is required by the facility, then the combustion turbine CHP system can often be equipped with a duct burner, which requires additional fuel input in order to produce excess steam. However, duct burners that are incorporated into com- bustion turbine CHP systems are usually only available in two or three sizes, thus limiting the options for in- creasing the process steam flow rate. The reduced capa- bility to modify the CHP process steam flow rate is an important aspect that must be thoroughly addressed when considering a combustion turbine CHP application. For instance, it is often the case that a facility could generate electricity at a rate lower than the conventional utility electrical cost if they utilize a combustion turbine as the prime mover for a CHP system they are considering. However, the thermal energy cost savings might be sub- stantially less than the thermal energy cost savings asso- ciated with a steam turbine CHP system due to the steam supply flow rate restrictions corresponding to the com- bustion turbine. Therefore, combustion turbines may not always be the most economically attractive option. For instance, in many cases, the increased thermal energy cost savings resulting from utilizing a steam turbine CHP application could outweigh the electrical cost savings benefits of a combustion turbine. Another aspect that influences the economic perform- ance of a CHP system is the annual operating hours. In general, it is apparent that longer system operational hours result in better economics for the use of CHP sys- tems. From the results presented in Table 2, it can be concluded that some of the key parameters to be consid- ered during a CHP project economic analysis are the PHR (electric and thermal loads), the annual operating hours, the electric utility rates, and of course the cost and availability of the fuel to be used to operate the CHP sys- Copyright © 2011 SciRes. EPE  C. A. WHEELEY ET AL.637 tem. For this reason the following section evaluates how varying some of these parameters will affect the eco- nomic performance of CHP systems. 3.2. Parametric Analysis of Some of the Factors That Affect the CHP System Performance This section presents the effect of several parameters on the economic performance of CHP system for the evalu- ated cases. These parameters include: annual facility operating hours, electric utility usage rates, the facility electrical and thermal load (represented by the PHR), and the fuel to be used to operate the CHP system. 3.2.1. Annual Facility Operating Hours CHP systems are often good alternatives for industrial manufacturing facilities that require both electrical power and process heat. However, these projects will not result in good economics if the CHP units are operated during times when only electricity or only process heat are required by the facility in question. Therefore, the annual facility operating hours during which both elec- tricity and process heating are required is an important parameter that has a significant impact on the economic success of a CHP project. To assess the effect of the op- erating hours on CHP economic performance, the facili- ties were evaluated using 8760 hr, 6570 hr, 4380 hr, and 2190 hr, while all of the other independent parameters, such as their corresponding base electric loads, thermal loads, etc. are held constant. Figure 1 shows the effect of the operational hours on the CHP system economic per- formance for all the evaluated cases. Figure 1(a) illus- trates that for Cases 1, 2, and 4 increasing the hours of operation increases the annual cost savings obtained from the CHP system. This is due to the fact that larger portions of the facilities electrical and thermal energy usages are offset by their respective CHP systems as the CHP operating hours are increased. While this does mean that in some cases the CHP electrical energy cost will be higher, the associated thermal energy cost savings will also be higher, which provides a better potential for improved overall project economics. However, for Case 3, increasing the CHP operational hours represents a de- crease in the already poor economic performance. For this case, the electrical cost resulting from operation of the CHP system is higher than the conventional system electrical cost. Also, this facility (Case 3) requires a rela- tively low steam flow rate to offset all of the process heating requirements. The annual thermal energy cost savings are far too low to offset the negative electrical savings when the normal facility operating hours (7008 hr/yr) are used in the economic analysis and even when the facility operating hours are increased to a maximum (8760 hr/yr), the total CHP system project cost savings remain negative for Case 3. Figure 1(b) illustrates the simple payback for different operating hours for the evaluated facilities. The results presented in this figure agree with the results obtained previously that are pre- sented in Figure 1(a) since it is the case that greater an- nual savings yield lower payback periods. The payback time period was not applicable for Case 3 since the CHP system considered for the facility in question exhibited no cost savings. 3.2.2. Facility Electric Utility Rate Another important parameter that strongly affects the economic performance of a CHP system is the facility’s local electric utility rate for purchase of conventionally supplied electricity. To assess the effect of the facility electric utility rate on the CHP systems’ economic per- formance, the facilities considered in Cases 1-4 were evaluated using assumed electric utility rates of $0.050/ kWh, $0.075/kWh, $0.100/kWh, and $0.125/kWh, while all of the other independent parameters such as the base electric load, thermal load, operating hours, etc. are held constant. Figure 2(a) illustrates the concept that higher electric utility rates result in higher annual cost savings that are associated with operation of a CHP system. Fa- (a) (b) Figure 1. Effect of the annual operating hours on (a) the annual cost savings (b) the simple payback. Copyright © 2011 SciRes. EPE  C. A. WHEELEY ET AL. 638 (a) (b) Figure 2. Effect of the electric utility rates on (a) the annual cost savings (b) the simple payback. vorable economics are obtained for Case 3 as the electric utility rate is increased above $0.095/kWh. Figure 2(b) shows that the payback for cases 1, 2 and 4 decreases as the electric utility rate is increased, which is the expected result. However, for Case 3, payback values only become applicable after the $0.095 electric utility rate threshold is exceeded. Even though there are some cost savings associated with the CHP system considered for Case 3 after the $0.095 electric utility rate threshold was ex- ceeded, the corresponding payback is still extremely high. This is why it is significantly important to analyze both the cost savings and the payback period for the imple- mentation of a CHP system. Therefore, it is apparent that the electric utility rate has a strong influence on the eco- nomic feasibility of a CHP system. 3.2.3. Facility Thermal Load The thermal load of facilities for which CHP systems are proposed is another important parameter that has a sig- nificant impact on the economic success of a CHP pro- ject. This can also be evaluated as the effect of the power-to-heat ratio (PHR) on the economic performance of the CHP system. The PHR can be expressed as the ratio of the facility’s base electric load to its hourly ther- mal load. To evaluate the effect of the facility’s thermal load on the economic performance of a CHP system, the thermal loads of each of the facilities considered in Cases 1-4 were decrease by 25% and 50% and also increased by 25%, while all of the other independent parameters, such as the base electric load, operating hours, etc., were held constant. Figure 3 shows the effect that varying the thermal load has on the annual cost savings and the pay- back period. Figure 3(a) illustrates that for cases 1, 2, and 4, higher the thermal loads, or in other terms smaller PHRs, will result in greater cost savings associated with operation of the CHP systems. However, the thermal load would have to be unrealistically increased to obtain cost savings for Case 3 due to the extremely poor total cost savings for this case. This can be realized by exam- ining the trend for Case 3 in Figure 3(a) . As the thermal load is varied from 50% to 125%, there are minimal changes in the cost savings associated with the CHP project considered for Case 3 and it is also apparent that the thermal load would have to be increased greatly be- fore positive project cost savings would be obtained. 3.2.4. Fuel Selection and Cost The fuel selection, cost, and availability of the fuel to be used to operate the CHP system are very important fac- tors to consider when determining the economic per- (a) (b) Figure 3. Effect of the facility thermal load on (a) the an- nual cost savings (b) the simple payback. Copyright © 2011 SciRes. EPE  C. A. WHEELEY ET AL.639 Figure 4. Effect of the CHP fuel used on the cost savings and payback period for the facility analyzed in Case 1. formance of a CHP system. Figure 4 shows the annual cost savings as well as the payback period for different CHP fuels used for the facility evaluated in Case 1. The fuels used in this case are: typical green wood, natural gas, number 2 fuel oil, and typical western coal. In addi- tion, the costs of the evaluated fuels, which are obtained from the SSAT software [6] estimates, are presented in Figure 4. The fuel energy required in the boiler to satisfy the steam requirements of the evaluated facility is about 271 MMBtu/h. Therefore, the amount of fuel needed will depend on the specific fuel’s heating value. Figure 4 illustrates that using typical green wood and typical western coal pro- vide annual cost savings and paybacks on the order of $2.4 M and 3.69 yr and $3.2 M and 2.81 yr, respectively. On the other hand, natural gas and number 2 fuel oil both provide negative cost savings, or annual costs which ex- ceed their respective conventional costs. The results pre- sented in this figure show how important the fuel selec- tion is in relation to the economic performance of a CHP system. However, it is also important to keep in mind that the fuel selection is often driven by the availability of the particular type of fuel at the desired location and that the region where the facility is located will impact the cost of the fuel as well. 4. Conclusions This paper presented a methodology which can be used to conduct a feasibility study and economic analysis for a CHP system at an industrial manufacturing facility that has a need for space or process heating in the form of steam. While numerous methodologies have been de- veloped and countless simulations have been completed for CHP systems at commercial and residential buildings, the methodology developed in this paper is highly valu- able as it allows for identification of favorable CHP pro- jects at manufacturing plants. The methodology allowed for analysis of multiple parameters that are indicative of favorable economic performance for CHP and also ac- counted for any variations encountered due to differing availability of resources, energy requirements, or operat- ing schemes of the facility considered. The effects that variations in many of these indicative factors, such as annual facility operational hours during which both process heat and electricity were needed, facility average hourly thermal load, the cost of utility supplied electric- ity, and the CHP fuel type and associated fuel cost, have on the outcome of the economic analysis were also ex- amined. Four cases studies were analyzed in order to determine how each of the factors mentioned previously affect the economic considerations of installing a CHP system. In general it was observed that CHP systems that had high annual operational hours resulted in favorable economics and facilities that required less process heat exhibited poor economics when compared to the other cases. Also, it was observed that CHP economics could possibly be improved if a facility was able to utilize a waste stream produced on site as a fuel source for the CHP system. However, variations in the other parameters can nega- tively counter any of these available benefits and there- fore all of the indicating factors must be thoroughly ana- lyzed when conducting a CHP feasibility study. In general, the project payback timeline was decreased and both the internal rate of return and net present value were increased as 1) the operational hours during which both process heat and electricity were required by the facility were increased; 2) the average hourly thermal load of the facility was increased; and 3) the cost of util- ity supplied electricity was increased. The type of fuel to be used in the CHP unit had a significant impact on the economic performance of the system. From the case considered, it was observed that some of the evaluated fuels provided favorable economic analysis results while other fuels resulted in negative annual cost savings. Therefore, in order to add robustness to any CHP feasi- bility study, it is apparent that multiple fuel types should be considered when determining the system’s economic performance. 5. References [1] J. J. Cuttica and C.Haefke, “Combined Heat and Power (CHP): Is It Right for Your Facility?” 2009. http://www1.eere.energy.gov/industry/pdfs/webcast_2009 -0514_chp_in_facilities.pdf [2] R. Graves, B. K. Hodge and L. M. Chamra, “The Spark Spread as a Measure of Economic Viability for a Com- bined Heating and Power Application with Ideal Loading Conditions,” Proceedings of the ASME 2008 2nd Con- ference on Energy Sustainability, Jacksonville, 10-14 Au- Copyright © 2011 SciRes. EPE  C. A. WHEELEY ET AL. Copyright © 2011 SciRes. EPE 640 gust 2008, Paper No. ES2008-54203, pp. 167-171. [3] A. Smith, N. Fumo and P. Mago, “Spark Spread—A Scree- ning Parameter for Combined Heating and Power Sys- tems,” Applied Energy, Vol. 88, No. 2, 2011, pp. 1494- 1499. doi:10.1016/j.apenergy.2010.11.004 [4] M. Ellis and B.Gunes, “Status of Fuel Cell Systems for Combined Heat and Power Applications in Buildings,” ASHRA Transactions, Vol. 108, 2002, pp. 108-111. [5] G. Zimmer, “Modeling and Simulation of Steam Turbine Processes: Individual Models for Individual Tasks,” Ma- thematical and Computer Modelin g of Dynamical S yst e ms , Vol. 14, No. 6, 2008, pp. 469-493. doi:10.1080/13873950802384001 [6] U.S. Department of Energy, “Steam System Assessment Tool (SSAT),” 2010. http://www1.eere.energy.gov/industry/bestpractices/softw are.html [7] Resource Dynamics Corporation, “Combined Heat and Power Market Potential for Opportunity Fuels,” 2004. http://www1.eere.energy.gov/library/ [8] R. Zogg, K. Roth and J. Brodrick, “Using CHP Systems in Commercial Buildings,” ASHRAE Journal, Vol. 47, No. 9, 2005, pp. 33-36. [9] F. A. Al-Sulaiman, F. Hamdullahpur and I. Dincer, “Tri- generation: A Comprehensive Review Based on Prime Movers,” International Journal of Energy Research, Vol. 35, No. 3, 2010, pp. 233-258. doi:10.1002/er.1687 [10] H. Ghaebi, M. Amidpour, S. Karimkashi and O. Rezayan, “Energy, Exergy and Thermoeconomic Analysis of a Combined Cooling, Heating and Power (CCHP) System with Gas Turbine Prime Mover,” International Journal of Energy Research, Vol. 35, No. 8, 2010, pp. 697-709. doi:10.1002/er.1721 [11] E. Cardona, A. Piacentino and F. Cardona, “Matching Economical, Energetic and Environmental Benefits: An Analysis for Hybrid CHCP-Heat Pump Systems,” Energy Conversion and Management, Vol. 47, No. 20, 2006, pp. 3530-3542. doi:10.1016/j.enconman.2006.02.027 [12] P. J. Mago, N. Fumo and L. M. Chamra, “Performance Analysis of CCHP and CHP Systems Operating Follow- ing the Thermal and Electric Load,” International Jour- nal of Energy Research, Vol. 33, No. 9, 2009, pp. 852- 864. doi:10.1002/er.1526 [13] P. J. Mago, A. Hueffed and L. M. Chamra, “A Review on Energy, Economical, and Environmental Benefits of the Use of CHP Systems for Small Commercial Buildings for the North American Climate,” International Journal of Energy Research, Vol. 33, No. 14, 2009, pp. 1252-1265. doi:10.1002/er.1630 [14] A. A. Jalalzadeh-Azar, “A Comparison of Electrical- and Thermal-Load-Following CHP Systems,” ASHRAE Transac- tions, Vol. 110, 2004, pp. 85-94. [15] A. K. Hueffed and P. J. Mago, “Influence of Prime Mover Size and Operational Strategy on the Performance of Com- bined Cooling, Heating, and Power Systems under Diffe- rent Cost Structures,” Journal of Power and Energy, Vol. 224, No. 5, 2010, pp. 591-605. [16] H. Cho, S. Eksioglu, R. Luck and L. M. Chamra, “Opera- tion of Micro-CHP System Using an Optimal Energy Dispatch Algorithm,” Proceedings of the ASME 2008 2nd Conference on Energy Sustainability, Jacksonville, 10-14 August 2008, pp. 747-754. [17] C. Wheeley and P. J. Mago, “A Methodology to Conduct a Combined Heating and Power System Assessment and Feasibility Study for Industrial Manufacturing Facilities,” ASME International Mechanical Engineering Congress and Exposition (IMECE2011), Denver, 11-17 November 2011, Paper No. IMECE2011-62299. [18] US Environmental Protection Agency Combined Heat and Power Partnership, “EPA Catalog of CHP Technolo- gies,” 2008. http://www.epa.gov/chp/basic/catalog.html
|