Paper Menu >>
Journal Menu >>
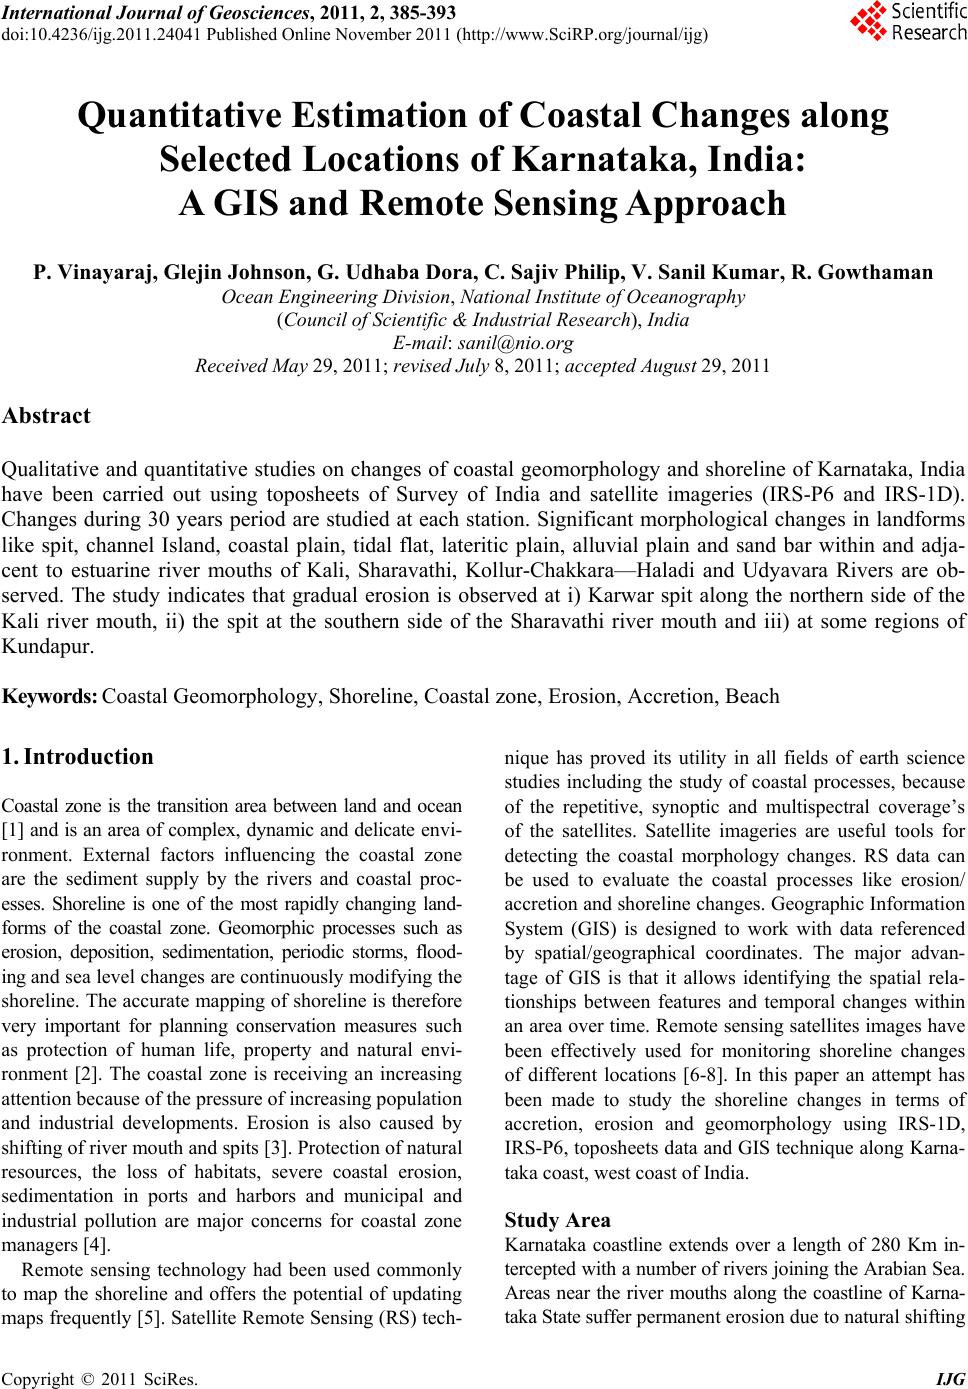 International Journal of Geosciences, 2011, 2, 385-393 doi:10.4236/ijg.2011.24041 Published Online November 2011 (http://www.SciRP.org/journal/ijg) Copyright © 2011 SciRes. IJG 385 Quantitative Estimation of Coastal Changes along Selected Locations of Karnataka, India: A GIS and Remote Sensing Approach P. Vinayaraj, Glejin Johnson, G. Udhaba Dora, C. Sajiv Philip, V. Sanil Kumar, R. Gowthaman Ocean Engineering Divisi on , National Institute of Oceanography (Council of Scientific & Industrial Research), India E-mail: sanil@nio.org Received May 29, 2011; revised July 8, 2011; accepted August 29, 201 1 Abstract Qualitative and quantitative studies on changes of coastal geomorphology and shoreline of Karnataka, India have been carried out using toposheets of Survey of India and satellite imageries (IRS-P6 and IRS-1D). Changes during 30 years period are studied at each station. Significant morphological changes in landforms like spit, channel Island, coastal plain, tidal flat, lateritic plain, alluvial plain and sand bar within and adja- cent to estuarine river mouths of Kali, Sharavathi, Kollur-Chakkara—Haladi and Udyavara Rivers are ob- served. The study indicates that gradual erosion is observed at i) Karwar spit along the northern side of the Kali river mouth, ii) the spit at the southern side of the Sharavathi river mouth and iii) at some regions of Kundapur. Keywords: Coastal Geomorphology, Shoreline, Coastal zone, Erosion, Accretion, Beach 1. Introduction Coastal zone is the transition area between land and ocean [1] and is an area of complex, dynamic and delicate e nvi- ronment. External factors influencing the coastal zone are the sediment supply by the rivers and coastal proc- esses. Shoreline is one of the most rapidly changing land- forms of the coastal zone. Geomorphic processes such as erosion, deposition, sedimentation, periodic storms, flood- ing and sea level changes are continuously modifying the shoreline. The accurate mapping of shoreline is therefore very important for planning conservation measures such as protection of human life, property and natural envi- ronment [2]. The coastal zone is receiving an increasing attention because of the pressure of increasing pop ulat ion and industrial developments. Erosion is also caused by shifting of river mouth and spits [3]. Protection of natural resources, the loss of habitats, severe coastal erosion, sedimentation in ports and harbors and municipal and industrial pollution are major concerns for coastal zone managers [4]. Remote sensing technology had been used commonly to map the shoreline and offers the potential of updating maps frequently [5]. Satellite Remote Sensing (RS) tech- nique has proved its utility in all fields of earth science studies including the study of coastal processes, because of the repetitive, synoptic and multispectral coverage’s of the satellites. Satellite imageries are useful tools for detecting the coastal morphology changes. RS data can be used to evaluate the coastal processes like erosion/ accretion and shoreline changes. Geographic Information System (GIS) is designed to work with data referenced by spatial/geographical coordinates. The major advan- tage of GIS is that it allows identifying the spatial rela- tionships between features and temporal changes within an area over time. Remote sensing satellites i mages have been effectively used for monitoring shoreline changes of different locations [6-8]. In this paper an attempt has been made to study the shoreline changes in terms of accretion, erosion and geomorphology using IRS-1D, IRS-P6, toposheets data and GIS technique along Karna- taka coast, west coast of I ndi a. Study Area Karnataka coastline extends over a length of 280 Km in- tercepted with a number of riv ers joining the Arabian Sea. Areas near the river mouths along the coastline of Karna- taka State suffer permanent erosion due to natural shifting 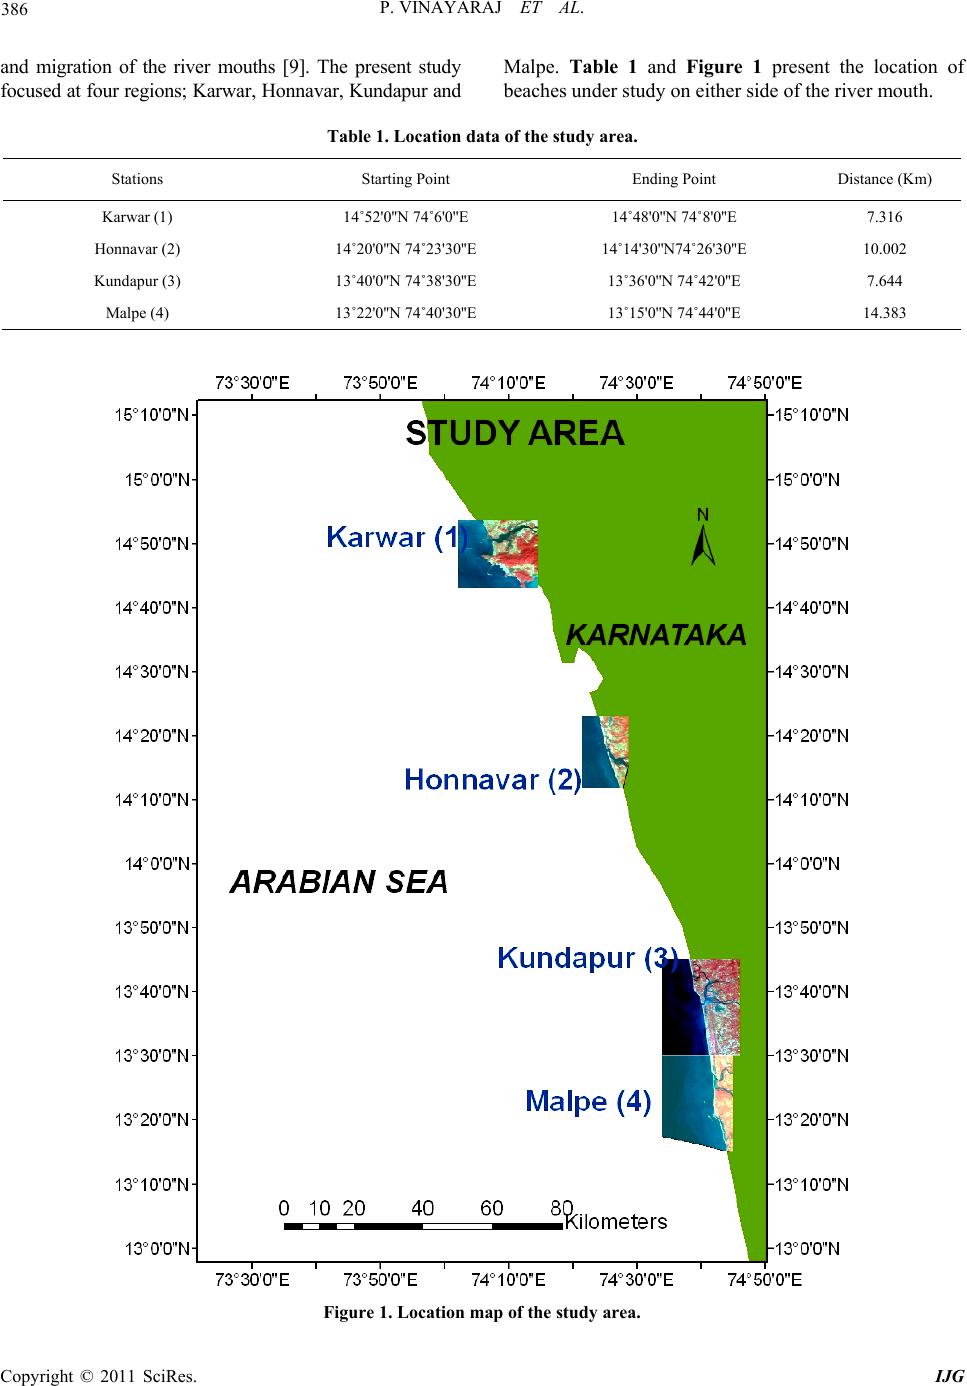 P. VINAYARAJ ET AL. Copyright © 2011 SciRes. IJG 386 and migration of the river mouths [9]. The present study focused at four regions; Karwar, Honnavar, Kundapur and Malpe. Table 1 and Figure 1 present the location of beaches under study on either side of the river mouth. Table 1. Location data of the study area. Stations Starting Point Ending Point Distance (Km) Karwar (1) 14˚52'0''N 74˚6'0''E 14˚48'0''N 74˚8'0''E 7.316 Honnavar (2) 14˚20'0''N 74˚23'30''E 14˚14'30''N74˚26'30''E 10.002 Kundapur (3) 1 3 ˚40'0''N 74˚38'30''E 13˚36'0''N 74˚42'0''E 7.644 Malpe (4) 13˚22'0''N 74˚40'30''E 13˚15'0''N 74˚44'0''E 14.383 Figure 1. Location map of the study area. 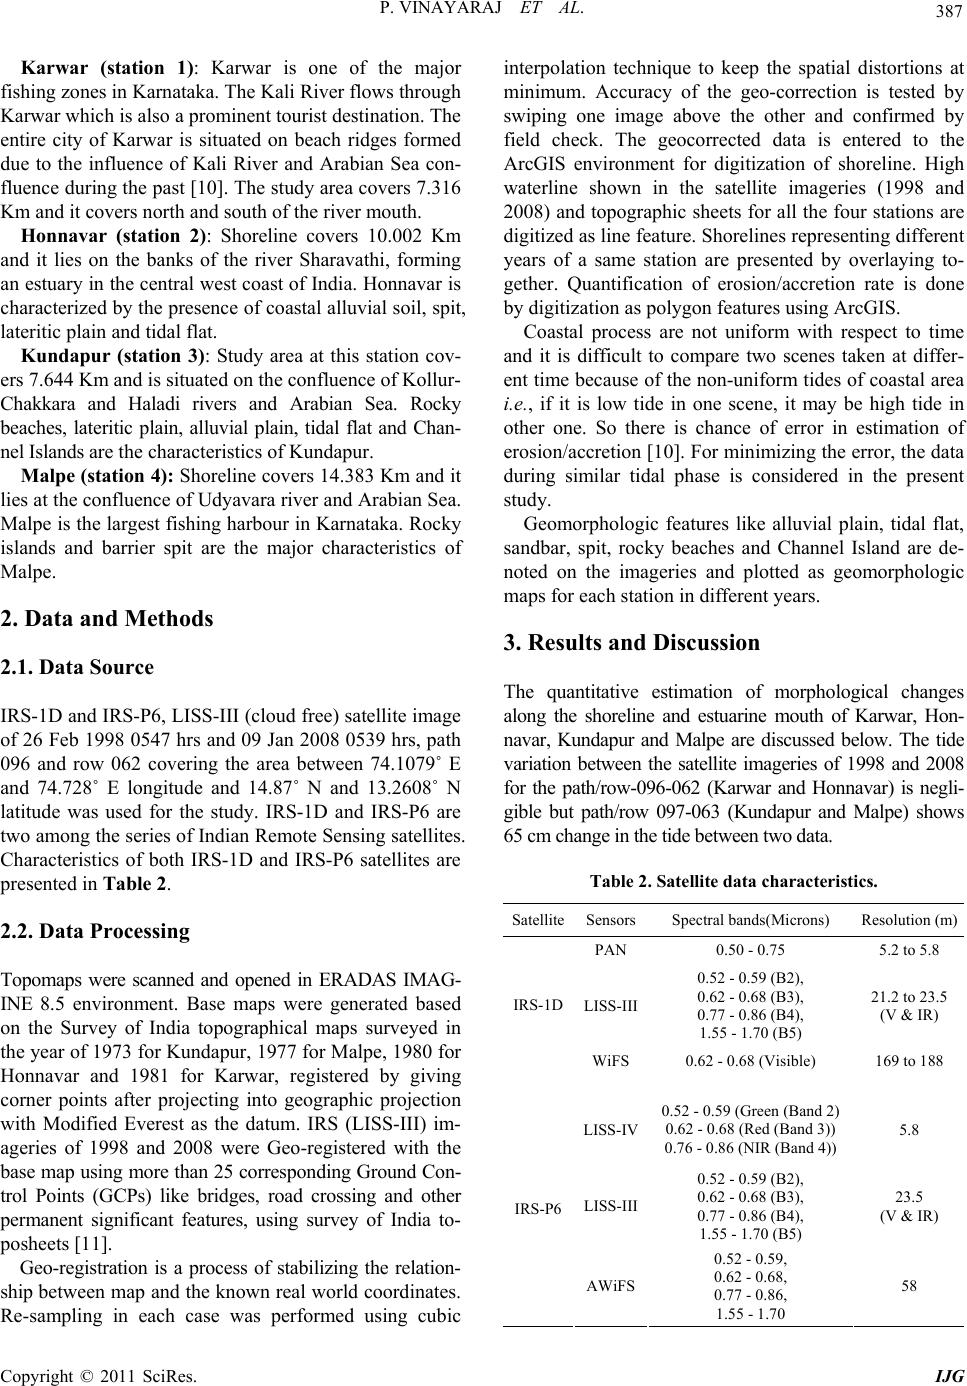 P. VINAYARAJ ET AL. Copyright © 2011 SciRes. IJG 387 Karwar (station 1): Karwar is one of the major fishing zones in Karnataka. The Kali River flows through Karwar which is also a prominent tourist destination. The entire city of Karwar is situated on beach ridges formed due to the influence of Kali River and Arabian Sea con- fluence during the past [10]. The study area covers 7.316 Km and it covers north and south of the river mouth. Honnavar (station 2): Shoreline covers 10.002 Km and it lies on the banks of the river Sharavathi, forming an estuary in the central west coast of India. Honnavar is characterized by the presence of coastal alluvial soil, spit, lateritic plain and tidal flat. Kundapur (station 3): Study area at this station cov- ers 7.644 Km and is situated on the confluence of Kollur- Chakkara and Haladi rivers and Arabian Sea. Rocky beaches, lateritic plain, alluvial plain, tidal flat and Chan- nel Islands are the characteristics of Kundapur. Malpe (station 4): Shoreline covers 14.383 Km and it lies at the confluence of Udyavara river and Arabian Sea. Malpe is the largest fishing harbour in Karnataka. Rocky islands and barrier spit are the major characteristics of Malpe. 2. Data and Methods 2.1. Data Source IRS-1D and IRS-P6, LISS-III (cloud free) satellite image of 26 Feb 1998 0547 hrs and 09 Jan 2008 0539 hrs, path 096 and row 062 covering the area between 74.1079˚ E and 74.728˚ E longitude and 14.87˚ N and 13.2608˚ N latitude was used for the study. IRS-1D and IRS-P6 are two among the series of Indian Remote Sensing satellites. Characteristics of both IRS-1D and IRS-P6 satellites are presented in Table 2. 2.2. Data Processing Topomaps were scanned and opened in ERADAS IMAG- INE 8.5 environment. Base maps were generated based on the Survey of India topographical maps surveyed in the year of 1973 for Kundapur, 197 7 for Malpe, 198 0 for Honnavar and 1981 for Karwar, registered by giving corner points after projecting into geographic projection with Modified Everest as the datum. IRS (LISS-III) im- ageries of 1998 and 2008 were Geo-registered with the base map using more than 25 corresponding Ground Con- trol Points (GCPs) like bridges, road crossing and other permanent significant features, using survey of India to- posheets [11 ] . Geo-registration is a process of stabilizing the relation- ship between map and the known real world coordinates. Re-sampling in each case was performed using cubic interpolation technique to keep the spatial distortions at minimum. Accuracy of the geo-correction is tested by swiping one image above the other and confirmed by field check. The geocorrected data is entered to the ArcGIS environment for digitization of shoreline. High waterline shown in the satellite imageries (1998 and 2008) and topographic sheets for all the four stations are digitized as line feature. Shorelines representing different years of a same station are presented by overlaying to- gether. Quantification of erosion/accretion rate is done by digitization as polygon features using ArcGIS. Coastal process are not uniform with respect to time and it is difficult to compare two scenes taken at differ- ent time because of the non-uniform tides of coastal area i.e., if it is low tide in one scene, it may be high tide in other one. So there is chance of error in estimation of erosion/accretion [10]. For minimizing the error, the data during similar tidal phase is considered in the present study. Geomorphologic features like alluvial plain, tidal flat, sandbar, spit, rocky beaches and Channel Island are de- noted on the imageries and plotted as geomorphologic maps for each station in different years. 3. Results and Discussion The quantitative estimation of morphological changes along the shoreline and estuarine mouth of Karwar, Hon- navar, Kundapur and Malpe are discussed below. The tide variation between the satellite imageries of 1998 and 2008 for the path/row-096-062 (Karwar and Honnavar) is negli- gible but path/row 097-063 (Kundapur and Malpe) shows 65 cm change in the tide between two data. Table 2. Satellite data characteristics. SatelliteSensorsSpectral bands(Microns) Resolution (m) PAN 0.50 - 0.75 5.2 to 5.8 LISS-III 0.52 - 0.59 (B2), 0.62 - 0.68 (B3), 0.77 - 0.86 (B4), 1.55 - 1.70 (B5) 21.2 to 23.5 (V & IR) IRS-1D WiFS 0.62 - 0.68 (Visible) 169 to 188 LISS-IV 0.52 - 0.59 (Green (Band 2) 0.62 - 0.68 (Red (Ban d 3)) 0.76 - 0.86 (NIR (Band 4)) 5.8 LISS-III 0.52 - 0.59 (B2), 0.62 - 0.68 (B3), 0.77 - 0.86 (B4), 1.55 - 1.70 (B5) 23.5 (V & IR) IRS-P6 AWiFS 0.52 - 0.59, 0.62 - 0.68, 0.77 - 0.86, 1.55 - 1.70 58  P. VINAYARAJ ET AL. Copyright © 2011 SciRes. IJG 388 The erosion and accretion map of Karwar during the period of 1981 to 1998 (Figure 2) shows considerable erosion of around 1.459 Km2 at the northern side of the Kali River along the shoreline. Net erosion during this period is 0.467 Km2 and net accretion is 0.29 0 Km2. The width of the river mouth has increased from 250 to 800 m without any significant change in the position of the river mouth, this is because of the erosion took place at the both banks of the river mouth. During th e per iod from 1998 to 2008, at Karwar, erosion has occurred along the shore- line from the river mouth to the northern side to a length of around 3.75 Km (Figure 2). It is also observed that the Kali River mouth has shifted slightly around 125 m towards north, with net erosion of 0.397 Km2 and accre- tion of 0.102 K m2 occurred during this period. The study indicates that an area of 0.405 Km2 was eroded during the last 27 years (1981-2008) from the spit mouth, which is the most vulnerable location at station 1. The Sharavathi River mouth has shifted significantly (almost 1220 m) towards north during the period be- tween 1980 and 1998 (Figure 3). Northern side of the river mouth is affected by erosion and the southern side shows accretion. Net erosion and accretion of the station 2 (Honnavar) is 0.465 Km2 and 0.631 Km2 respectively. Most of the shoreline which lies along the southern part of the river mouth shows accretion. The width of the river mouth at Honnavar increased from 125 to 600 m during the ten year period from 1998 to 2008 because of the erosion at both edge of river mouth. Sediments from the tip of the spit on the southern side of river mouth, around 0.184 Km2 areas washed off by erosion. Net ero- sion and accretion are measured as 0.383 Km2 and 0.770 Km2. Study shows that during the last ten years (1998 - 2008) comparatively erosion is more than the accretion. Pavinkurve beach near the Basavarajadurg Island shows considerable ero sion of 0.107 Km2. Erosion and accretion map of Kundapur during 1973 to 1998, shows that river mouth has shifted around 270 m towards south (Figure 4). Erosion observed on the southern side of river mouth for almost 1.146 Km along the shoreline.Net erosion and accretion of the area is 0.170 Km2 and 0.326 Km2 respectively. River mouth width decreased from 200 to 100 m. Almost 2614 m along the shoreline of Gangoli beach grows seaward due to accretion. The width of the river mouth is considera- bly varying from 200 to 360 m during the last ten years from 1998 to 2008 because of the erosion of both side of the river mouth. An area 0.108 Km2 of the entire shore- line of the station 3 got eroded. The net accretion of the area is around 0.127 Km2. Figure 2. Erosion/accretion at Karwar during 1981-1998 and during 1998-2008.  P. VINAYARAJ ET AL. Copyright © 2011 SciRes. IJG 389 Figure 3. Erosion/accretion at Honnavar during 1979-1998 and during 1998-2008. Figure 4. Erosion/accretion at Kundapur during 1973 - 1998 and during 1998 – 2008.  P. VINAYARAJ ET AL. Copyright © 2011 SciRes. IJG 390 Morphological changes near the Udyavara river estu- ary during the period from 1977 to 1998 (Figure 5) shows that width of the mouth has been decreased due to accretion on both sides of the river mouth from 200 to 100 m. The tip of the barrier spit lies on the southern side of the river mouth grows gradually towards north-west direction, dur ing 1977 to 1998 it ha s grow n aroun d 0.10 4 Km2. Net erosion and accretion of the area is 0.615 Km2 and 0.192 Km2 respectively. Study shows that, shoreline erosion is occurring along the locations at Tenkadiyur and Pangala to an extent of 1.372 and 4.636 Km respect- tively. During 1977 to 1998 an area of 0.113 and 0.368 Km2 were eroded from Tenkadiyur and Pangala respec- tively. During 1998 to 2008, the width of the river mouth at Malpe reduced marginally from 260 to 224 m. The tip of the barrier spit continued to grow towards north-west, both side of the river mouth shows accretion. Only on the southern side of the river mouth, the spit got deposited around 0.0 35 Km2. Study indicates that very small area is affected by erosio n and most of the beach showed depo- sitional characteristics. Net erosion of the area is 0.026 Km2 and the net accretion of the area is 0.355 Km2. GIS and Remote Sensing approach study have been done by Dwarakish et al. [12] along the Malpe coastal region. Karwar (1981-2008): The quantity measurement of the area covered by each geomorphology classes such as tidal flat, spit, Marine Island, sandy beach, creek, coastal plain, Channel Island and alluvial plain. Spit shows grad- ual decrease in the area. Among the various land form features spit shows the gradual decrease in area, 0.214 Km² area got eroded from the mouth of the river Kali (Table 3). Slight increase observed in the area of coastal plain and alluvial plain. Creek has lost 1.028 Km². Figure 5. Erosion/accretion at Malpe during 1977-1998 and during 1998-2008. Table 3. Geomorphologic changes at Karwar. Class Area (Km² ) 1981 Area (Km² ) 1998 Area (Km² ) 2008 Change in area (Km2) 1981-1998 Change in area (Km2) 1998-2008 tidal flat 3.397 4.333 4.272 0.936 –0.061 spit 0.814 0.729 0.601 –0.085 –0.128 marine island 0.187 0.187 0.187 0 0 sandy beach 0.505 0.622 0.513 0.117 –0.109 creek 2.490 1.959 1.462 –0.531 –0.497 coastal plain 0.694 0.707 0.771 0.013 0.064 channel island 0.165 0.242 0.261 0.077 0.019 alluvial plain 16.187 16.389 17.091 0.202 0.702  P. VINAYARAJ ET AL. Copyright © 2011 SciRes. IJG 391 Honnavar (1980-2008): In the case of tidal flat, it is observed that 1.189 Km² area got reduced during the period 1980 to 1998 and an area of 0.542 Km² increased during 1998 to 2008.The spit which lies on the southern side of the Sharavathi river grows 0.370 Km² towards north (Table 4). Geomorphology of this area shows the presence and gradual decrease in the area of sand bars and creek. Marine Island and Lateritic plain do not show any observable change at the location. Coastal plain co- vers the maximum area of Honnavar region, coastal plain increase the area from 1980 to 1998 and after that it shows decreasing trend. In the case of Ch annel Is lan d, it is show - ing an increasing trend in area from 1980 to 2008. Kundapur (1973-2008): Rocky beach, sand bar and allu- vial plane are the characteristics of Kundapur morphology. The area which covered by the tidal flat, decreased dur- ing 1973 to 1998 bu t 0.967 Km² area added during 1998 to 2008. Sand bar diminishes by an area of 0.227 Km² from 1973 to 1998, but after that it shows increasing trend from 1998 to 2008 (Table 5). No change can be detected in rocky beaches, marine Island and alluvial plain. It is detected that the coastal plain and channel Island gradually increases its area during 1973 to 1998. From 1998 to 2008, coastal plain area increased by 0.159 Km², but Channel Island shows a slight reduction in area from 1998 to 2008. Jayappa et al., [13] studied the area through remote sensing. Malpe (1977-2008): It is noticed that most of the study area of Malpe is covered by coastal plain, it shows some changes in the area too. Barrier spit on the southern side of the river mouth detected as increasing during 1998 to 2008 and decrease in area of 0.190 Km2 from 1977 to 1998 (Table 6). Area covered by creek reduced during the study period. Overall sand bar quantity in- creased during the study period. It is observed that the Channel Island of 0.055 Km² diminished. Table 4. Geomorphologic changes at honnavar. Class Area Km² 1979 Area Km² 1998 Area Km² 2008 Change in area Km2 1979-1998 Change in area Km2 1998-2008 tidal flat 2.085 0.896 1.438 –1.189 0.542 spit 1.515 1.886 1.819 0.371 –0.067 sandy beach 0.955 0.945 1.020 –0.01 0.075 sand bar 0.023 0.083 0.040 0.060 –0.043 marine island 0.202 0.164 0.166 –0.038 0.002 lateritic plain 16.956 16.956 16.956 0 0 creek 1.135 0.592 0.576 –0.543 –0.016 coastal plain 11.728 12.004 11.325 0.276 –0.679 channel island 0.995 1.166 1.272 0.171 0.106 Table 5. Geomorphologic changes at Kundapu r a. Class Area (Km²) 1973 Area (Km²) 1998 Area (Km²) 2008 Change in area (Km2) 1979-1998 Change in area (Km2) 1998-2008 tidal flat 2.581 2.050 3.018 –0.531 0.968 sand bar 0.296 0.069 1.083 –0.227 1.014 sandy beach 0.637 0.703 0.676 0.066 –0.027 rocky beach 0.027 0.027 0.027 0 0 marine island 0.052 0.052 0.052 0 0 lateritic plain 2.805 2.805 2.805 0 0 coastal plain 10.363 10.823 11.018 0.460 0.195 channel island 3.512 4.140 4.105 0.628 –0.035 alluvial plain 0.743 0.743 0.743 0 0  P. VINAYARAJ ET AL. Copyright © 2011 SciRes. IJG 392 Table 6. Geomorphologic changes at malpe. Class Area (Km²) 1977 Area (Km²) 1998 Area Km² 2008 Change in area Km2 1979-1998 Change in area Km2 1998-2008 sandy beach 1.123 0.978 1.267 –0.145 0.289 sand bar 0.307 0.204 0.362 –0.103 0.158 marine island 0.555 0.555 0.555 0 0 creek 0.689 0.420 0.320 –0.269 –0.100 coastal plain 23.318 23.168 23.440 –0.150 0.272 channel island 0.340 0.246 0.285 –0.094 0.039 barrier spit 1.002 0.812 0.938 –0.190 0.126 4. Conclusions This study investigates the coastal erosion and depo sition at four stations (Karwar, Ho n navar, Kundapur, and M a l pe) covering a period of almost thirty years along the Karna- taka, west coast of Ind ia. Both erosion and depo sition are observed at all the four stations. The erosion observed is not continuous all along the coast but in isolated stretches along the coast. Comparatively large erosion have been observed at the river mouths of Devbag (north of Kali River), at Pavinakurve (north of Sharavathi River) and at Kundapur. The coastline at Malpe is almost stable with negligible erosion and deposition. Significant amount of loss of land is observed mainly at the river mouth due to the sediment erosion from the banks because of complex interactions between river flow, waves and the tides. 5. Acknowledgements We thank Integrated Coastal and Marine Area Manage- ment Project Directorate (ICMAM PD), Ministry of Earth Sciences, New Delhi for funding the project. Director, National Institute of Oceanography, Goa and Project Di- rector, ICMAM PD, Chennai for the encouragement pro- vided to carry out the study. This is NIO contribution 4995. 6. References [1] M. M. Aidy, M. F. Giles and P. M. Atkinson, “Shoreline Mapping from Coarse—Spatial Resolution Remote Sen- sing Imagery of Seberang Takir, Malaysia,” Journal of Coastal Research, Vol. 23, No. 6, 2007, pp. 1399-1408. [2] N. Tirkey, R. S. Biradar, M. Pikle and S. Charatkar, “A Study on Shoreline Changes of Mumbai Coast Using Re- Mote Sensing and GIS,” Journal of Indian Society of Remote Sensing, Vol. 33, No. 1, 2005, pp. 85-91. doi:10.1007/BF02989995 [3] P. V. Vijayan, G. Bhat and M. S. Vinaya, “Long Term Morphological Changes of Shoreline and Estuaries along the Northern Kerala Coast—Remote Sensing and GIS Based Study,” In: K. S. Jayappa and A. C. Narayana, Eds., Coastal Environmental Problems and Perspectives, I.K. international Publishing House Pvt. Ltd., New Delhi, 2009, pp. 96-107. [4] S. Nayak, “Use of Satellite Data i n Coa stal Ma ppi ng,” 2002. http://www.incaindia.org/technicalpapers/24_CMMC01.pdf [5] O. E. Frihy and M. F. Lofty, “Shoreline Changes and Beach Sand Sorting along the Northern Sinai Coast of Egypt,” Geo-Marine Letters, Vol. 17, No. 2, 1997, pp. 140-146. doi:10.1007/s003670050019 [6] P. P. Rao, M. M. Nair and D. V. Raju, “Assesment of the Role of Remote Sensing Techniques in Monitoring Shoreline Changes: A Case Study of Kerala Coast,” In- ternational Journal of Remote Sensing, Vol. 6, No. 3-4, 1984, pp. 549-558. [7] A. S. Rajawat, M. Gupta, Y. Pradhan, A. V. Thomsakutty and S. Nayak, “Coastal Process along the Indian Coast— Case Studies Based on Synergistic Use of IRS-P4 and OCM and IRS-1C/1D data,” Indian Journal of Marine Science, Vol. 34, No. 4, 2005, pp. 459-472. [8] A. A. Aleshelkh, A. Ghorbanall and N. Nouri, “Coast- Line Change Detection Using Remote Sensing,” Interna- tional Journal of Environmental Science and Technology, Vol. 4, No. 1, 2007, pp. 61-66. [9] J. Dattatri, “Coastal Erosion and Protection along Karna- taka Coast,” Centre for Environmental Law, Education, Research and Advocacy (CEERA), The National Law School of India University, 2007. http://www. nlsenlaw.org/live/nlsenlaw/crz/articles [10] T. Hanamgond and D. Mitra, “Dynamics of the Karwar Coast, India, with Special Reference to Study of Tecton- ics and Coastal Evolution Using Remote Sensing,” Jour- nal of Coastal Research, Vol. 50, 2007, pp. 842-847. [11] E. P. Nobi, A. Shivaprasad, R. Kaikalan, E. Dilipan, T. Thangaradjou and K. Shivakumar, “Micro Level Map- ping of Coastal Geomorphology and Coastal Resources of Rameswaram, India—A Remote Sensing and GIS  P. VINAYARAJ ET AL. Copyright © 2011 SciRes. IJG 393 perspective,” Journal of Coastal Research, Vol. 26, No. 3, 2010, pp. 424-428. doi:10.2112/08-1119.1 [12] G. S. Dwarakish, S. A. Vinay, U. Natesan, T. Asano, T. Kakinuma, K. Venkitaramana, B. Jagadeesh Pai and M. K. Babitha, “Coastal Vulnerability Assessment of the Future Sea Level Rise in Udupi Coastal zone of Karna- taka State, west Coast of India,” Ocean and Coastal Ma- nagement, Vol. 52, No. 9, 2009, pp. 467-468. doi:10.1016/j.ocecoaman.2009.07.007 [13] V. K. Jayappa and A. Kumar, “Evolution of Coastal Landforms, Southern Karnataka—A Remote Sensing Approach,” In: K. S. Jayappa and A. C. Narayana, Eds., Coastal Environmental Problems and Perspectives, I.K. international Publishing House Pvt. Ltd., New Delhi, 2009, pp. 79-96. |