 Journal of Software Engineering and Applications, 2011, 4, 609-618 doi:10.4236/jsea.2011.411072 Published Online November 2011 (http://www.SciRP.org/journal/jsea) Copyright © 2011 SciRes. JSEA 609 Knowledge Management of Software Productivity and Development Time James A. Rodger, Pankaj Pankaj, Ata Nahouraii MIS and Decision Sciences, Eberly College of Business & Information Technology, Indiana University of Pennsylvania, Indiana, USA. Email: jrodger@iup.edu Received April 15th, 2011; revised September 20th, 2011; accepted September 30th, 2011. ABSTRACT In this paper, we identify a set of factors that may be used to forecast software productivity and software development time. Software productivity was measured in function points per person hours, and software development time was measured in number of elapsed days. Using field data on over 130 field software projects from various industries, we empirically test the impact of team size, integrated computer aided software engineering (ICASE) tools, software de- velopment type, software development platform, and programming language type on the software development produc- tivity and development time. Our results indicate that team size, software development type, software development plat- form, and programming language typ e significantly imp act softwa re developmen t productivity. However, only tea m size significantly impacts software development time. Our results indicate that effective management of software develop- ment teams, and using different management strategies for different software development type environments may im- prove software development productivity. Keywords: S oft ware En gi neering, Software Metrics, Fourth Generation Lan gua ges , CASE Tools, Field Study, Tools and Technique s , Models And Principles, Team Size, Volatility, Development Platform and Type, Productivity, Elapsed Development Time 1. Introduction Competition in software industry has increased signifi- cantly. One of the ways software companies can stay competitive is to improve software development produc- tivity of their software products. However, despite the advances in software development tools, development methodology and programming languages, research sh- ows that productivity improvements have either remain- ed the same or declined subs tantially [1]. Several studies in the literature have measured factors impacting either software productivity or software de- velopment time [2,3]. Blackburn et al. [4] argue that soft- ware productivity and software development time are not the same. For example, low productivity organizations can reduce the software development time by increasing the software development team size. While increasing the number of software developers to reduce software devel- opment time is an interesting option, Fried [5] argues that large teams increase the non-productive time due to in- creased communication and coordinati on requirem ents. Very few researchers have focused on developing mo- dels to understand the primary antecedents of software development productivity and software development time. In fact, we are not aware of any study that uses real- world data and investigates the impact of certain variab- les on both software development productivity and soft- ware development effort. For example, the Blackburn et al. [4] study uses survey data and measures managerial perceptions. Management of both software development producti- veity and software development time are of paramount importance. Effective management of software develop- ment productivity and software development time leads to a better competitive po sition for an organization [6]. In certain cases, managing software development time may lead to a lower likelihood of schedu le overrun and litiga- tion due to vi ol at i ons of cont r act ua l agreements. In this paper we investigate the impact of team size, ICASE tools, software development platform, software development type, and type of programming language on software development productivity and software devel- opment time. We use a real-world data set of 130 differ- ent software development projects. The projects in the data set were completed between years 1989-2001 in over 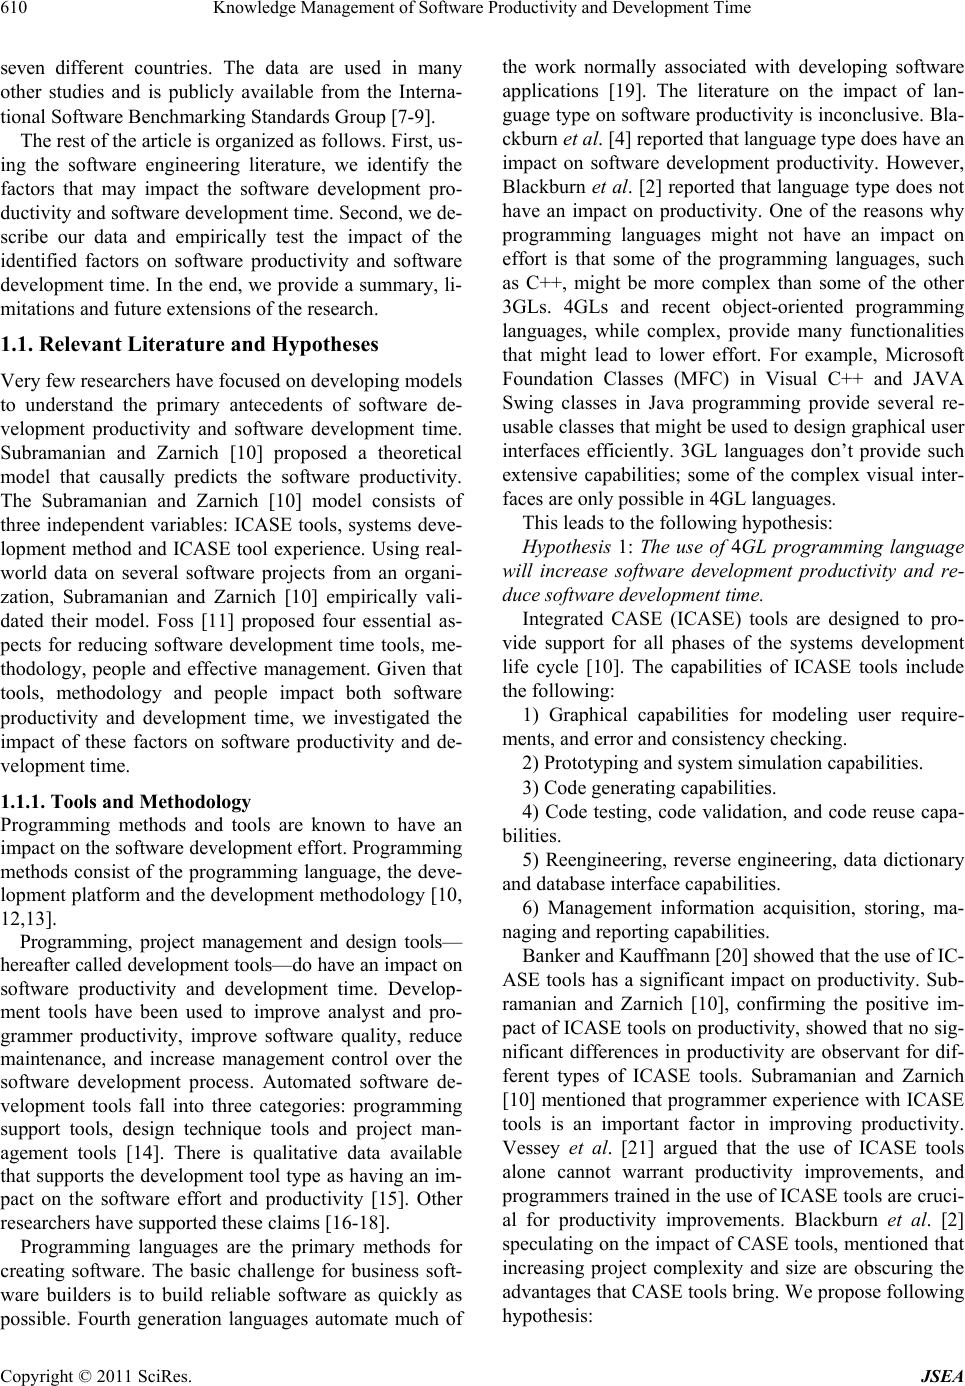 Knowledge Management of Software Produc t ivity and Development Time 610 seven different countries. The data are used in many other studies and is publicly available from the Interna- tional Software Benchmarking Standards Group [7-9]. The rest of the article is organized as follows. First, us- ing the software engineering literature, we identify the factors that may impact the software development pro- ductivity and so ftware development time. Second, we de- scribe our data and empirically test the impact of the identified factors on software productivity and software development time. In the end, we provide a summary, li- mitations and future extensions of the research. 1.1. Relevant Literature and Hypotheses Very few researchers have focused on developing models to understand the primary antecedents of software de- velopment productivity and software development time. Subramanian and Zarnich [10] proposed a theoretical model that causally predicts the software productivity. The Subramanian and Zarnich [10] model consists of three independent variables: ICASE tools, systems deve- lopment method and ICASE tool experience. Using real- world data on several software projects from an organi- zation, Subramanian and Zarnich [10] empirically vali- dated their model. Foss [11] proposed four essential as- pects for reducing software development time tools, me- thodology, people and effective management. Given that tools, methodology and people impact both software productivity and development time, we investigated the impact of these factors on software productivity and de- velopment time. 1.1.1. Tools and Methodology Programming methods and tools are known to have an impact on the software development effort. Programming methods consist of the programming language, the deve- lopment platform and the development methodology [10, 12,13]. Programming, project management and design tools— hereafter called development tools—do have an impact on software productivity and development time. Develop- ment tools have been used to improve analyst and pro- grammer productivity, improve software quality, reduce maintenance, and increase management control over the software development process. Automated software de- velopment tools fall into three categories: programming support tools, design technique tools and project man- agement tools [14]. There is qualitative data available that supports the development tool type as having an im- pact on the software effort and productivity [15]. Other researchers have supported these claims [16-18]. Programming languages are the primary methods for creating software. The basic challenge for business soft- ware builders is to build reliable software as quickly as possible. Fourth generation languages automate much of the work normally associated with developing software applications [19]. The literature on the impact of lan- guage type on software productiv ity is inconclusive. Bla- ckburn et al. [4] reported that language type does have an impact on software development productivity. However, Blackburn et al. [2] reported that language type does not have an impact on productivity. One of the reasons why programming languages might not have an impact on effort is that some of the programming languages, such as C++, might be more complex than some of the other 3GLs. 4GLs and recent object-oriented programming languages, while complex, provide many functionalities that might lead to lower effort. For example, Microsoft Foundation Classes (MFC) in Visual C++ and JAVA Swing classes in Java programming provide several re- usable classes that might be used to design graphical user interfaces efficiently. 3GL languages don’t provide such extensive capabilities; some of the complex visual inter- faces are only p o ssible in 4GL languages. This leads to the following hypothesis: Hypothesis 1: The use of 4GL programming language will increase software development productivity and re- duce software development time. Integrated CASE (ICASE) tools are designed to pro- vide support for all phases of the systems development life cycle [10]. The capabilities of ICASE tools include the following: 1) Graphical capabilities for modeling user require- ments, and error and consistency checking. 2) Prototyping and system simulation cap abilities. 3) Code generating capa bilities. 4) Code testing, code validation, and code reuse capa- bilities. 5) Reengineering, reverse engineering, data dictionary and database interface capabilities. 6) Management information acquisition, storing, ma- naging and reporting capabilities. Banker and Kauffmann [20] showed that the use of IC- ASE tools has a significant impact on productivity. Sub- ramanian and Zarnich [10], confirming the positive im- pact of ICASE tools on productiv ity, showed that no sig- nificant differences in productivity are observant for dif- ferent types of ICASE tools. Subramanian and Zarnich [10] mentioned that programmer experience with ICASE tools is an important factor in improving productivity. Vessey et al. [21] argued that the use of ICASE tools alone cannot warrant productivity improvements, and programmers trained in the use of ICASE tools are cruci- al for productivity improvements. Blackburn et al. [2] speculating on the impact of CASE tools, mentioned that increasing project complexity and size are obscuring the advantages that CA SE tools bring . We propose fo llowing hypothesis: Copyright © 2011 SciRes. JSEA 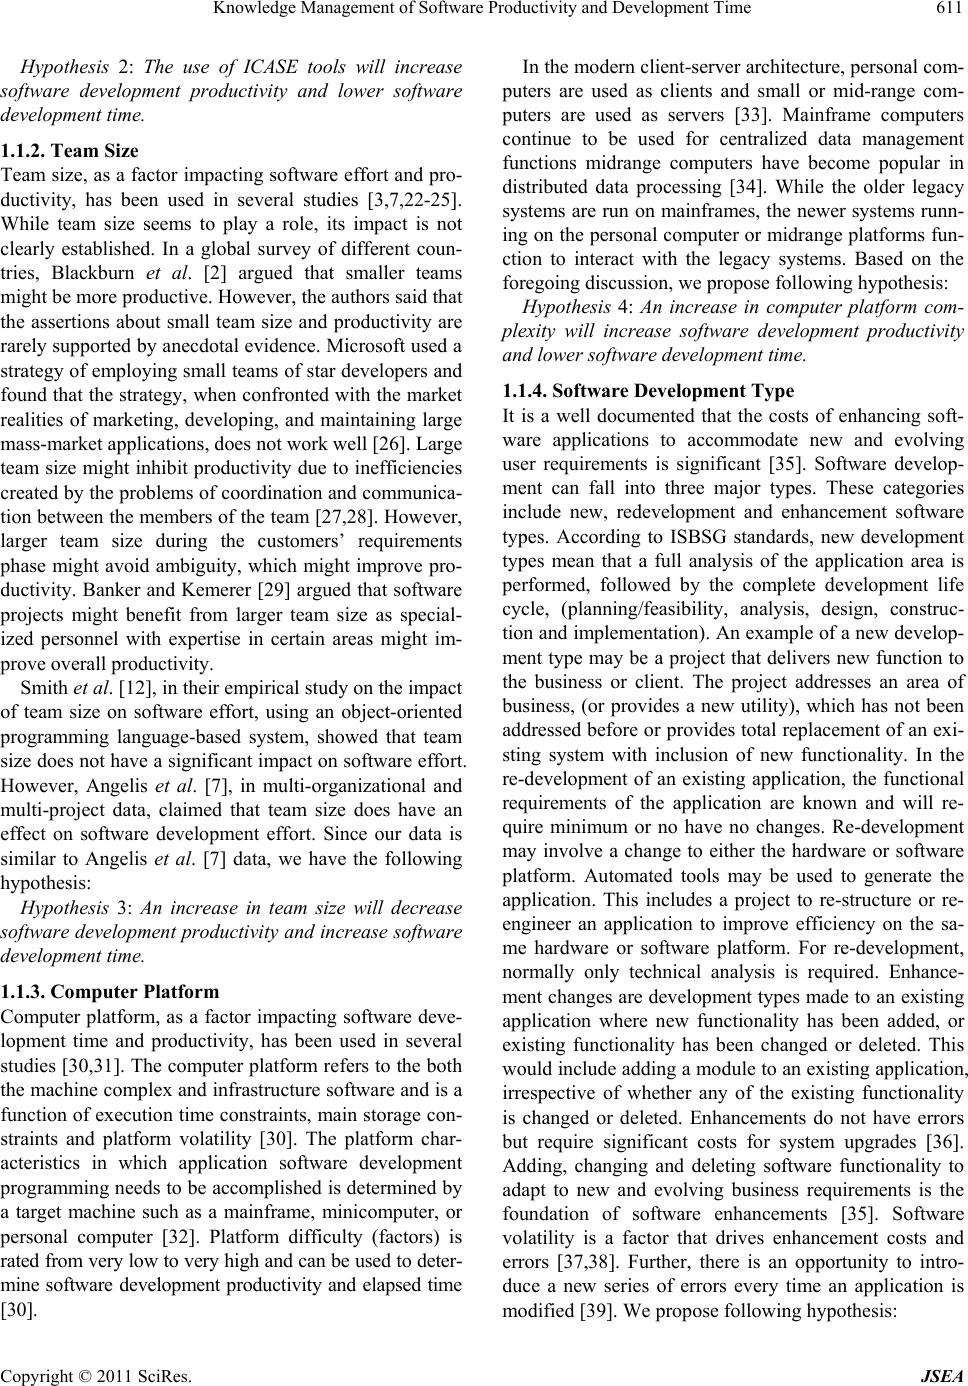 Knowledge Management of Software Productivity and Development Time611 Hypothesis 2: The use of ICASE tools will increase software development productivity and lower software development time. 1.1.2. Team Size Team size, as a factor impacting software effort and pro- ductivity, has been used in several studies [3,7,22-25]. While team size seems to play a role, its impact is not clearly established. In a global survey of different coun- tries, Blackburn et al. [2] argued that smaller teams might be more productive. However, the authors said that the assertions about small team size and productivity are rarely supported by anecdotal evid ence. Microsoft used a strategy of employing small teams of star developers and found that the strategy, when confronted with the market realities of marketing, developing, and maintaining large mass-market applications, does not work well [26]. Large team size might inhibit productivity due to inefficiencies created by the problems of coordination and communica- tion between the members of the team [27,28]. However, larger team size during the customers’ requirements phase might avoid ambiguity, which might improve pro- ductivity. Banker and Kemerer [29] argued that software projects might benefit from larger team size as special- ized personnel with expertise in certain areas might im- prove overall productivity. Smith et al. [12], in their empirical study on the impact of team size on software effort, using an object-oriented programming language-based system, showed that team size does not have a significant impact on software effort. However, Angelis et al. [7], in multi-organizational and multi-project data, claimed that team size does have an effect on software development effort. Since our data is similar to Angelis et al. [7] data, we have the following hypothesis: Hypothesis 3: An increase in team size will decrease software development productivity and increase software development time. 1.1.3. Computer Platform Computer platform, as a factor impacting software deve- lopment time and productivity, has been used in several studies [30,31]. The computer platform refers to the both the machine complex and infrastructure software and is a function of execution time constraints, main storage con- straints and platform volatility [30]. The platform char- acteristics in which application software development programming needs to be accomplished is determined by a target machine such as a mainframe, minicomputer, or personal computer [32]. Platform difficulty (factors) is rated from very low to very high and can be used to deter- mine software development productivity and elapsed time [30]. In the modern client-server architecture, personal com- puters are used as clients and small or mid-range com- puters are used as servers [33]. Mainframe computers continue to be used for centralized data management functions midrange computers have become popular in distributed data processing [34]. While the older legacy systems are run on mainframes, the newer systems runn- ing on the personal computer or midrange platforms fun- ction to interact with the legacy systems. Based on the foregoing discu ssion, we propose following h ypothesis: Hypothesis 4: An increase in computer platform com- plexity will increase software development productivity and lower software development time. 1.1.4. Software Development Type It is a well documented that the costs of enhancing soft- ware applications to accommodate new and evolving user requirements is significant [35]. Software develop- ment can fall into three major types. These categories include new, redevelopment and enhancement software types. According to ISBSG standards, new development types mean that a full analysis of the application area is performed, followed by the complete development life cycle, (planning/feasibility, analysis, design, construc- tion and implementation). An example of a new develop- ment type may be a project that delivers new function to the business or client. The project addresses an area of business, (or provides a new utility), which has not been addressed before or provides total replacement of an exi- sting system with inclusion of new functionality. In the re-development of an existing application, the functional requirements of the application are known and will re- quire minimum or no have no changes. Re-development may involve a change to either the hardware or software platform. Automated tools may be used to generate the application. This includes a project to re-structure or re- engineer an application to improve efficiency on the sa- me hardware or software platform. For re-development, normally only technical analysis is required. Enhance- ment changes are development types made to an existing application where new functionality has been added, or existing functionality has been changed or deleted. This would include adding a module to an existing application, irrespective of whether any of the existing functionality is changed or deleted. Enhancements do not have errors but require significant costs for system upgrades [36]. Adding, changing and deleting software functionality to adapt to new and evolving business requirements is the foundation of software enhancements [35]. Software volatility is a factor that drives enhancement costs and errors [37,38]. Further, there is an opportunity to intro- duce a new series of errors every time an application is modified [39]. We propose followin g hy p ot h esis: Copyright © 2011 SciRes. JSEA  Knowledge Management of Software Produc t ivity and Development Time 612 Hypothesis 5: An increase in software volatility will decrease software development productivity and increase software development time . Manova is used to test the resulting model seen in Figure 1. 2. Data and Experiments We obtained the data on 1238 software projects from In- ternational Software Benchmarking Standards Group (IS- BSG). The ISBSG (release 7) data are used by several companies for benchmarking software projects and are available in the public domain. The ISBSG procedures encourage software development teams to submit their project data to the repository in return for a free report, which graphically benchmarks their projects against si- milarly profiled projects in the ISBSG repository [7]. The software project data typically are submitted by the soft- ware project manager, who completes a series of special ISBSG data validation forms to report the confidence he/she has in the information he/she provides. ISBSG has developed a special mutually exclusive data quality rat- ing that reflects the quality of data related to any given project. Each project is assigned a data quality rating of A, B, and C to denote the fo llowing: A = The project data satisfies all the criteria for seemingly sound data. B = The project data appears fundamentally sound, but some data attributes mig ht not be fun- damentally sound. C = The project data has some fund amental short- comings. Companies participating in ISBSG benchmarking ac- quired project data in several different ways. FP data on Elapsed Time/ Productivity Development Platform Development Type Volatili ty H3 H1 H2 H5 H4 Team Size Development Language ICASE Figure 1. Determinants of elapsed software development time and productivity. the projects were acquired mostly by an automated proc- ess (about 40%) or obtained from the development tools (about 21%). The software effort data were mostly re- corded (about 59%). In certain cases, the software effort data were derived from the actual project cost (about 13%). In many cases, the data acquisition procedures were miss- ing or unknown. The software projects in ISBSG release 7 data came from 20 different countries. Figure 2 illustrates the major data-contributing countries. The top three known contri- buting countries were the United States, Australia and Canada. Over 97% of the projects were completed be- tween the years 1989-2001. Most of the projects (about 50%) were completed between the years 1999-2001. Figure 3 illustrates the data quality rating of the ISBSG release 7 data on the 1238 projects, and Figure 4 illus- trates the industry type distribution for the 1238 projects. The ISBSG data set included data on integrated CASE tools, programming languages, development type, de- velopment platform, elapsed time, productivity and team size. Of the total 1238 software projects, only 138 pro- jects had complete data on all five independent and de- pendent variables for investigating elapsed time and pro- ductivity. For the elapsed time and productivity model, we used all 138 projects, respectively, in our analysis. Figure 2. ISBSG release 7 project data origin by country. Figure 3. Data quality distribution of the ISBSG release 7 project data. Copyright © 2011 SciRes. JSEA 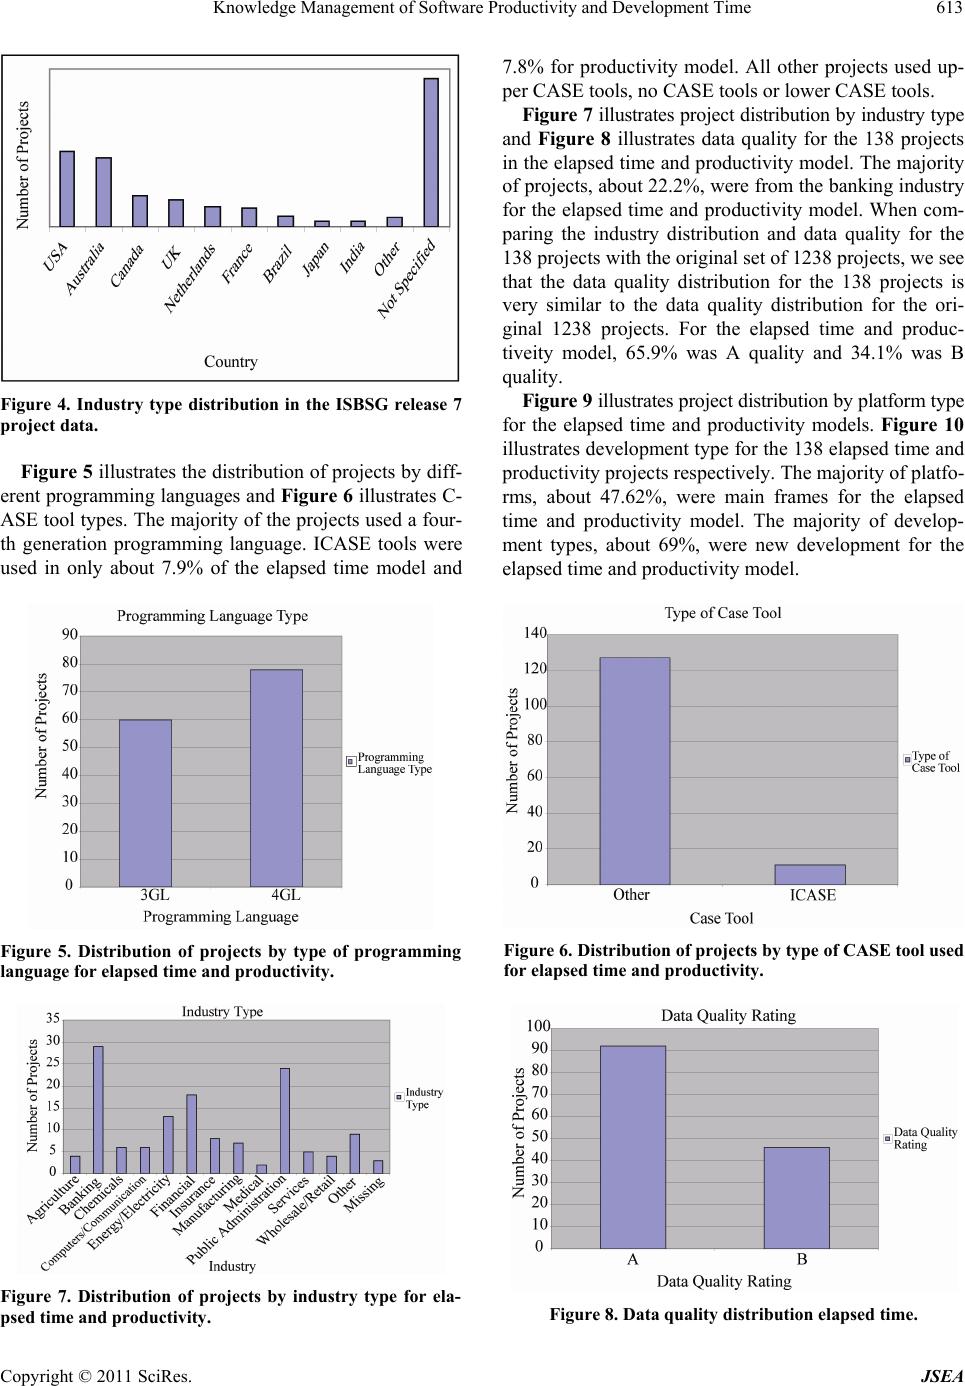 Knowledge Management of Software Productivity and Development Time Copyright © 2011 SciRes. JSEA 613 7.8% for productivity model. All other projects used up- per CASE tools, no CASE tools or lower CASE tools. Figure 7 illustrates project distribution by industry type and Figure 8 illustrates data quality for the 138 projects in the elapsed time and productiv ity model. The majority of projects, about 22.2%, were from the banking industry for the elapsed time and pro ductivity model. When com- paring the industry distribution and data quality for the 138 projects with the original set of 1238 projects, we see that the data quality distribution for the 138 projects is very similar to the data quality distribution for the ori- ginal 1238 projects. For the elapsed time and produc- tiveity model, 65.9% was A quality and 34.1% was B quality. Figure 9 illustrates project distribution by platform type for the elapsed time and productivity models. Figure 10 illustrates development type for the 138 elapsed time and productivity projects respectively. The majority of platfo- rms, about 47.62%, were main frames for the elapsed time and productivity model. The majority of develop- ment types, about 69%, were new development for the elapsed time and productivity model. Figure 4. Industry type distribution in the ISBSG release 7 project data. Figure 5 illustrates the distribution of projects by diff- erent programming languages and Figure 6 illustrates C- ASE tool types. The majority o f the project s used a four- th generation programming language. ICASE tools were used in only about 7.9% of the elapsed time model and Figure 6. Distribution of projects by type of CASE tool use d for elapsed time and productivity. Figure 5. Distribution of projects by type of programming language for elapsed time and productivity. Figure 7. Distribution of projects by industry type for ela- psed time and productivity. Figure 8. Data quality distribution e l apse d time. 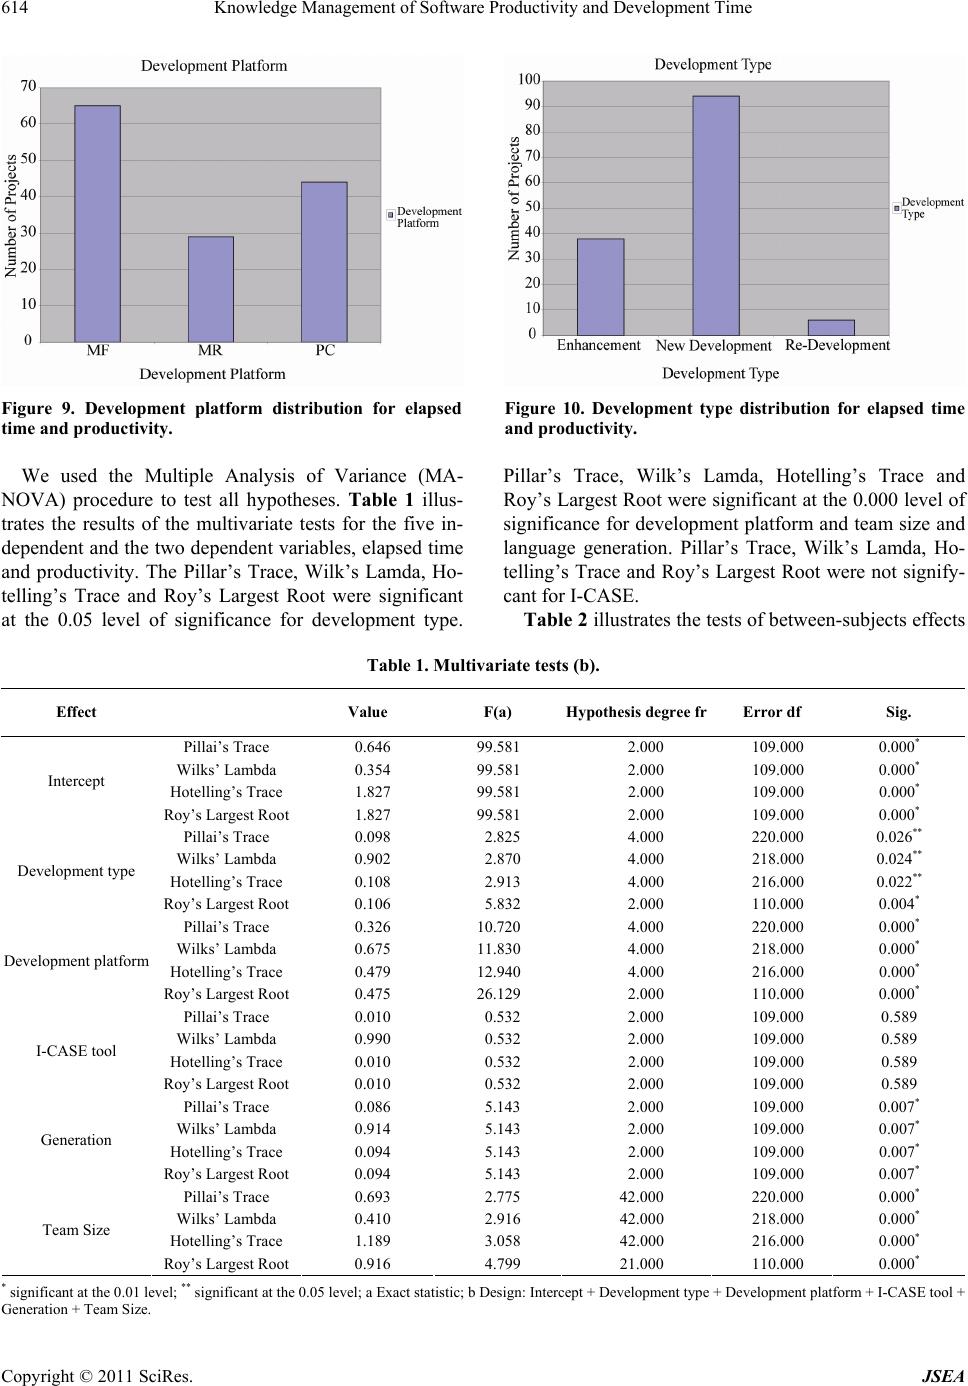 Knowledge Management of Software Produc t ivity and Development Time 614 Figure 9. Development platform distribution for elapsed time and productivity. Figure 10. Development type distribution for elapsed time and productivity. We used the Multiple Analysis of Variance (MA- NOVA) procedure to test all hypotheses. Table 1 illus- trates the results of the multivariate tests for the five in- dependent and the two dependent variables, elapsed time and productivity. The Pillar’s Trace, Wilk’s Lamda, Ho- telling’s Trace and Roy’s Largest Root were significant at the 0.05 level of significance for development type. Pillar’s Trace, Wilk’s Lamda, Hotelling’s Trace and Roy’s Largest Root were significant at the 0.000 level of significance for development platform and team size and language generation. Pillar’s Trace, Wilk’s Lamda, Ho- telling’s Trace and Roy’s Largest Root were not signify- cant for I-CASE. Table 2 illustrates the tests of between-subjects effects Table 1. Multivariate tests (b). Effect Value F(a) Hypothesis degree frError df Sig. Pillai’s Trace 0.646 99.581 2.000 109.000 0.000* Wilks’ Lambda 0.354 99.581 2.000 109.000 0.000* Hotelling’s Trace 1.827 99.581 2.000 109.000 0.000* Intercept Roy’s Largest Root 1.827 99.581 2.000 109.000 0.000* Pillai’s Trace 0.098 2.825 4.000 220.000 0.026** Wilks’ Lambda 0.902 2.870 4.000 218.000 0.024** Hotelling’s Trace 0.108 2.913 4.000 216.000 0.022** Development type Roy’s Largest Root 0.106 5.832 2.000 110.000 0.004* Pillai’s Trace 0.326 10.720 4.000 220.000 0.000* Wilks’ Lambda 0.675 11.830 4.000 218.000 0.000* Hotelling’s Trace 0.479 12.940 4.000 216.000 0.000* Development platform Roy’s Largest Root 0.475 26.129 2.000 110.000 0.000* Pillai’s Trace 0.010 0.532 2.000 109.000 0.589 Wilks’ Lambda 0.990 0.532 2.000 109.000 0.589 Hotelling’s Trace 0.010 0.532 2.000 109.000 0.589 I-CASE tool Roy’s Largest Root 0.010 0.532 2.000 109.000 0.589 Pillai’s Trace 0.086 5.143 2.000 109.000 0.007* Wilks’ Lambda 0.914 5.143 2.000 109.000 0.007* Hotelling’s Trace 0.094 5.143 2.000 109.000 0.007* Generation Roy’s Largest Root 0.094 5.143 2.000 109.000 0.007* Pillai’s Trace 0.693 2.775 42.000 220.000 0.000* Wilks’ Lambda 0.410 2.916 42.000 218.000 0.000* Hotelling’s Trace 1.189 3.058 42.000 216.000 0.000* Team Size Roy’s Largest Root 0.916 4.799 21.000 110.000 0.000* * significant at the 0.01 level; ** significant at the 0.05 level; a Exact statistic; b Design: Intercept + Developm ent type + Development platform + I-CASE tool + Generation + Team Size. Copyright © 2011 SciRes. JSEA 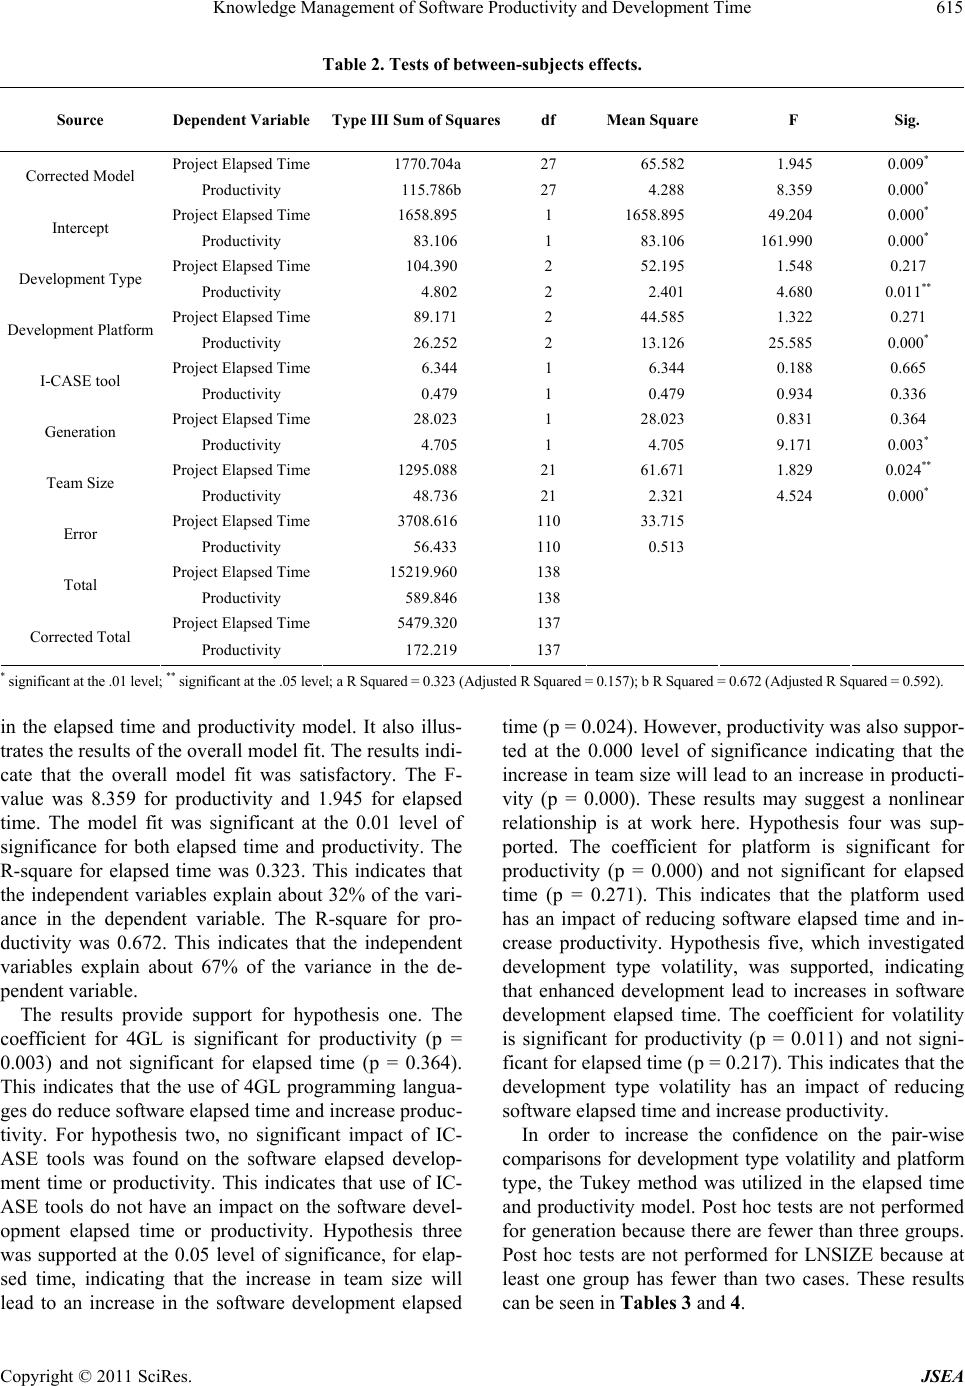 Knowledge Management of Software Productivity and Development Time615 Table 2. Tests of between-subjects effects. Source Dependent Variable Type III Sum of Squaresdf Mean Square F Sig. Project Elapsed Time 1770.704a 27 65.582 1.945 0.009* Corrected Model Productivity 115.786b 27 4.288 8.359 0.000* Project Elapsed Tim e 1658.895 1 1658.895 49.204 0.000* Intercept Productivity 83.106 1 83.106 161.990 0.000* Project Elapsed Time 104 .390 2 52.195 1.548 0.217 Development Type Productivity 4.802 2 2.401 4.680 0.011** Project Elapsed Time 89.171 2 44.585 1.322 0.271 Development Platform Productivity 26.252 2 13.126 25.585 0.000* Project Elapsed Time 6.344 1 6.344 0.188 0.665 I-CASE tool Productivity 0.479 1 0.479 0.934 0.336 Project Elapsed Time 28.023 1 28.023 0.831 0.364 Generation Productivity 4.705 1 4.705 9.171 0.003* Project Elapsed Time 1295.088 21 61.671 1.829 0.024** Team Size Productivity 48.736 21 2.321 4.524 0.000* Project Elapsed Time 3708.616 110 33.715 Error Productivity 56.433 110 0.513 Project Elapsed Time 15219.960 138 Total Productivity 589.846 138 Project Elapsed Time 5479.320 137 Corrected Total Productivity 172.219 137 * significant a t the .01 le vel; ** significant a t the .05 level; a R Squared = 0.323 (Adjusted R Squared = 0.157); b R Squared = 0.672 (Adjusted R Squared = 0.592). in the elapsed time and productivity model. It also illus- trates the results of the overall model fit. Th e resu lts indi- cate that the overall model fit was satisfactory. The F- value was 8.359 for productivity and 1.945 for elapsed time. The model fit was significant at the 0.01 level of significance for both elapsed time and productivity. The R-square for elapsed time was 0.323. This indicates that the independent variables explain about 32% of the vari- ance in the dependent variable. The R-square for pro- ductivity was 0.672. This indicates that the independent variables explain about 67% of the variance in the de- pendent variable. The results provide support for hypothesis one. The coefficient for 4GL is significant for productivity (p = 0.003) and not significant for elapsed time (p = 0.364). This indicates that the use of 4GL programming langua- ges do reduce software elapsed time and increase produc- tivity. For hypothesis two, no significant impact of IC- ASE tools was found on the software elapsed develop- ment time or productivity. This indicates that use of IC- ASE tools do not have an impact on the software devel- opment elapsed time or productivity. Hypothesis three was supported at the 0.05 level of significance, for elap- sed time, indicating that the increase in team size will lead to an increase in the software development elapsed time (p = 0.024). However, productivity was also suppor- ted at the 0.000 level of significance indicating that the increase in team size will lead to an increase in producti- vity (p = 0.000). These results may suggest a nonlinear relationship is at work here. Hypothesis four was sup- ported. The coefficient for platform is significant for productivity (p = 0.000) and not significant for elapsed time (p = 0.271). This indicates that the platform used has an impact of reducing software elapsed time and in- crease productivity. Hypothesis five, which investigated development type volatility, was supported, indicating that enhanced development lead to increases in software development elapsed time. The coefficient for volatility is significant for productivity (p = 0.011) and not signi- ficant for elapsed time (p = 0.217). This indicates that the development type volatility has an impact of reducing software elapsed time and increase productivity. In order to increase the confidence on the pair-wise comparisons for development type volatility and platform type, the Tukey method was utilized in the elapsed time and productivity model. Post hoc tests are not performed for generation because there are fewer than three groups. Post hoc tests are not performed for LNSIZE because at least one group has fewer than two cases. These results can be seen in Tables 3 and 4. Copyright © 2011 SciRes. JSEA 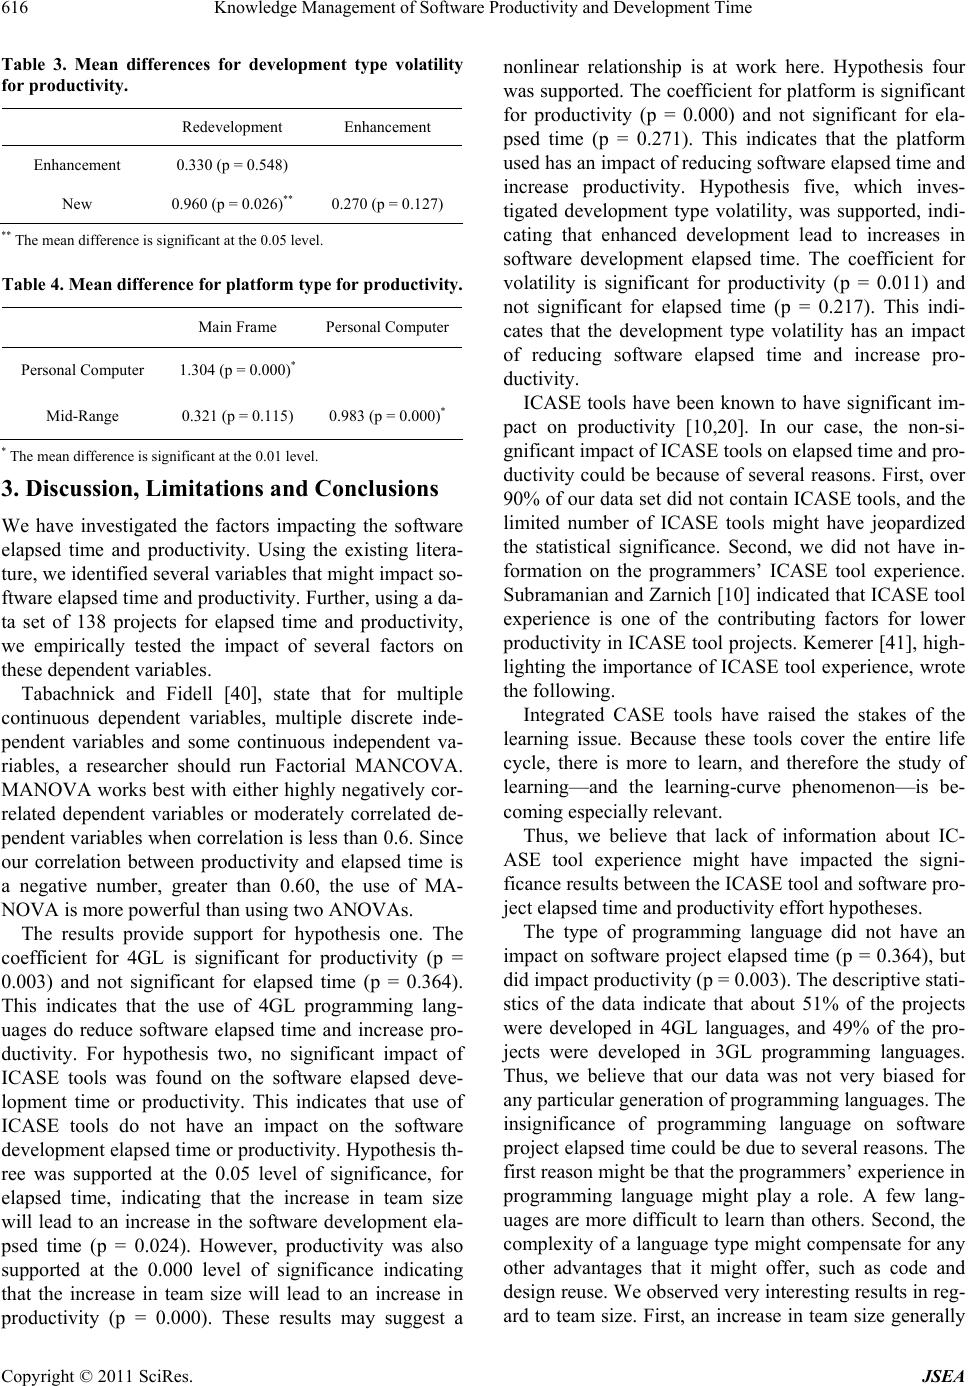 Knowledge Management of Software Produc t ivity and Development Time 616 Table 3. Mean differences for development type volatility for productivity. Redevelopment Enhancement Enhancement 0.330 (p = 0.548) New 0.960 (p = 0.026)** 0.270 (p = 0.127) ** The mean difference is significant at the 0.05 level. Table 4. Mean difference for platform type for productivity. Main Frame Personal Computer Personal Comput e r 1.304 (p = 0.000)* Mid-Range 0.321 (p = 0.115) 0.983 (p = 0.000)* * The mean difference is significant at the 0.01 level. 3. Discussion, Limitations and Conclusions We have investigated the factors impacting the software elapsed time and productivity. Using the existing litera- ture, we identified several variables that might impact so- ftware elapsed time and productiv ity. Further, u sing a da- ta set of 138 projects for elapsed time and productivity, we empirically tested the impact of several factors on these dependent variables. Tabachnick and Fidell [40], state that for multiple continuous dependent variables, multiple discrete inde- pendent variables and some continuous independent va- riables, a researcher should run Factorial MANCOVA. MANOVA works best with either highly negatively cor- related dependent variables or moderately correlated de- pendent variables when correlation is less than 0.6. Sin ce our correlation between productivity and elapsed time is a negative number, greater than 0.60, the use of MA- NOVA is more powerful than u sing two ANOVAs. The results provide support for hypothesis one. The coefficient for 4GL is significant for productivity (p = 0.003) and not significant for elapsed time (p = 0.364). This indicates that the use of 4GL programming lang- uages do reduce software elapsed time and increase pro- ductivity. For hypothesis two, no significant impact of ICASE tools was found on the software elapsed deve- lopment time or productivity. This indicates that use of ICASE tools do not have an impact on the software development elapsed time or productivity. Hypothesis th- ree was supported at the 0.05 level of significance, for elapsed time, indicating that the increase in team size will lead to an increase in the software development ela- psed time (p = 0.024). However, productivity was also supported at the 0.000 level of significance indicating that the increase in team size will lead to an increase in productivity (p = 0.000). These results may suggest a nonlinear relationship is at work here. Hypothesis four was supported. The coefficient for platform is significant for productivity (p = 0.000) and not significant for ela- psed time (p = 0.271). This indicates that the platform used has an impact of reducing software elapsed time and increase productivity. Hypothesis five, which inves- tigated development type volatility, was supported, indi- cating that enhanced development lead to increases in software development elapsed time. The coefficient for volatility is significant for productivity (p = 0.011) and not significant for elapsed time (p = 0.217). This indi- cates that the development type volatility has an impact of reducing software elapsed time and increase pro- ductivity. ICASE tools have been known to have significant im- pact on productivity [10,20]. In our case, the non-si- gnificant impact of ICASE tools on elapsed time and pro- ductivity could be because of several reasons. First, over 90% of our data set did not contain ICASE tools, and the limited number of ICASE tools might have jeopardized the statistical significance. Second, we did not have in- formation on the programmers’ ICASE tool experience. Subramanian and Zarnich [10] indicated that ICASE tool experience is one of the contributing factors for lower productivity in ICASE tool projects. Kemerer [41], high- lighting the importance of ICASE tool experience, wrote the following. Integrated CASE tools have raised the stakes of the learning issue. Because these tools cover the entire life cycle, there is more to learn, and therefore the study of learning—and the learning-curve phenomenon—is be- coming especially relevant. Thus, we believe that lack of information about IC- ASE tool experience might have impacted the signi- ficance results between the ICASE tool and software pro- ject elapsed time and productivity effort hypotheses. The type of programming language did not have an impact on software project elapsed time (p = 0.364), but did impact productivity (p = 0.003). The descriptive stati- stics of the data indicate that about 51% of the projects were developed in 4GL languages, and 49% of the pro- jects were developed in 3GL programming languages. Thus, we believe that our data was not very biased for any particular generation of programming languages. The insignificance of programming language on software project elapsed time could be due to several reasons. The first reason might be that the programmers’ experience in programming language might play a role. A few lang- uages are more difficult to learn than others. Second, the complexity of a language type might compensate for any other advantages that it might offer, such as code and design reuse. We observed very interesting results in reg- ard to team size. First, an increase in team size generally Copyright © 2011 SciRes. JSEA  Knowledge Management of Software Productivity and Development Time617 leads to higher software project elapsed time and decrea- sed productivity. This increase in software project elap- sed time might be due to increased communication requi- rements that in turn lead to decreased overall produc- tivity. The heterogeneity of software project elapsed time, de- velopment effort recording techniques, and data quality of projects improve the external validity of our study at the expense of internal validity of the study. Given that our data came from multiple projects and multiple organiza- tions, heterogeneity was expected. We do, however, note that there may be certain limitations related to the inter- nal validity of the study. There may be other factors that may limit the generalization of the results of our study. First, we had very few ICASE tools in our data set, whi- ch might have had an impact on both internal and exter- nal validity of hypotheses related to ICASE tools. Second, we did not have programmers’ experience information on ICASE tools and programming languages, which is kn- own to have an impact on the software development ef- fort. Third, the non-parametric dataset and parametric regression model might have provided us a lower fit, and the regression results might in fact be improved by using non-parametric models. Since our data is available in the public domain, we believe that future research may add- ress some of these issues. REFERENCES [1] R. L. Glass, “The Realities of Software Technology Pay- offs,” Communications of the ACM, Vol. 42, No. 2, 1999, pp. 74-79. doi:10.1145/293411.293481 [2] J. D. Blackburn, G. D. Scudder and L. N. Van Wassen- hove, “Improving Speed and Productivity of Software Development: A Global Survey of Software Developers,” IEEE Transactions on Software Engineering, Vol. 22, No. 12, 1996, pp. 875-885. doi:10.1109/32.553636 [3] R. Banker and S. A. Slaughter, “A Field Study of Scale Economies in Software Maintenance,” Management Sci- ence, Vol. 43, No. 12, 1997, pp. 1709-1725. doi:10.1287/mnsc.43.12.1709 [4] J. Blackburn, G. Scudder, L. Van Wassenhove and C. Hill, “Time Based Software Development,” Integrated Manu- facturing Systems, Vol. 7, No. 2, 1996a, pp. 35-45. doi:10.1108/09576069610111918 [5] L. Fried, “Team Size and Productivity in Systems De- velopment,” Journal of Information Systems Manage- ment, Vol. 8, No. 3, 1991, pp. 27-41. doi:10.1080/07399019108964994 [6] P. C. Pendharkar and J. A. Rodger, “A Probabilistic Model and a Belief Updating Procedure for Predicting Software Development Effort,” IEEE Transactions on Software Engineerin g, Vol. 31, No. 7, 2005, pp. 615-624. doi:10.1109/TSE.2005.75 [7] L. Angelis, I. Stamelos and M. Morisio, “Building a Software Cost Estimation Model Based on Categorical Data,” Proceedings of Seventh International Software Metrics Symposium, London, UK, 2001, pp. 4-15. [8] C. J. Lokan, “An Empirical Analysis of Function Point Adjustment Factors,” Information and Software Tech- nology, Vol. 42, 2000, pp. 649-660. doi:10.1016/S0950-5849(00)00108-7 [9] I. Stamelos, L. Angelis, M. Morisio, E. Sakellaris and G. L. Bleris, “Estimating the Development Cost of Custom Software,” Information & Management, Vol. 40, 2003, pp. 729-741. doi:10.1016/S0378-7206(02)00099-X [10] G. H. Subramanian and G. E. Zarnich, “An Examination of Some Software Development Effort and Productivity Determinants in ICASE Tool Projects,” Journal of Man- agement Information Systems, Vol. 12, No. 14, 1996, pp. 143-160. [11] W. B. Foss, “Fast, Faster, Fastest Development,” Com- puterworld, Vol. 27, No. 22, 1993, pp. 81-83. [12] R. K. Smith, J. F. Hale and A. S. Parrish, “An Empirical Study Using Task Assignment Patterns to Improve the Accuracy of Software Effort Estimation,” IEEE Transac- tions on Software Engineering, Vol. 27, No. 3, 2001. doi:10.1109/32.910861 [13] C. D. Wrigley and A. S. Dexter, “A Model of Measuring Information System Size,” MIS Quaterly, Vol. 15, No. 2, 1991, pp. 245-257. doi:10.2307/249386 [14] W. Gregory and W. Wojtkowski, “Applications Software Programming with Fourth-Generation Languages,” Boyd and Fraser, Boston, 1990. [15] M. A. Cusumano and C. E. Kemerer, “A Quantitative Analysis of U.S. and Japanese Practice and Performance in Software Development,” Management Science, Vol. 16, No. 11, 1990, pp. 1384-1406. doi:10.1287/mnsc.36.11.1384 [16] G. Gamota and W. Frieman, “Gaining Ground: Japan’s Strides in Science and Technology,” Ballinger, Cam- bridge, 1988. [17] C. Johnson, “Software in Japan,” Electronic Engineering Times, 1985, p. 1. [18] M. V. Zelkowitz, et al., “Software Engineering Practices in the U.S. and Japan,” IEEE Computer, 1984, pp. 57-66. [19] P. Mimno, “Power to the Users,” Computerworld, 1985, pp. 11-28. [20] R. D. Banker and R. J. Kauffman, “Reuse and Productivity in Integrated Computer-Aided Software Engineering: An Em- pirical Study,” MIS Quarterly, Vol. 15, No. 3, 1991, pp. 375-401. doi:10.2307/249649 [21] I. Vessey, S. L. Jarve npaa and N. Tractinsky, “Evaluation of Vendor Products: CASE Tools as Methodology Companions,” Communications of the ACM, Vol. 35, No. 4, 1992, pp. 90-105. doi:10.1145/129852.129860 [22] G. R. Finne, G. E. Witting and J. M. Dersharnais, “Es- timation Software Development Effort with Case-Based Reasoning,” The 2nd International Conference on Case- Based Reasoning (ICCBR-97), Providence, 1997, pp. 13-32. Copyright © 2011 SciRes. JSEA  Knowledge Management of Software Produc t ivity and Development Time Copyright © 2011 SciRes. JSEA 618 [23] T. E. Hastings and A. S. Sajeev, “A Vector-Based Approach to Software Size Measurement and Effort Esti- mation.” IEEE Transactions on Software Engineering, Vol. 27, No. 4, 2001, pp. 337-350. doi:10.1109/32.917523 [24] E. S. June and J. K. Lee, “Quasi-Optimal Case Selective Neural Network Model for Software Effort Estimation,” Expert Systems with Application, Vol. 21, 2001, pp. 1-14. doi:10.1016/S0957-4174(01)00021-5 [25] K. Sengupta, T. K. Abdel-Hamid and M. Bosley, “Coping with Staffing Delays in Software Project Management: An Experimental Investigation,” IEEE Transactions on Systems, Man and Cybernetics-Part A: Systems and Hu- mans, Vol. 29, No. 1, 1999, pp. 77-91. doi:10.1109/3468.736362 [26] C. F. Kemerer, “Progress, Obstacles, and Opportunities in Software Engineering Economics,” Communications of the ACM, Vol. 41, No. 8, 1998, pp. 63-66. doi:10.1145/280324.280334 [27] P. C. Pendharkar and J. A. Rodger, “An Empirical Study of the Impact of Team Size on Software Development Effort,” Information Technology and Management, 2007. [28] P. C. Pendharkar and J. A. Rodger, “The Relationship between Software Development Team Size and Software Development Cost,” Communications of the ACM, forth- coming, 2007. [29] R. D. Banker and C. F. Kemerer, “Scale Economies in New Software Development,” IEEE Transactions on So- ftware Engineering, Vol. 15, No. 10, 1989, pp. 1199-1205. doi:10.1145/280324.280334 [30] A. J. Albrecht and J. E. Gaffney, “Software Function, Source Lines of Code, and Development Effort Prediction: A Software Science Validation,” IEEE Transaction on Software Engineerin g, Vol. 6, 1983, pp. 639-647. doi:10.1109/TSE.1983.235271 [31] B. W. Boehm, B. Clar, C. Horowitz, C. Westland, R. Madachy and R. Selby, “Cost Models for Future Software Life Cycle Processes: COCOMO 2.0.0,” Annals of Soft- ware Engineering, Vol. 1, No. 1, 1995, pp. 1-30. doi:10.1007/BF02249046 [32] L. Greiner, “Is Development a Slave to the Platform?” Computing Canada, Vol. 30, No. 17, 2004, p. 18. [33] G. B. Shelly, T. J. Cashman and H. J. Rosenblatt, “Sys- tems Analysis and Design,” 7th Edition, Boston: Thomp- son-Course Technology. [34] R. M. Stair and G. W. Reynolds, “Principles of Informa- tion Systems,” Thomson-Course Technology, New York, 2003. [35] R. D. Banker and S. Slaughter, “The Moderating Effects of Structure on Volatility and Complexity in Software Enhancement,” Information Systems Research, Vol. 11, No. 3, 2000, pp. 219-240. doi:10.1287/isre.11.3.219.12209 [36] B. Unhelkar, “Process Quality Assurance for UML-Based Projects,” Addison Wesley, Boston, 2003. [37] G. Butchner, “Addressing Software Volatility in the System Life Cycle,” Unpublished Doctoral Thesis, 1997. [38] J. A. Hager, “Software Cost Reduction Methods in Prac- tice: A Post-Mortem Analysis,” Journal of Systems and Software, Vol. 14, No. 2, 1991, pp. 67-77. doi:10.1016/0164-1212(91)90091-J [39] B. Littlewood and L. Strigini, “Validation of Ultrahigh Dependability for Software-Based Systems,” Communi- cations of the ACM, Vol. 36, No. 11, 1993, pp. 69-80. doi:10.1145/163359.163373 [40] B. G. Tabachnick and L. S. Fidell, “Using Multivariate Statistics,” Needham Heights, MA: Allyn and Bacon, 2001. [41] C. F. Kemerer, “How the Learning Curve Affects CASE Tool Adoption,” IEEE Software, 1992, pp. 23-28. doi:10.1109/52.136161
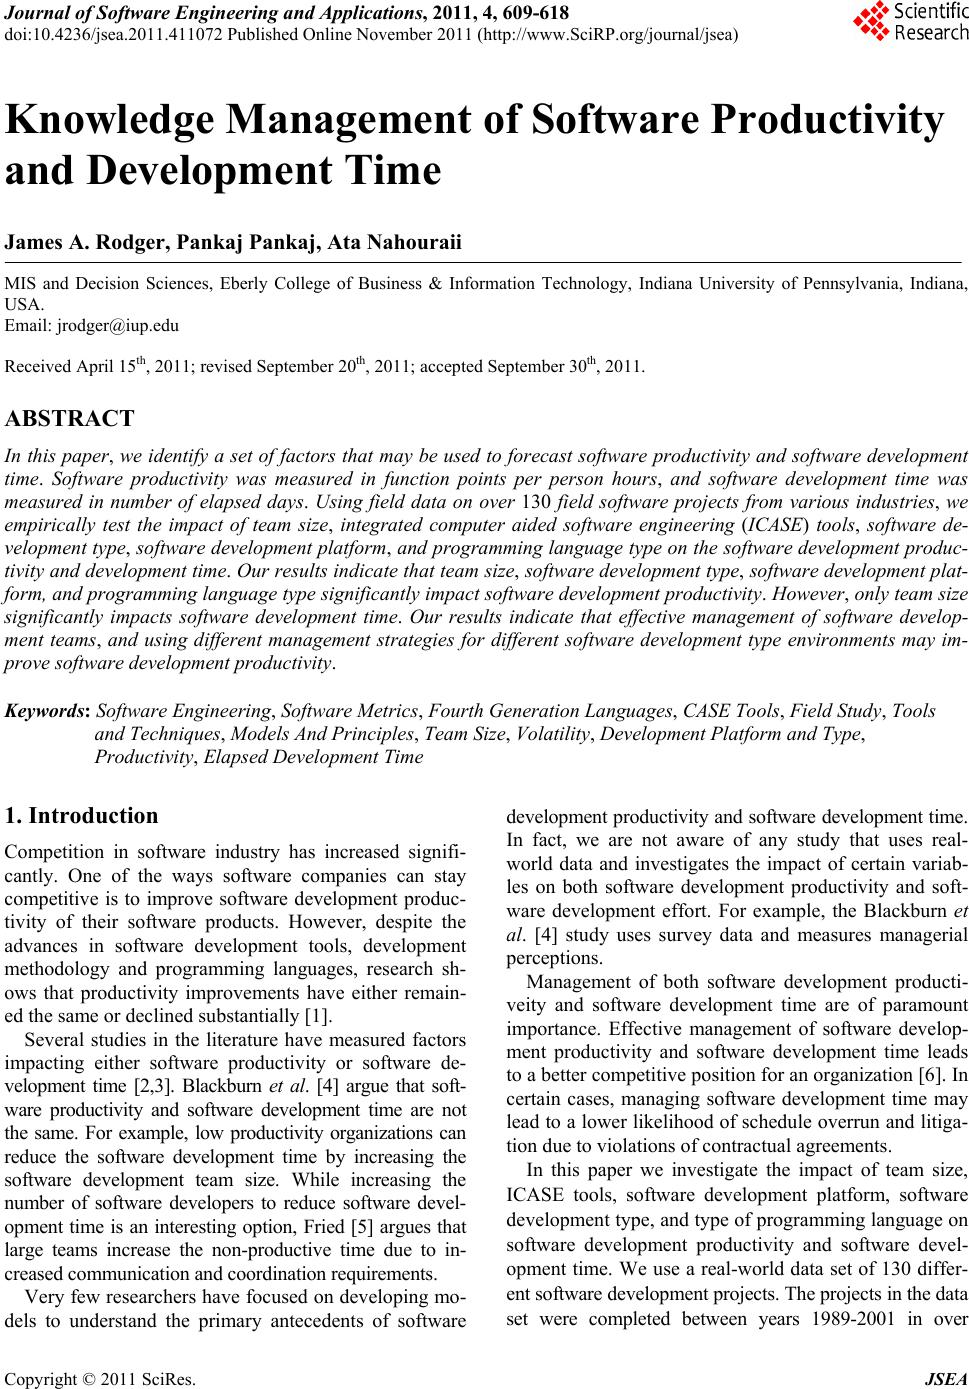
|