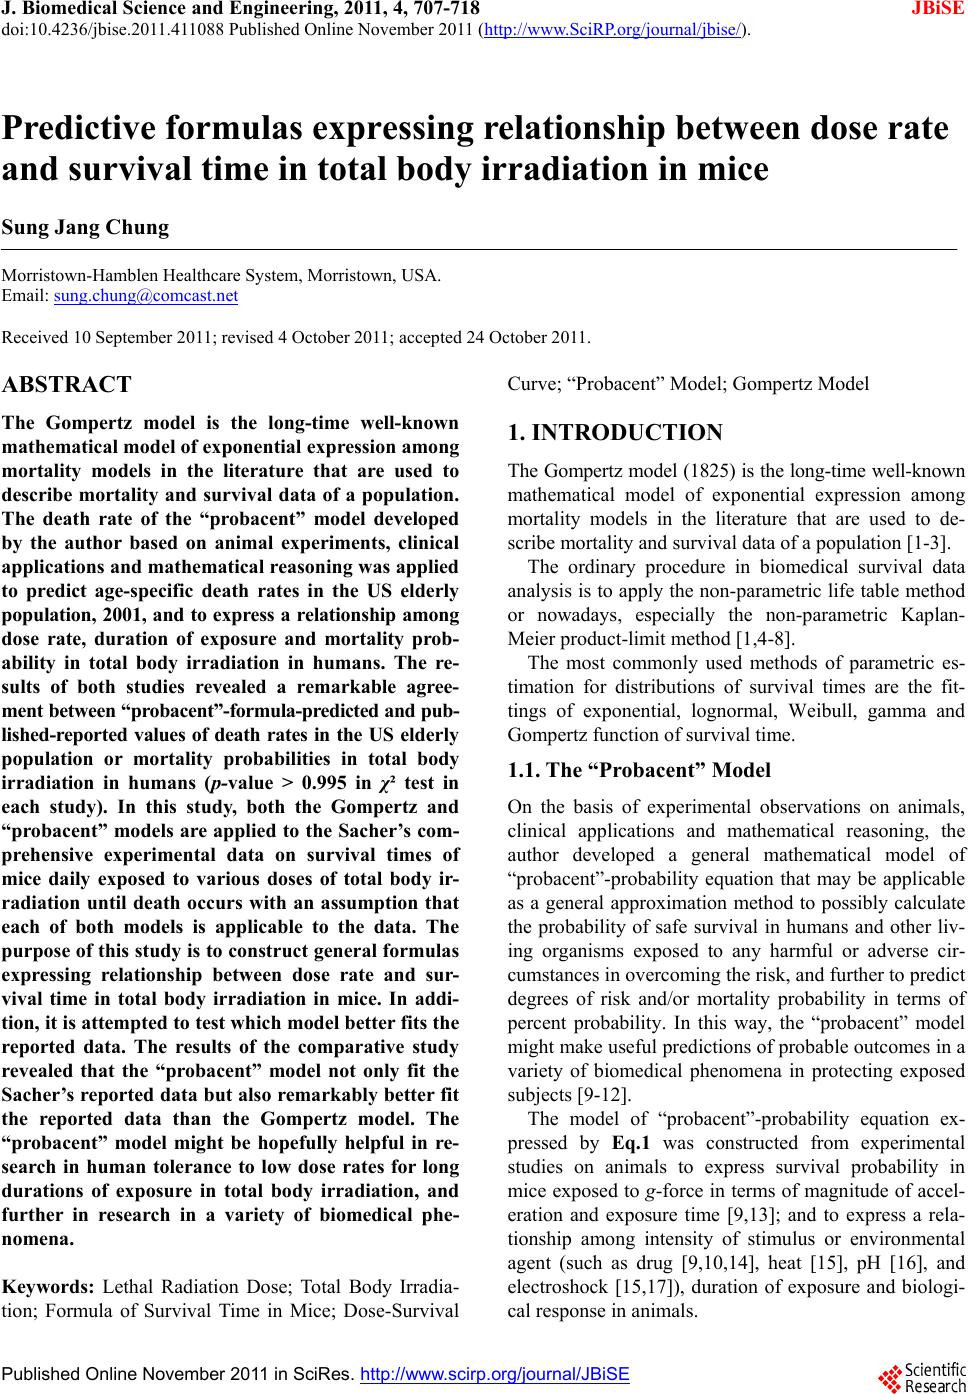
 J. Biomedical Science and Engineering, 2011, 4, 707-718 doi:10.4236/jbise.2011.411088 Published Online November 2011 (http://www.SciRP.org/journal/jbise/ JBiSE ). Published Online November 2011 in SciRes. http://www.scirp.org/journal/JBiSE Predictive formulas expressing relationship between dose rate and survival time in total body irradiation in mice Sung Jang Chung Morristown-Hamblen Healthcare System, Morristown, USA. Email: sung.chung@comcast.net Received 10 September 2011; revised 4 October 2011; accepted 24 October 2011. ABSTRACT The Gompertz model is the long-time well-known mathematical model of exponential expression among mortality models in the literature that are used to describe mortality and survival data of a population. The death rate of the “probacent” model developed by the author based on animal experiments, clinical applications and mathematical reasoning was applied to predict age-specific death rates in the US elderly population, 2001, and to express a relationship among dose rate, duration of exposure and mortality prob- ability in total body irradiation in humans. The re- sults of both studies revealed a remarkable agree- ment between “probacent”-formula-predicted and pub- lished-reported values of death rates in the US elderly population or mortality probabilities in total body irradiation in humans (p- value > 0.995 in χ² test in each study). In this study, both the Gompertz and “probacent” models are applied to the Sacher’s com- prehensive experimental data on survival times of mice daily exposed to various doses of total body ir- radiation until death occurs with an assumption that each of both models is applicable to the data. The purpose of this study is to construct general formulas expressing relationship between dose rate and sur- vival time in total body irradiation in mice. In addi- tion, it is attempted to test which model better fits the reported data. The results of the comparative study revealed that the “probacent” model not only fit the Sacher’s reported data but also remarkably better fit the reported data than the Gompertz model. The “probacent” model might be hopefully helpful in re- search in human tolerance to low dose rates for long durations of exposure in total body irradiation, and further in research in a variety of biomedical phe- nomena. Keywords: Lethal Radiation Dose; Total Body Irradia- tion; Formula of Survival Time in Mice; Dose-Survival Curve; “Probacent” Model; Gompertz Model 1. INTRODUCTION The Gompertz model (1825) is the long-time well-known mathematical model of exponential expression among mortality models in the literature that are used to de- scribe mortality and survival data of a population [1-3]. The ordinary procedure in biomedical survival data analysis is to apply the non-parametric life table method or nowadays, especially the non-parametric Kaplan- Meier product-limit method [1,4-8]. The most commonly used methods of parametric es- timation for distributions of survival times are the fit- tings of exponential, lognormal, Weibull, gamma and Gompertz function of survival time. 1.1. The “Probacent” Model On the basis of experimental observations on animals, clinical applications and mathematical reasoning, the author developed a general mathematical model of “probacent”-probability equation that may be applicable as a general approximation method to possibly calculate the probability of safe survival in humans and other liv- ing organisms exposed to any harmful or adverse cir- cumstances in overcoming the risk, and further to predict degrees of risk and/or mortality probability in terms of percent probability. In this way, the “probacent” model might make useful predictions of probable outcomes in a variety of biomedical phenomena in protecting exposed subjects [9-12]. The model of “probacent”-probability equation ex- pressed by Eq.1 was constructed from experimental studies on animals to express survival probability in mice exposed to g-force in terms of magnitude of accel- eration and exposure time [9,13]; and to express a rela- tionship among intensity of stimulus or environmental agent (such as drug [9,10,14], heat [15], pH [16], and electroshock [15,17]), duration of exposure and biologi- cal response in animals. 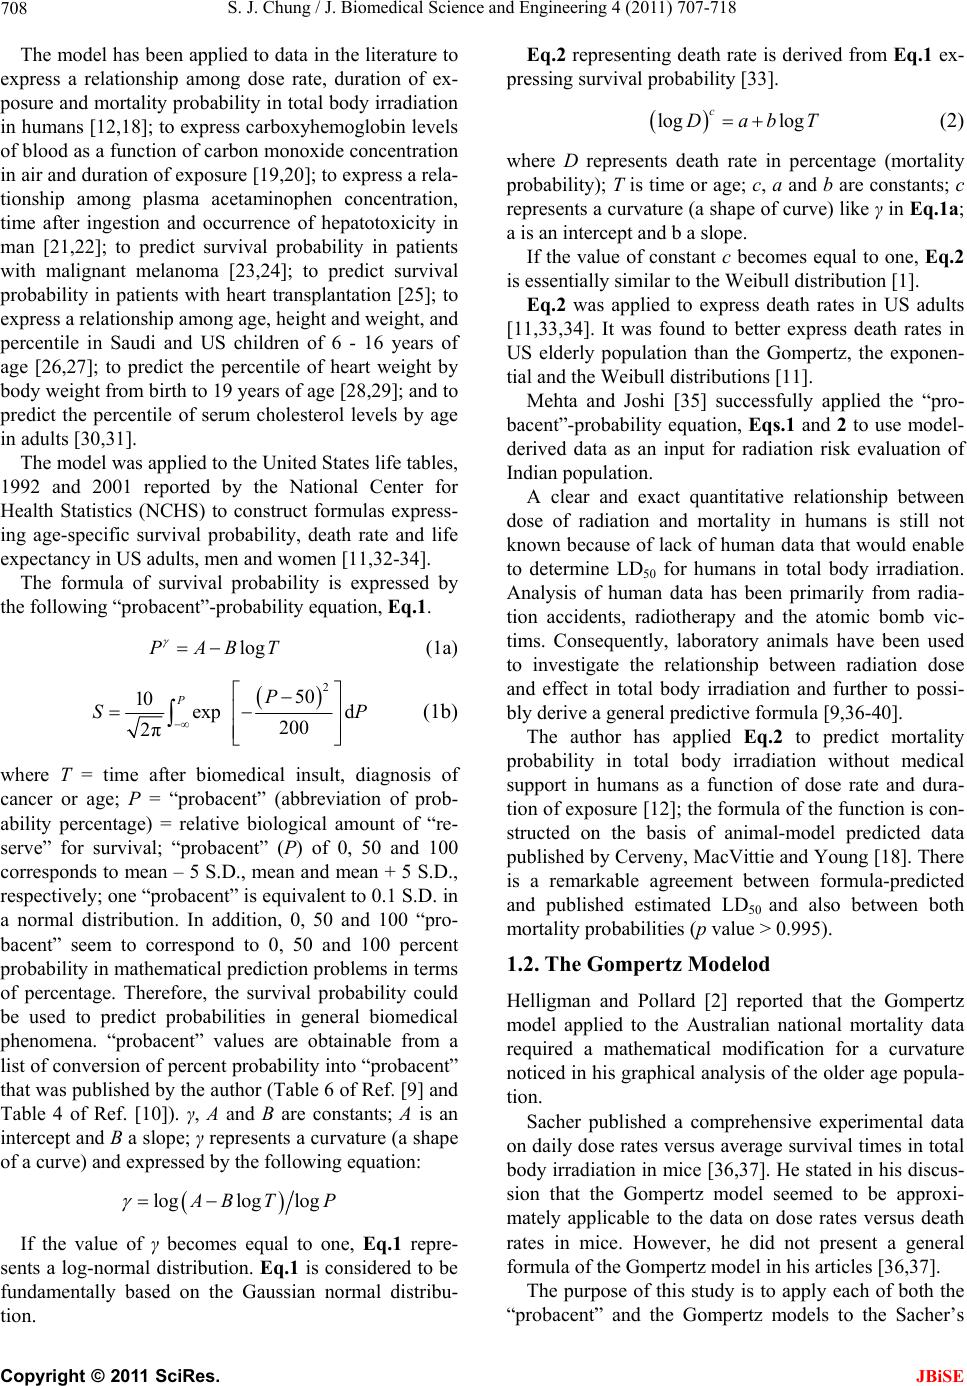 S. J. Chung / J. Biomedical Science and Engineering 4 (2011) 707-718 708 The model has been applied to data in the literature to express a relationship among dose rate, duration of ex- posure and mortality probability in total body irradiation in humans [12,18]; to express carboxyhemoglobin levels of blood as a function of carbon monoxide concentration in air and duration of exposure [19,20]; to express a rela- tionship among plasma acetaminophen concentration, time after ingestion and occurrence of hepatotoxicity in man [21,22]; to predict survival probability in patients with malignant melanoma [23,24]; to predict survival probability in patients with heart transplantation [25]; to express a relationship among age, height and weight, and percentile in Saudi and US children of 6 - 16 years of age [26,27]; to predict the percentile of heart weight by body weight from birth to 19 years of age [28,29]; and to predict the percentile of serum cholesterol levels by age in adults [30,31]. The model was applied to the United States life tables, 1992 and 2001 reported by the National Center for Health Statistics (NCHS) to construct formulas express- ing age-specific survival probability, death rate and life expectancy in US adults, men and women [11,32-34]. The formula of survival probability is expressed by the following “probacent”-probability equation, Eq.1. logPABT (1a) 2 50 10 exp d 200 2π PP S P (1b) where T = time after biomedical insult, diagnosis of cancer or age; P = “probacent” (abbreviation of prob- ability percentage) = relative biological amount of “re- serve” for survival; “probacent” (P) of 0, 50 and 100 corresponds to mean – 5 S.D., mean and mean + 5 S.D., respectively; one “probacent” is equivalent to 0.1 S.D. in a normal distribution. In addition, 0, 50 and 100 “pro- bacent” seem to correspond to 0, 50 and 100 percent probability in mathematical prediction problems in terms of percentage. Therefore, the survival probability could be used to predict probabilities in general biomedical phenomena. “probacent” values are obtainable from a list of conversion of percent probability into “probacent” that was published by the author (Table 6 of Ref. [9] and Table 4 of Ref. [10]). γ, A and B are constants; A is an intercept and B a slope; γ represents a curvature (a shape of a curve) and expressed by the following equation: loglog log BT P If the value of γ becomes equal to one, Eq.1 repre- sents a log-normal distribution. Eq.1 is considered to be fundamentally based on the Gaussian normal distribu- tion. Eq.2 representing death rate is derived from Eq.1 ex- pressing survival probability [33]. log log c DabT (2) where D represents death rate in percentage (mortality probability); T is time or age; c, a and b are constants; c represents a curvature (a shape of curve) like γ in Eq.1a; a is an intercept and b a slope. If the value of constant c becomes equal to one, Eq.2 is essentially similar to the Weibull distribution [1]. Eq.2 was applied to express death rates in US adults [11,33,34]. It was found to better express death rates in US elderly population than the Gompertz, the exponen- tial and the Weibull distributions [11]. Mehta and Joshi [35] successfully applied the “pro- bacent”-probability equation, Eqs.1 and 2 to use model- derived data as an input for radiation risk evaluation of Indian population. A clear and exact quantitative relationship between dose of radiation and mortality in humans is still not known because of lack of human data that would enable to determine LD50 for humans in total body irradiation. Analysis of human data has been primarily from radia- tion accidents, radiotherapy and the atomic bomb vic- tims. Consequently, laboratory animals have been used to investigate the relationship between radiation dose and effect in total body irradiation and further to possi- bly derive a general predictive formula [9,36-40]. The author has applied Eq.2 to predict mortality probability in total body irradiation without medical support in humans as a function of dose rate and dura- tion of exposure [12]; the formula of the function is con- structed on the basis of animal-model predicted data published by Cerveny, MacVittie and Young [18]. There is a remarkable agreement between formula-predicted and published estimated LD50 and also between both mortality probabilities (p value > 0.995). 1.2. The Gompertz Modelod Helligman and Pollard [2] reported that the Gompertz model applied to the Australian national mortality data required a mathematical modification for a curvature noticed in his graphical analysis of the older age popula- tion. Sacher published a comprehensive experimental data on daily dose rates versus average survival times in total body irradiation in mice [36,37]. He stated in his discus- sion that the Gompertz model seemed to be approxi- mately applicable to the data on dose rates versus death rates in mice. However, he did not present a general formula of the Gompertz model in his articles [36,37]. The purpose of this study is to apply each of both the “probacent” and the Gompertz models to the Sacher’s C opyright © 2011 SciRes. JBiSE 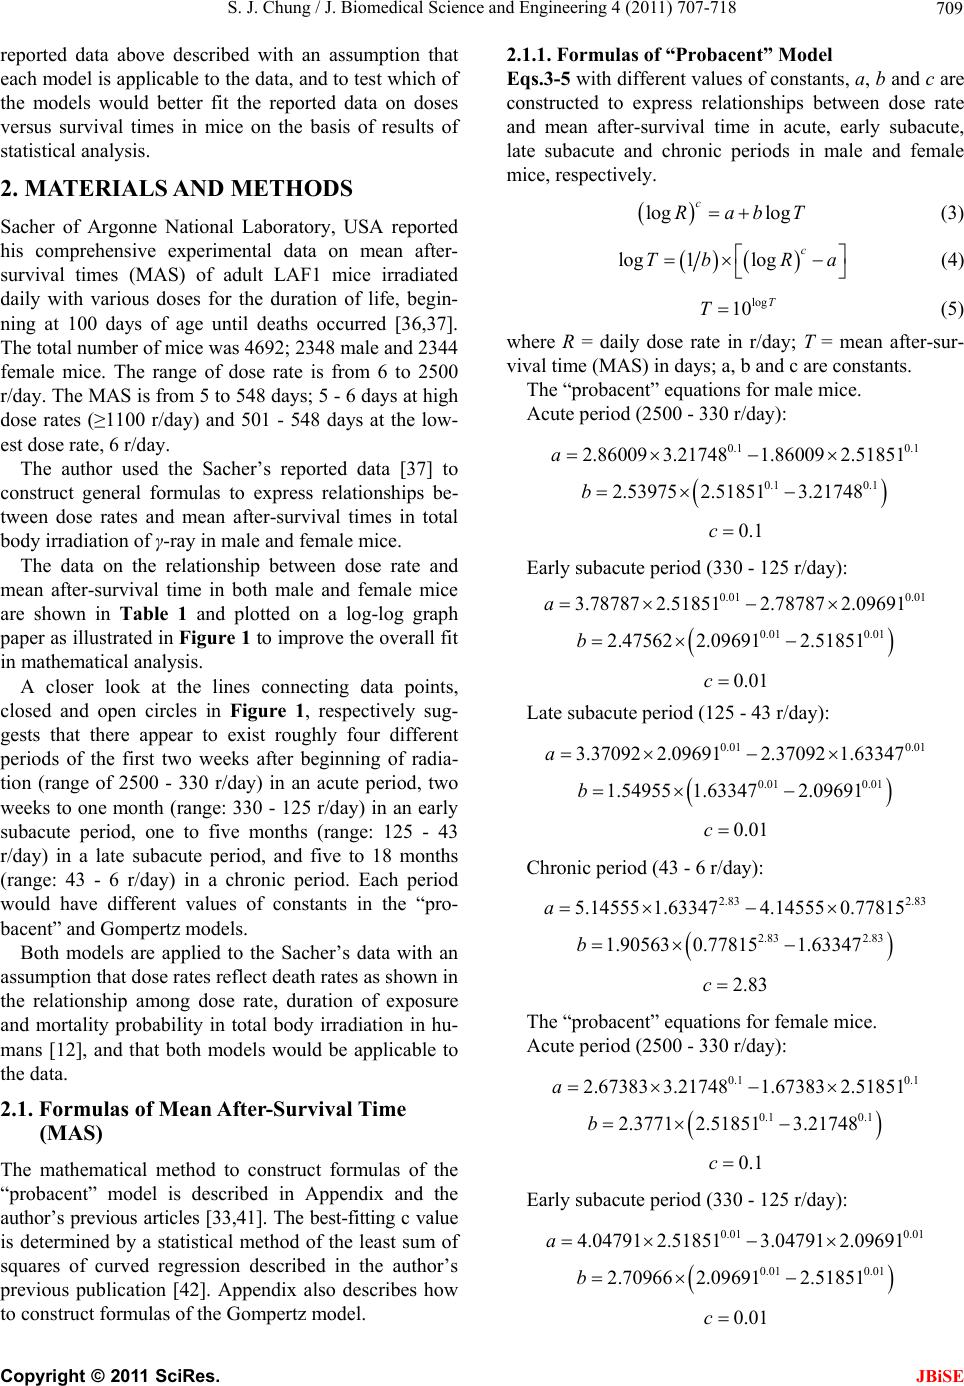 S. J. Chung / J. Biomedical Science and Engineering 4 (2011) 707-718 709 reported data above described with an assumption that each model is applicable to the data, and to test which of the models would better fit the reported data on doses versus survival times in mice on the basis of results of statistical analysis. 2. MATERIALS AND METHODS Sacher of Argonne National Laboratory, USA reported his comprehensive experimental data on mean after- survival times (MAS) of adult LAF1 mice irradiated daily with various doses for the duration of life, begin- ning at 100 days of age until deaths occurred [36,37]. The total number of mice was 4692; 2348 male and 2344 female mice. The range of dose rate is from 6 to 2500 r/day. The MAS is from 5 to 548 days; 5 - 6 days at high dose rates (≥1100 r/day) and 501 - 548 days at the low- est dose rate, 6 r/day. The author used the Sacher’s reported data [37] to construct general formulas to express relationships be- tween dose rates and mean after-survival times in total body irradiation of γ-ray in male and female mice. The data on the relationship between dose rate and mean after-survival time in both male and female mice are shown in Table 1 and plotted on a log-log graph paper as illustrated in Figure 1 to improve the overall fit in mathematical analysis. A closer look at the lines connecting data points, closed and open circles in Figure 1, respectively sug- gests that there appear to exist roughly four different periods of the first two weeks after beginning of radia- tion (range of 2500 - 330 r/day) in an acute period, two weeks to one month (range: 330 - 125 r/day) in an early subacute period, one to five months (range: 125 - 43 r/day) in a late subacute period, and five to 18 months (range: 43 - 6 r/day) in a chronic period. Each period would have different values of constants in the “pro- bacent” and Gompertz models. Both models are applied to the Sacher’s data with an assumption that dose rates reflect death rates as shown in the relationship among dose rate, duration of exposure and mortality probability in total body irradiation in hu- mans [12], and that both models would be applicable to the data. 2.1. Formulas of Mean After-Survival Time (MAS) The mathematical method to construct formulas of the “probacent” model is described in Appendix and the author’s previous articles [33,41]. The best-fitting c value is determined by a statistical method of the least sum of squares of curved regression described in the author’s previous publication [42]. Appendix also describes how to construct formulas of the Gompertz model. 2.1.1. Fo rmulas of “ P robacent ” M odel Eqs.3-5 with different values of constants, a, b and c are constructed to express relationships between dose rate and mean after-survival time in acute, early subacute, late subacute and chronic periods in male and female mice, respectively. log log c RabT (3) log1log c Tb Ra (4) log 10T T (5) where R = daily dose rate in r/day; T = mean after-sur- vival time (MAS) in days; a, b and c are constants. The “probacent” equations for male mice. Acute period (2500 - 330 r/day): 0.1 0.1 2.86009 3.217481.86009 2.51851 a 0.1 0.1 2.53975 2.518513.21748b 0.1c Early subacute period (330 - 125 r/day): 0.01 0.01 3.78787 2.518512.78787 2.09691 a 0.01 0.01 2.47562 2.096912.51851 b 0.01c Late subacute period (125 - 43 r/day): 0.01 0.01 3.370922.096912.37092 1.63347a 0.01 0.01 1.54955 1.633472.09691b 0.01c Chronic period (43 - 6 r/day): 2.83 2.83 5.14555 1.633474.145550.77815a 2.83 2.83 1.90563 0.778151.63347b 2.83c The “probacent” equations for female mice. Acute period (2500 - 330 r/day): 0.1 0.1 2.67383 3.217481.673832.51851a 0.1 0.1 2.3771 2.518513.21748b 0.1c Early subacute period (330 - 125 r/day): 0.01 0.01 4.04791 2.518513.04791 2.09691a 0.01 0.01 2.70966 2.096912.51851b 0.01c C opyright © 2011 SciRes. JBiSE 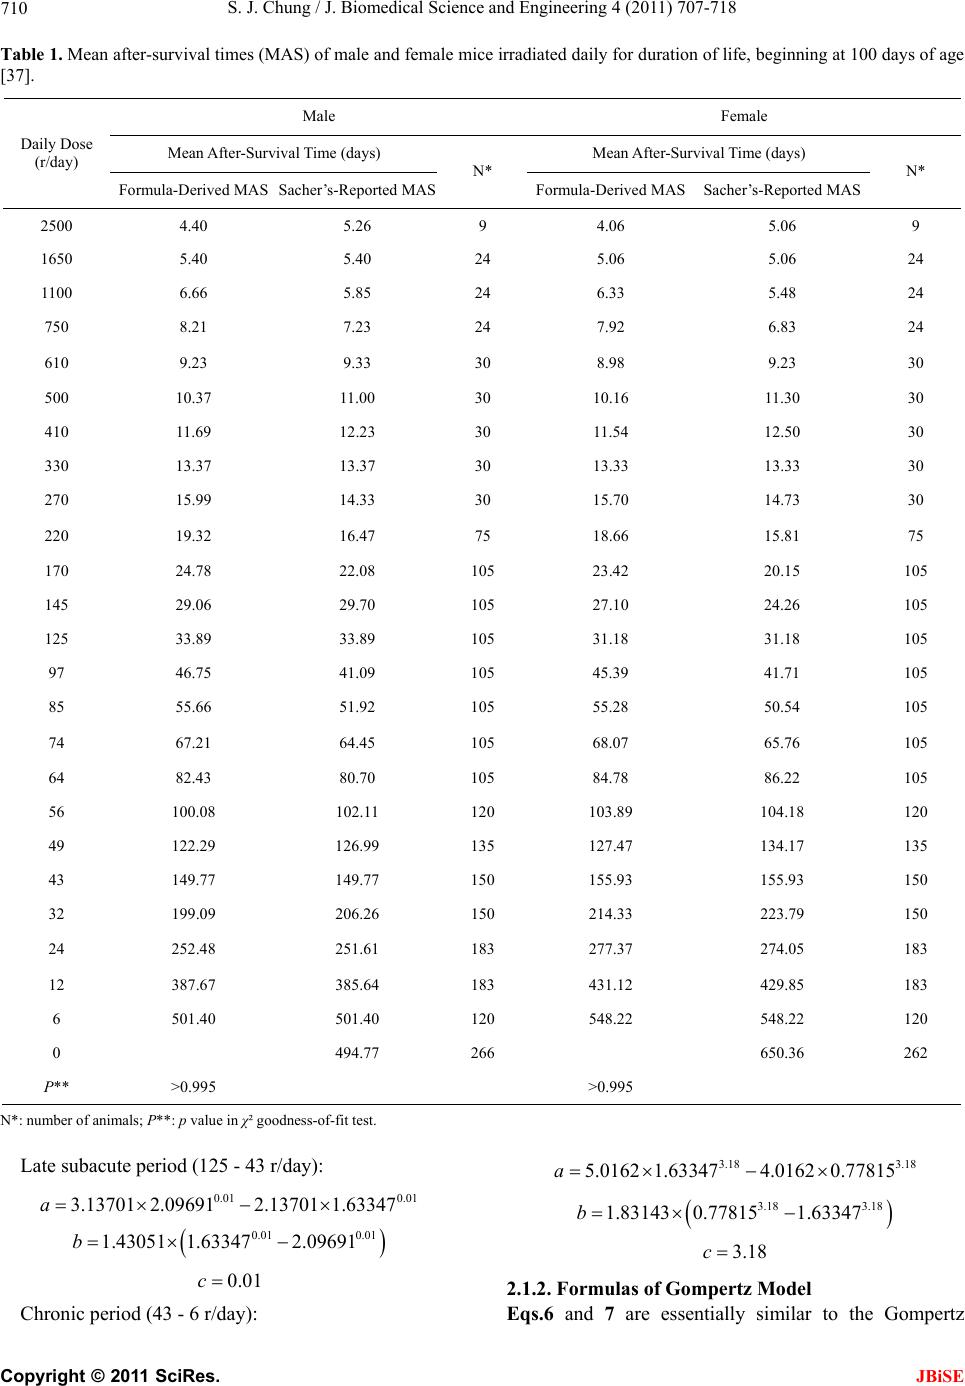 S. J. Chung / J. Biomedical Science and Engineering 4 (2011) 707-718 Copyright © 2011 SciRes. 710 Table 1. Mean after-survival times (MAS) of male and female mice irradiated daily for duration of lifing at 100 days of age Male Female e, beginn [37]. Mean After-Survival Mean After-Survivays) Time (days) al Time (d Daily Dose Formud MAS N* Formulad MAS N* (r/day) la-Derived MAS Sacher’s-Reporte-Derived MASSacher’s-Reporte 2500 9 9 4.40 5.26 4.06 5.06 1650 5.40 5.40 24 5.06 5.06 24 1100 6.66 5.85 24 6.33 5.48 24 750 8.21 7.23 24 7.92 6.83 24 610 9.23 9.33 30 8.98 9.23 30 500 10.37 11.00 30 10.16 11.30 30 410 11.69 12.23 30 11.54 12.50 30 330 13.37 13.37 30 13.33 13.33 30 270 15.99 14.33 30 15.70 14.73 30 220 19.32 16.47 75 18.66 15.81 75 170 24.78 22.08 105 23.42 20.15 105 145 29.06 29.70 105 27.10 24.26 105 125 33.89 33.89 105 31.18 31.18 105 97 46.75 41.09 105 45.39 41.71 105 85 55.66 51.92 105 55.28 50.54 105 74 67.21 64.45 105 68.07 65.76 105 64 82.43 80.70 105 84.78 86.22 105 56 100.08 102.11 120 103.89 104.18 120 49 122.29 126.99 135 127.47 134.17 135 43 149.77 149.77 150 155.93 155.93 150 32 199.09 206.26 150 214.33 223.79 150 24 252.48 251.61 183 277.37 274.05 183 12 387.67 385.64 183 431.12 429.85 183 6 501.40 501.40 120 548.22 548.22 120 0 494.77 266 650.36 262 P >05 >0.95 **.99 9 N*: nuf animals; P** in χ² goodness-of-fit Late subacute period (125 - 43 r/day): Chronic period (43 - 6 r/day): mber o: p value test. 3.18 3.18 5.0162 1.633474.01620.77815a JBiSE 0.01 3.13701 2.096912.13701a 0.01 1.63347 0.01 0.01 1.43051 1.633472.09691 b 8 3.18 1.83143 0.778151.63347b 3.1 3.18c 0.01c 2.1.2. Fo r mulas of G omp ertz Mode l Eqs.6 and 7 are essentially siilar to the Gompertz m 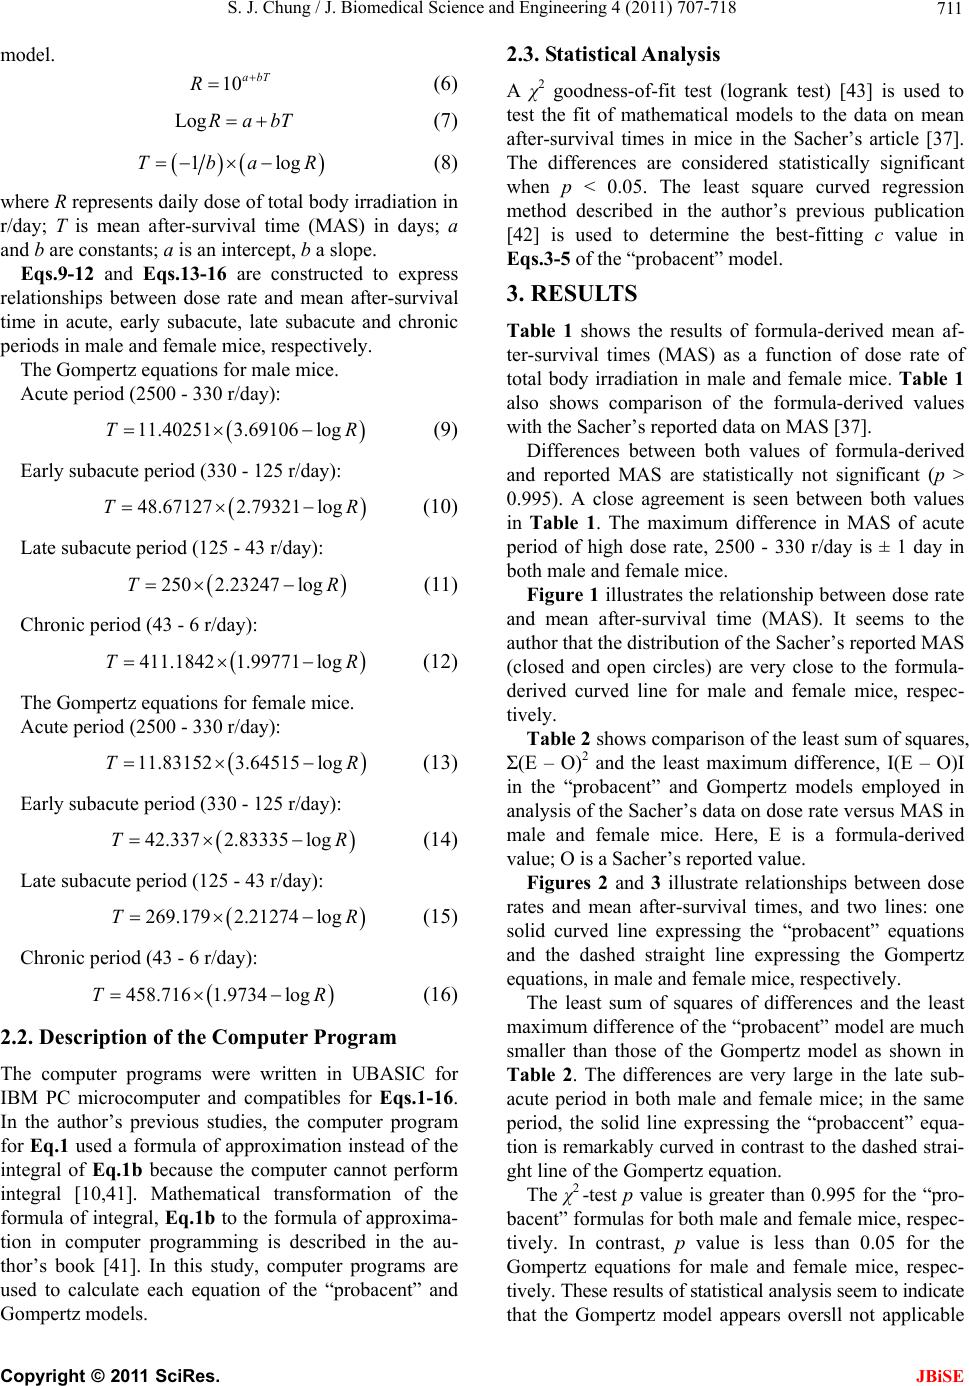 S. J. Chung / J. Biomedical Science and Engineering 4 (2011) 707-718 711 model. 10abT R (6) Log RabT (7) R (8) 1logTba where R represents daily dose of total bo r/day; T is mean after-survival time (M -survival tim (9) Early subacute period (330 - 125 r/day): (10) Late subacute period (125 - 43 r/day): (11) Chronic period (43 - 6 r/day): R (12) The Gompertz equations for female mice. Acute period (2500 - 330 r/day): (13) Early subacute period (330 - 125 r/day): (14) Late subacute period (125 - 43 r/day): R (15) Chronic period (43 - 6 r/day): R (16) 2.2. Description of the Computer Pr for -16. it test (logrank test) [43] is used to odels to the data on mean la-derived mean af- (MAS) as a function of dose rate of dy irradiation in AS) in days; a and b are constants; a is an intercept, b a slope. Eqs.9-12 and Eqs.13-16 are constructed to express relationships between dose rate and mean after e in acute, early subacute, late subacute and chronic periods in male and female mice, respectively. The Gompertz equations for male mice. Acute period (2500 - 330 r/day): 6 logR11.40251 3.6910T 48.671272.79321 logTR 2502.23247 logTR 411.1842 1.9977T1 log 11.83152 3.6451T 5logR 42.3372.83335 logTR 269.1792.21274 loTg 458.716 1.9734T log ogram The computer programs were written in UBASIC IBM PC microcomputer and compatibles for Eqs.1 In the author’s previous studies, the computer program for Eq.1 used a formula of approximation instead of the integral of Eq.1b because the computer cannot perform integral [10,41]. Mathematical transformation of the formula of integral, Eq.1b to the formula of approxima- tion in computer programming is described in the au- thor’s book [41]. In this study, computer programs are used to calculate each equation of the “probacent” and Gompertz models. 2.3. Statistical Analysis A χ2 goodness-of-f test the fit of mathematical m after-survival times in mice in the Sacher’s article [37]. The differences are considered statistically significant when p < 0.05. The least square curved regression method described in the author’s previous publication [42] is used to determine the best-fitting c value in Eqs.3-5 of the “probacent” model. 3. RESULTS Table 1 shows the results of formu ter-survival times total body irradiation in male and female mice. Table 1 also shows comparison of the formula-derived values with the Sacher’s reported data on MAS [37]. Differences between both values of formula-derived and reported MAS are statistically not significant (p > 0.995). A close agreement is seen between both values in Table 1. The maximum difference in MAS of acute period of high dose rate, 2500 - 330 r/day is ± 1 day in both male and female mice. Figure 1 illustrates the relationship between dose rate and mean after-survival time (MAS). It seems to the author that the distribution of the Sacher’s reported MAS (closed and open circles) are very close to the formula- derived curved line for male and female mice, respec- tively. Table 2 shows comparison of the least sum of squares, Σ(E – O)2 and the least maximum difference, I(E – O)I in the “probacent” and Gompertz models employed in analysis of the Sacher’s data on dose rate versus MAS in male and female mice. Here, E is a formula-derived value; O is a Sacher’s reported value. Figures 2 and 3 illustrate relationships between dose rates and mean after-survival times, and two lines: one solid curved line expressing the “probacent” equations and the dashed straight line expressing the Gompertz equations, in male and female mice, respectively. The least sum of squares of differences and the least maximum difference of the “probacent” model are much smaller than those of the Gompertz model as shown in Table 2. The differences are very large in the late sub- acute period in both male and female mice; in the same period, the solid line expressing the “probaccent” equa- tion is remarkably curved in contrast to the dashed strai- ght line of the Gompertz equation. The χ2 -test p value is greater than 0.995 for the “pro- bacent” formulas for both male and female mice, respec- tively. In contrast, p value is less than 0.05 for the Gompertz equations for male and female mice, respec- tively. These results of statistical analysis seem to indicate that the Gompertz model appears oversll not applicable C opyright © 2011 SciRes. JBiSE 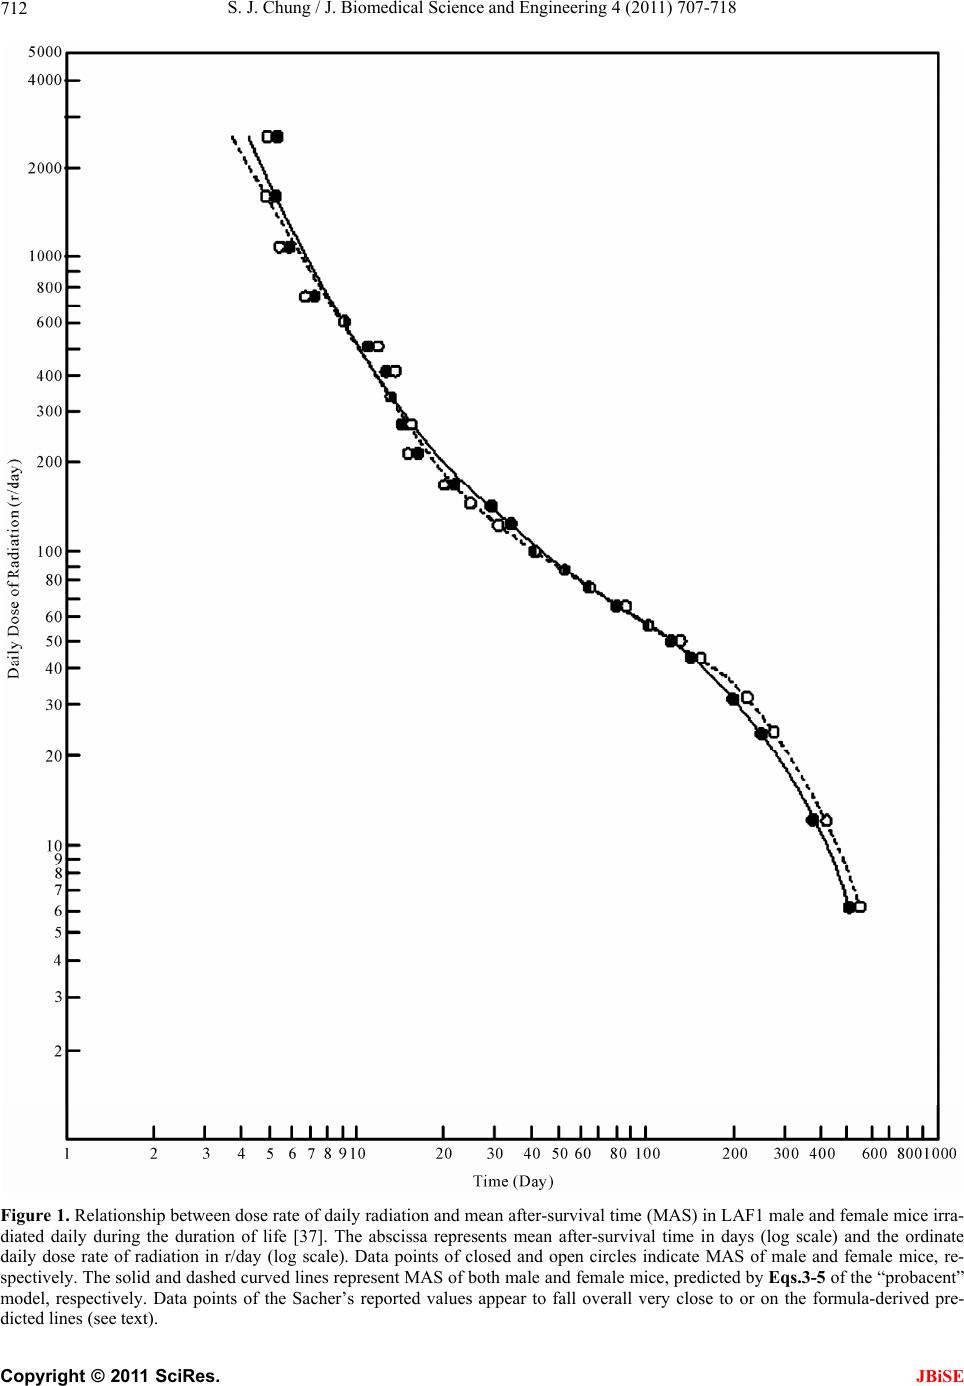 S. J. Chung / J. Biomedical Science and Engineering 4 (2011) 707-718 712 Figure 1. Relationship between dose rate of daily radiation and mean after-survival time (MAS) in LAF1 male and female mice irra- diated daily during the duration of life [37]. The abscissa represents mean after-survival time in days (log scale) and the ordinate daily dose rate of radiation in r/day (log scale). Data points of closed and open circles indicate MAS of male and female mice, re- spectively. The solid and dashed curved lines represent MAS of both male and female mice, predicted by Eqs.3-5 of the “probacent” model, respectively. Data points of the Sacher’s reported values appear to fall overall very close to or on the formula-derived pre- dicted lines (see text). C opyright © 2011 SciRes. JBiSE 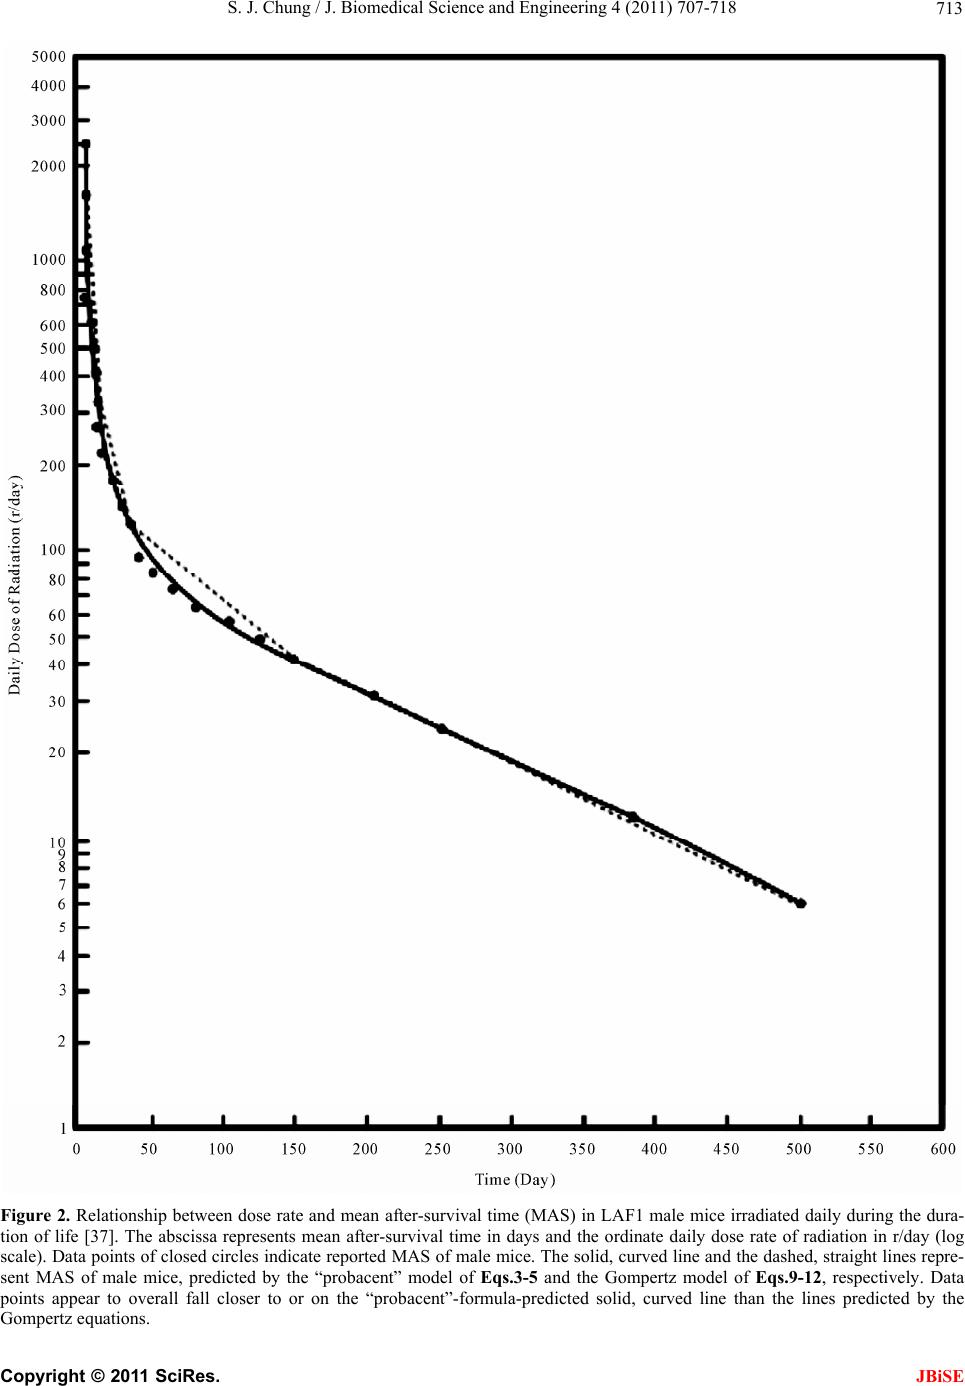 S. J. Chung / J. Biomedical Science and Engineering 4 (2011) 707-718 713 Figure 2. Relationship between dose rate and mean after-survival time (MAS) in LAF1 male mice irradiated daily during the dura- tion of life [37]. The abscissa represents mean after-survival time in days and the ordinate daily dose rate of radiation in r/day (lo scale). Data points of closed circles indicate reported MAS of male mice. The solid, curved line and the dashed, straight lines repre g - sent MAS of male mice, predicted by the “probacent” model of Eqs.3-5 and the Gompertz model of Eqs.9-12, respectively. Data points appear to overall fall closer to or on the “probacent”-formula-predicted solid, curved line than the lines predicted by the Gompertz equations. C opyright © 2011 SciRes. JBiSE  S. J. Chung / J. Biomedical Science and Engineering 4 (2011) 707-718 714 Figure 3. Relationship between dose rate and mean after-survival time (MAS) in LAF1 female mice irradiated daily during the dura- tion of life [37]. The abscissa represents mean after-survival time (MAS) in days and the ordinate daily dose rate of radiation in r/da (log scale). Data points of closed circles indicate reported MAS of female mice. The solid, curved line and the dashed, straight line y s represent MAS of female mice, predicted by the “probacent” model of Eqs.3-5, and by the Gompertz model of Eqs.13-16, respec- tively. Data points of the Sacher’s reported values appear to overall fall closer to or on the “probacent”-formulas-predicted solid, curved line than the Gompertz-formulas-predicted dashed, straight lines. C opyright © 2011 SciRes. JBiSE  S. J. Chung / J. Biomedical Science and Engineering 4 (2011) 707-718 Copyright © 2011 SciRes. 715 JBiSE Table 2. Comparison of the least sum of squares, ∑(E – O)2 and the least maximum-difference, І(E – O)І, in the “pro- acent” and Gompertz models employed in analysis of the Sa- b cher’s data on daily radiation dose versus mean survival time in male and female mice. Model “Probacent” Gompertz Used equation Eqs.3-5 Eqs.9,13 M 2 F Acute period Used equation EEq 2 Early subacute period Used equation EEq 2 2 Late subacute period Used equation EE6 2 Chronic period * 3.07 11.50 ∑(E – O) ** 5.18 13.51 M 0.98 2.07 I(E – O)I F 1.14 2.28 qs.3-5 s.10,14 M 18.55 70.00 ∑(E – O) F 27.81 76.43 M 2.85 5.47 I(E – O)I F 3.27 5.38 qs.3-5 s.11,15 M 82.79 779.28 ∑(E – O) F 88.32 2756.91 M 5.66 26.36 I(E – O)I F 6.70 26.71 qs.3-5 qs.12,1 M 56.34 82.46 ∑(E – O) F 102.15 471.14 M 7.17 7.96 I(E – O)I F 9.46 19.66 M*: male mice; F**: ice; ue isr than for “proacent” formulas foand fele miceivelye is less than 0.05 for Gompertz formulas for both m femal- better-fitting t between alues and the Sacher’s-reported female m r both male p-val greate0.995 ma, respect ale and . p-valu e mice, re spectively; E: formula-derived value of mean after-survival time for male and female mice, respectively; O: Sacher’s reported value of mean af- ter-survival time for male and female mice, respectively. to the Sacher’s data, and that the “probacent” model of eath rate, Eq.2 seems to be applicable andd to the reported data than the Gompertz model. 4. DISCUSSION Table 1 and Figure 1 reveal a close agreemen the formula-derived v data on mean after-survival times (MAS) (p > 0.995). Table 2 shows that the “probacent” equations, Eqs. 3-5 have noticeably smaller least sum of squares and least maximum difference than the Gompertz equations. This finding indicates that the “probacent” model is sta- tistically better fitting to the Sacher’s data. The p-value model appears overall not applicable to the Sacher’s data. Data-points of male and female mice appear overall fall much closer to or on the solid curved line repre- sented by the “probacent” equations than the dashed straight lines represented by the Gompertz equations in Figures 2 and 3, respectively. is >0.995 for the “probacent” equations and <0.05 for the Gompertz equations, suggesting that the Gompertz The author feels that in a variety of biomedical phe- nomena, if Eqs.1 and 2 are applicable, the values of con- stants γ and c are generally greater than one or less than one but not one, indicating a curved line when plotted on a X-Y graph paper as seen Figures 1-3. The γ and c val- ues are relatively rarely one, indicating a straight line on the graph or otherwise approximately appearing straight. This phenomenon seems to be analogous in physics to that light path is actually curved when passing through a gravitational field of space but appears straight [44,45]. If the γ value becomes equal to one, Eq.1 represents a log-normal distribution. If the c value is one, Eq.2 that is derivable from Eq.1 [33] becomes essentially similar to the Weibull distribution [1]. If the base of logarithm is one, the lognormal distribution becomes a norml distri- bu n tion (log11 = n) [41,46]. If the logarithm of one as its base is taken for X axis of time, the Gompertz distribu- tion might be similar to the Weibull distribution, and so might be a specific form of the “probacent”-probability equation. It seems to the author that the “probacent” mo- del may be applicable as a general approximation me- thod to make useful predictions of probable outcomes in a variety of biomedical phenomenon [41,42]. Hematopoietic cells of bone marrow, intestinal tract and central nervous system are most vulnerable to radia- tion effects [47-52]. Body responses to lethal radiation effects reflect status of living body in which pathologic changes, physiologic repair (response and regeneration) and inherent aging process are concurrently occurring [37]. Death is caused by multi-organ failure. In case of high dose, infection and hemorrhage are earliest contrib- uting factors to death in lethal total body irradiation, damaging most sensitive hematopoietic cells of bone marrow [37,47,52]. High dose rates (330 - 2500 r/day) shorten mean af- ter-survival times (MAS) in acute period, causing death within two weeks (Table 1). Decrease in dose rates in- creases MAS in mice. Cui and his coworkers demon- strated that a fractionated total body irradiation (FTBI) increased survival rates and therapeutic effects of FTBI in bone marrow transplantation in mice [53]. This find- ing is remarkably illustrated by the curved and pro- longed line of MAS in the chronic period of very low dose rates (Figures 1-3).  S. J. Chung / J. Biomedical Science and Engineering 4 (2011) 707-718 716 Biologic responses to lethal radiation effects are de- pendent on radiation dose rate and duration of exposure, and are reflected in survival times. The values of con- stants, a, b and c of Eq.2 of death rate seem to be deter- mined by the underlying status of biologic responses. The “probacent” model and findings in this stu m pertz model is Predictive formulas are d compared regarding their ppears approximately applicable in acute and ch pful in research in human toler- an the author’s current study is based. rth for his outstanding personal valuable in- str . (2003) Statistical methods for dy ight be hopefully helpful in research to investigate human tolerance to low dose rates for long durations of exposure in total body irradiation, and further in research in a variety of biomedical phenomena. 5. CONCLUSIONS The “probacent” model of death rate equation is applied to the Sacher’s experimental data on dose rates versus mean after-survival times (MAS) in mice daily irradiated during the duration of life [37]. The Gom also applied to the data. structed by both models an con- fit to data. In this comparative study of which model would bet- ter fit to data, it is found that the “probacent” equations not only well fit the data but also more closely express the relationship between dose rate and mean after-sur- vival time than the Gompertz equations. The Gompertz model a ronic period (higher and lower doses) but seems to be overall not applicable. The data-points connecting line is actually curved as seen in Figures 1-3, suggesting better fit of the curved- line expressing “probacent” model rather than the straight-line expressing Gompertz model. The “probacent” model and findings in this study might-be hopefully hel ce to low dose rates for long durations of exposure in total body irradiation, and further in research in a variety of biomedical phenomena. 6. ACKNOWLEDGEMENTS The author is thankful to Dr. George A. Sacher, Argonne National Laboratory, USA for his personal advice, encouragement and his highly valuable and comprehensive work in radiation research, sending me a reprint of his article on which The author thanks Dr. Lester Van Middleswo research on radiation and thyroid, and for his structions and advice in my research related to thyroid physiology, using 131I radioisotopes at the Department of Physiology and Biophys- ics, the University of Tennessee. I would like to express my thanks to Dr. C. W. Sheppard for his in- uctions and encouragement in my research related to radiation and computer programming. REFERENCES [1] Lee, E.T. and Wang. J.W survival data. John Wiley & Sons, Hoboken, pp. 8-197. doi:10.1002/0471458546.ch2 [2] Heligman, L. and Pollard, J.H. (1980) The age pattern of mortality. Journal of Inst. Actuaries, 107, 49-80. esearch, Blackwell Science, Cam- [3] Gompertz, B. (19 methods in medical r 94) Parametric models. In: Statistical bridge, pp. 482-483. [4] Kaplan, E.L. and Meier, P. (1958) Nonparametric estima- tion for incomplete observations. Journal of American Statistical Association, 53, 457-481. doi:10.2307/2281868 [5] Gordis, L. (2004) The Kaplan-Meier method. In: Epide- miology, Elsevier Saunders, Philadelphia, pp. 104-106. [6] Mould, R.F. (1976) Calculation of survival rates by the life table and other methods. Clinical Radiology, 27, 33-38. doi:10.1016/S0009-9260(76)80011-6 [7] American Joint Commission. (1983) Reporting of cancer survival and results. In: Manual for Staging of Cancer. Lippincott, New York, pp. 11-21. [8] Cox, D.R. and Oaks, D. (1985) Distribution of failure times; parametric Statistical analysis: Simple sample; single-sample nonparametric methods. In: Analysis of survival data, Chapman and Hall, London, pp. 13-61. [9] Chung, S.J. (1960) Studies on a mathematical relation- ship between stress an response in biological phenomena. Republic of Korea Journal of the National Academy of Sciences, 2, 115-162. [10] Chung, S.J. (1986) Computer-assisted predictive mathe- matical relationship among metrazol dose and time and mortality in mice. Computer Methods and Programs in Biomedicine, 22, 275-284. doi:10.1016/0169-2607(86)90004-0 [11] Chung, S.J. (2007) Computer-assisted predictive formu- las expressing survival probability and life expectancy in US adults, men and women, 2001. Computer Methods and Programs in Biomedicine, 86, 197-209. doi:10.1016/j.cmpb.2007.02.009 [12] Chung, S.J. (2011) Predictive formulas expressing rela- tionship among dose rate, duration of exposure and mor- tality probability in total body irradiation in humans. Journal of Biomedical Science and Engineering, 4, 497- 505. doi:10.4236/jbise.2011.47063 [13] Chung, S.J. (1959) Studies of positive radial acceleration on mice. Journal of Applied Physiology, 14, 52-54. 7-6 [14] Boak, H. and Chung, S.J. (1962) Studies on a relation- ship between dose, time and percentage of occurrence of response and a method of evaluation of combined action in drugs. The New Medical Journal, 5, 35-82. [15] Kim, C.C. and Chung, S.J. (1962) Studies on a relation- ship between stress, duration of exposure and percentage of response in goldfish to single, double, and triple stresses of acceleration, electroshock, heat, chemical and osmotic stimuli. Republic of Korea Theses of Catholic Medical College, 5, 257-336. [16] Cho, D.W. and Chung, S.J. (1961) Studies of tolerance of Paramecium caudatum to hydroxyl ions. Bulletin of Ya- maguchi Medical School, 8, 151-160. [17] Chung, S.J. (1989) Computer-assisted mathematical rela- tionship among electroshock voltage and duration and occurrence of convulsion in mice. Computer Methods and Programs in Biomedicine, 28, 23-30. doi:10.1016/0169-2607(89)9017 C opyright © 2011 SciRes. JBiSE  S. J. Chung / J. Biomedical Science and Engineering 4 (2011) 707-718 717 uences of nu al men , 594-608. f-life and hepatic necrosis e mathe- s and Programs in [18] Cerveny, T.J., MacVittie, T.J. and Young, R.W. (1989) Acute radiation syndrome in humans. In: R. J. Walker and T. J. Cerveny, Ed., Medical conseqclear warfare, TMM Publishers, Office of the Surgeon General, Falls Church, Virginia, 15-36. [19] Forbes, W.H., Sergent, F. and Roughton, F.J.W. (1988) The risk of carbon monoxide uptake by norm American Journal of Physiology, 143 . [20] Chung, S.J. (1988) Formula predicting carboxyhemoglo- bin resulting from carbon monoxide exposure. Veterinary and Human Toxicology, 30, 528-532. [21] Prescott, L.F. Roscoe, P., Wright, N. and Brown, S.S. (1991) Plasma paracetamol hal in patients with paracetamol overdosage. Lancet, 1, 519- 522. [22] Chung, S.J. (1989) Computer-assisted predictiv matical relationship among plasma acetaminophen con- centration, time after ingestion and occurrence of hepa- totoxicity in man. Computer Method Biomedicine, 28, 37-43. doi:10.1016/0169-2607(89)90179-X [23] Chung S.J. (1991) Formula predicting survival in patients with invasive malignant melanoma. International Jour- nal of Biomedical Computing, 28, 151-159. doi:10.1016/0020-7101(91)90051-F [24] Chung, S.J. (1994) Formula expressing relationship among lesion thickness, time after diagnosis and survival probabil- ity in patients with malignant Journal of Biomedical Computing, 37 melanoma. International , 171-180. doi:10.1016/0020-7101(94)90139-2 [25] Chung, S.J. (1993) Formula predicting survival probabil- ity in patients with heart transplantation. In Journal of Biomedical Computing, 32 ternational , 211-221. doi:10.1016/0020-7101(93)90015-X [26] Magbool, G., Kaul, K.K., Corea, J.R., Osman, M. and Atfaj, A. (1993) weight and height in Saudi children six to 16 years from the Eastern Province. Annals o Medicine, 13, 344-349. f S ational , 258-272. audi [27] Chung, S.J. (1994) Formulas expressing relationship among age, height and weight, and percentile in Saudi and US children of ages of 6-16 years. Intern Journal of Biomedical Computing, 37 doi:10.1016/0020-7101(94)90124-4 [28] Sholz, D.C., Kitzman, D.W., Hagen, P.T., Ilstrup, D.H. and Edwards. W.D. (1998) Age-related changes in nor- mal heart during the first 10 decades of life, Part I. cts from birth to 19 (Growth): A quantitative anatomic study of 200 speci- mens from subjects from birth to 19 years old. Mayo Clinic Proceedings, 13, 126-136, 637. [29] Chung, S.J. (1990) Formulas predicting the percentiles of heart weight by body weight in subje years of age. International Journal of Biomedical Com- puting, 26, 257-269. doi:10.1016/0020-7101(90)90049-Z [30] Chung, S.J. (1990) Formulas predicting the percentile of serum cholesterol levels by age in adults. Archives of Pathology and Laboratory Medicine, 11 4, 869-895. [31] Chung, S.J. (1992) Relationship among age, serum cho- lesterol level and population percentile in adults. Interna- tional Journal of Biomedical Computing, 31, 99-116. doi:10.1016/0020-7101(92)90066-2 [32] Arias, E. (2004) United States life Tables, 2001. National Vital Statistics Report, 52, 1-40. [33] Chung, S.J. (1995) Formulas expressing life expectancy, survival probability and death rate in life tables at various ages in US adults. International Journal of Biomedical Computing, 39, 209-217. doi:10.1016/0020-7101(94)01068-C [34] Chung, S.J. (1997) Comprehensive life tables of com- al probability or puter-assisted predictive mathematical relationship among age and life expectancy, surviv death rate in US adults. Computer Methods and Pro- grams, 52, 67-73. doi:10.1016/S0169-2607(96)01778-6 [35] Mehta, S.C. and Joshi, H.C. (2004) Model based point estimates of survival/death risk evaluation in Indian context. Ind rate: An input for radiation ian Journal of Nu- - Thames, H.D., et al. (1985) 67-8140(85)80122-5 clear Medicine, 19, 16-18. [36] Sacher, G.A. (1956) On the statistical nature of mortality, with especial reference to chronic radiation mortality. Radiology, 67, 250-257. [37] Sacher, G.A. (1959) On the radiation of lethality to radia tion injury, and its relevance for the prediction problem. 9th International Congress of Radiology, München, 23- 30 December 1959. [38] Travis, E.L., Peters, L.J., Effect of dose-rate on total body irradiation: Lethality and pathologic findings. Radiology and Oncology, 4, 341-351. doi:10.1016/S01 ute radiation response of mice from , Bloom- -probability equation in [39] Ellington, F. (1947) Influence of dose fractionation on the lethal X-ray effect produced by total body irradiation in mice. Radiology, 47, 238-241. [40] Grahn, D. (1958) Ac a cross between radio-sensitive and radio-resistant strains. Genetics, 43, 835-843. [41] Chung, S.J. (2009) Seeking a New World: A New Phi- losophy of Confucius and Kim Hang. iUniverse ington, 68-76,153. [42] Chung, S.J. (2011) Computer program of nonlinear, curved regression for “probacent” biomedicine. Journal of Biomedical Science and Engi- neering, 4, 620-630. doi:10.4236/jbise.2011.49078 [43] Dixon, W.J. and Massey Jr., F.J. (1957) Introduction to ief History of Time, Bantam Books, New d human hematopoietic progenitors cin signaling. Hae- Statistical; Analysis, McGraw-Hill, New York, 191-227. [44] Einstein, A. (1905) The special theory of relativity. In: S. W. Hawking, A Br New York, 1-61. [45] Suplee, C (1999) Physics in the 20th Century, Hany N. Abrahams, Inc., New York, 82-180. [46] Chung, S.J. (2010) The book of right change: A Philosophy of Asia. iUniverse, Bloomington, 10. [47] Warren, S. (1961) The pathology of ionizing radiation, Charles C. Thomas Publisher, Springfield. [48] Li, X.H., Fu, D., Latif, N.H., et al. (2010) δ-tocotrienol protects mouse an from γ-irradiation through extracellular signal-regulated kinase/mammalian target of rapamy matologica, 95, 1996-2004. doi:10.3324/haematol.2010.026492 [49] Komarova, E.A., Kondratov, R.V., Wang, K., et al. (2004) Dual effect of p53 on radiation sensitivity in vivo: p53 promotes hematopoietic injury, but protects from gas- tro-intestinal syndrome in mice. Oncogene, 23, 3265- 3271. doi:10.1038/sj.onc.1207494 [50] Department of Radiology, University of Illinois (1998) Whole body irradiation: Lesson from Chernobyl. C opyright © 2011 SciRes. JBiSE  S. J. Chung / J. Biomedical Science and Engineering 4 (2011) 707-718 Copyright © 2011 SciRes. 718 ection4/section4.htwww.uic.edu/com/uhrd/manuscript/s JBiSE ml. [51] Jones, T.D., Morris. M.D., Wells, S.M. and Young, R.W. (1986) Animal mortality resulting from uniform expo- sures to photon radiations: Calculated ld50 and a compila- tion of experimental data, Oak Ridge National Labora- et 0b013e3181ddd571 (2010) Acute radiation syndrome: Assessment and man- agement. Southern Medical Journal, 103, 541-544. doi:10.1097/SMJ. ion, 66 [53] Cui, Y. Yang, G., Fan, T., et al. (2002) Optimal protocol for total body irradiation for allogeneic bone marrow transplantation in mice. Bone Marrow Transplantat 30, 843-849. doi:10.1038/sj.bmt.17037tory, Oak Ridge. [52] Donnelly, E.H., Nembauser, J.B., Smith, J.M., al. PPENDIX formula expressed by Eq.2 representing the mean af- (MAS) as a function of daily dose rate diation in mice is assumed to be appli- (A.1) (A.2) The values of constants, a and b are A.1 and A.2 as expressed by Eqs.A.3 and A.4, respec- tively. (A.3) A 2.86009 3.217481.860092.51851 cc a A 2.53975 2.518513.21748 cc b (A.4) ccc R ter-survival time n total body irrai log2.86009 3.217481.860092.51851 2.53975 2.518513.21748 cc cable here to the Sacher’s data [37] on the basis of the aforementioned findings. General Formulas of the Mean After-Survival Times in Acute Period for Male Mice (Up to Two Weeks after Irradiation of Dose Rate, 2500 - 330 r/day) Two sets of data on dose rate (R) and mean after-sur- vival time (T) from the Sacher’s reported values are used to determine values of a, b, c in Eq.2. 1) R = 1650 r/day of dose rate, and T = 5.4 days of mean after-survival time. 2) R = 330 r/day of dose rate, and T = 13.37 days of mean after-survival time. log1650 cablog 5.4 log 330calog 13.37b derived from Eqs. (A.5) In order to determine the best fitting value of constant c, the author employs the method of the least sum of squares that is described in the author’s previous publi- cation [42]. A very close and best agreement is found between the computer-derived and the Sacher’s-reported mean after-survival times with the c-value of 0.1 deter- mined by the above method. The a, b an c values in the Eqs.3-5 for acute period in male mice are finally deter- mined. Values of constants, a, b and c in Eqs.3-5 for the other three periods, early subacute, later subacute and chronic period are likewise determined. Formulas of the Gompertz equations, Eqs.6-16 are likewise constructed from two sets of data in each of four periods.
|