 J. Biomedical Science and Engineering, 2011, 4, 684-691 doi:10.4236/jbise.2011.411085 Published Online November 2011 (http://www.SciRP.org/journal/jbise/ JBiSE ). Published Online November 2011 in SciRes. http://www.scirp.org/journal/JBiSE Compounds that inhibit triglyceride accumulation and TNFα secretion in adipocytes Naofumi Shiomi, Miwako Maeda, Minori Mimura School of Human Sciences, Kobe College, Nishinomiya, Japan. Email: n-shiomi@mail.kobe-c.ac.jp Received 19 September 2011; revised 17 October 2011; accepted 30 October 2011. ABSTRACT Obese subjects show both a fatty predisposition and a higher risk of metabolic syndrome. This characteris- tic depends on adipocytes. However, the roles of adi- pocytes in metabolic syndrome have been insuffi- ciently investigated, because few pure adipocyte cell lines have been isolated. The present study had two objectives: the isolation of a pure adipocyte cell line and clarification of the differences between adipo- cytes and preadipocytes, and screening for com- pounds that can potentially prevent metabolic syn- drome. We isolated a novel adipocyte cell line, 3T3- L24. In the 3T3-L24 cells, the gene expression levels (of C/EBPα and β, PPARγ and AP2) and the produc- tion of triglyceride and TNFα were much higher than those in the preadipocyte 3T3-L1 cells. We used the 3T3-L24 adipocytes to screen for compounds that could inhibit triglyceride accumulation and TNFα secretion. Fatty acids enhanced the triglyceride ac- cumulation. Sodium carboxylate, taurine and car- nitine not only inhibited triglyceride accumulation, but also inhibited TNFα secretion. Therefore, these compounds might be effective to decrease the risk of metabolic syndrome in obese subjects. Keywords: Adipocyte; Metabolic Syndrome; Triglyc- eride; TNFα; Fatty Acid; Carboxylate; Taurine; Carnitine 1. INTRODUCTION Obesity has been gradually increasing in Japan because of the changes in eating habits, shortage of exercise and increase in work-related stress [1]. The risk for hyper- glycemia, diabetes, and heart disease in obese people is approximately 2 - 4 times higher than that in normal- weight persons. This trio of effects is well known as “metabolic syndrome”. According to research performed by the Ministry of Health, Labor and Welfare of Japan in 2006, half of males and one-fifth of females among those over 40 years old show signs of metabolic syn- drome, making the prevention (and treatment) of meta- bolic syndrome an important subject in Japan. The mechanism responsible for metabolic syndrome has been studied since the 1990s. White adipose tissue (WAT) works as an endocrine organ, and provides en- ergy storage by the accumulation of triglycerides [2]. WAT secretes many adipocytokines [3-7], such as adi- ponectin, leptin and tumor necrosis factor alpha (TNFα), which can induce insulin resistance and decrease glucose control, which are among the first symptoms of meta- bolic syndrome. For example, a standard-weight person generally has 5 - 10 μg/ml of adiponectin in the blood, but the concentration in patients with type 2 diabetes or ischemic heart disease is much lower [8]. The admini- stration of adiponectin to these patients was effective for reducing their symptoms. Leptin, a neuropeptide, works as an inhibitor of appetite [6]. The administration of leptin to diabetic patients led to recovery from insulin resistance [9]. TNFα induces the expression of migration inhibitory factor (MIF), which is also related to insulin resistance [10]. Consequently, insulin resistance and the unusual metabolism of glucose associated with meta- bolic syndrome are caused by the induction of TNFα and the repression of leptin and adiponectin in the WAT. Recent studies have also suggested that hypertrophy of the WAT is an important factor in metabolic syn- drome. Hypertrophy of the WAT causes not only the aging of adipocytes, but also inflammation by the oblit- eration of the blood flow. This inflammation facilitates the gathering of macrophage and secretion of adipocyto- kines from the disrupted cells of the WAT [11]. In ex- periments using rats, an increase in the expression of p53 and secretion of proinflammatory factors was found in hypertrophic WAT [12]. The ratio of adipocytes to preadipocytes is very high in obese in comparison with normal-weight people. Therefore, to avoid the development of metabolic syn- drome in obese subjects, it is important to fully under- 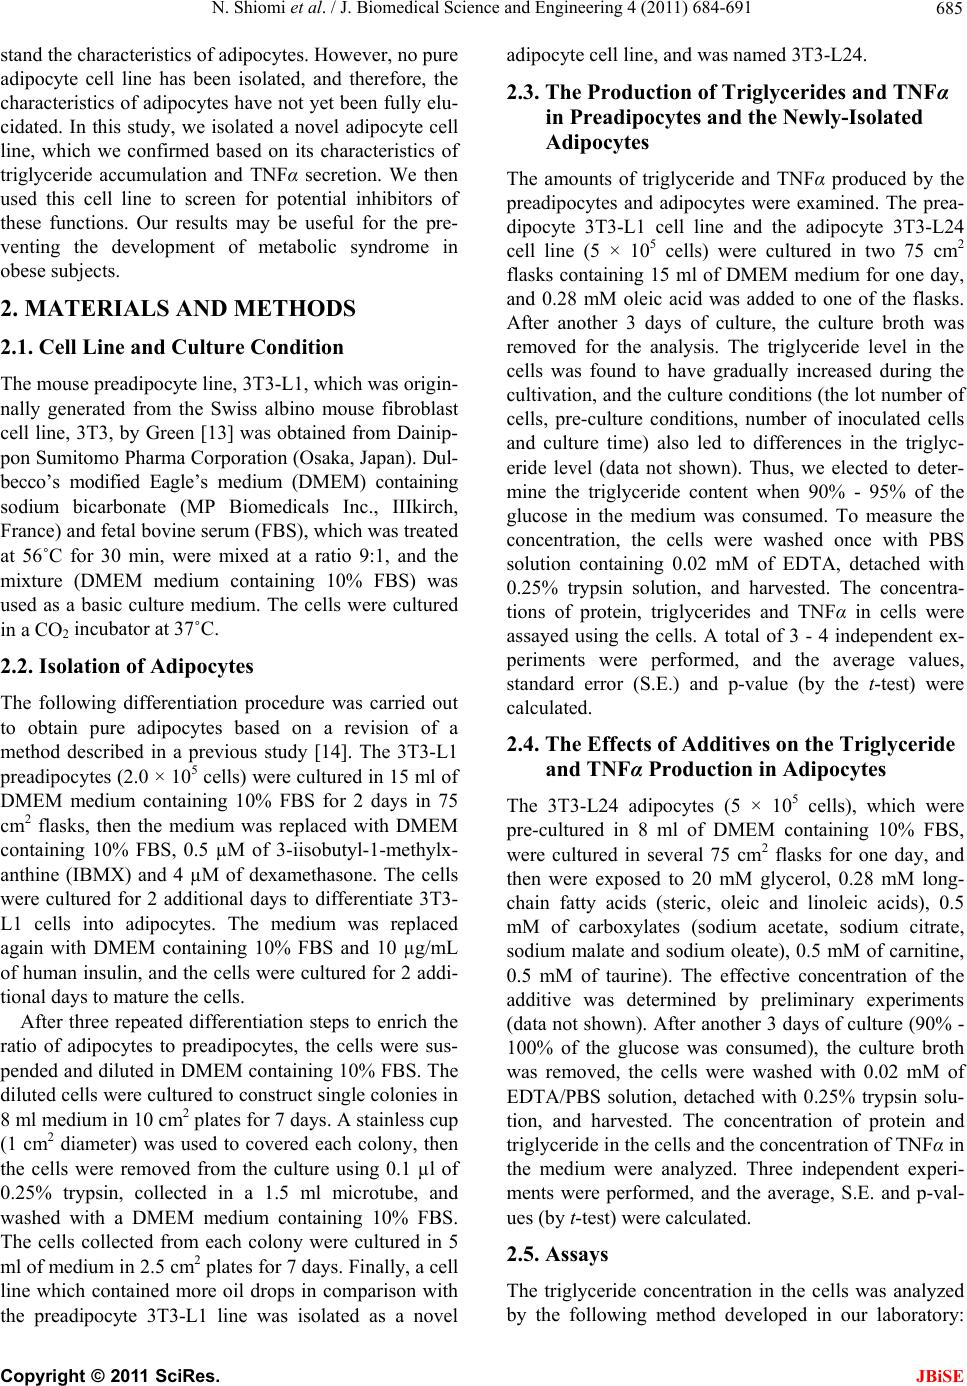 N. Shiomi et al. / J. Biomedical Science and Engineering 4 (2011) 684-691 685 stand the characteristics of adipocytes. However, no pure adipocyte cell line has been isolated, and therefore, the characteristics of adipocytes have not yet been fully elu- cidated. In this study, we isolated a novel adipocyte cell line, which we confirmed based on its characteristics of triglyceride accumulation and TNFα secretion. We then used this cell line to screen for potential inhibitors of these functions. Our results may be useful for the pre- venting the development of metabolic syndrome in obese subjects. 2. MATERIALS AND METHODS 2.1. Cell Line and Culture Condition The mouse preadipocyte line, 3T3-L1, which was origin- nally generated from the Swiss albino mouse fibroblast cell line, 3T3, by Green [13] was obtained from Dainip- pon Sumitomo Pharma Corporation (Osaka, Japan). Dul- becco’s modified Eagle’s medium (DMEM) containing sodium bicarbonate (MP Biomedicals Inc., IIIkirch, France) and fetal bovine serum (FBS), which was treated at 56˚C for 30 min, were mixed at a ratio 9:1, and the mixture (DMEM medium containing 10% FBS) was used as a basic culture medium. The cells were cultured in a CO2 incubator at 37˚C. 2.2. Isolation of Adipocytes The following differentiation procedure was carried out to obtain pure adipocytes based on a revision of a method described in a previous study [14]. The 3T3-L1 preadipocytes (2.0 × 10⁵ cells) were cultured in 15 ml of DMEM medium containing 10% FBS for 2 days in 75 cm2 flasks, then the medium was replaced with DMEM containing 10% FBS, 0.5 µM of 3-iisobutyl-1-methylx- anthine (IBMX) and 4 µM of dexamethasone. The cells were cultured for 2 additional days to differentiate 3T3- L1 cells into adipocytes. The medium was replaced again with DMEM containing 10% FBS and 10 µg/mL of human insulin, and the cells were cultured for 2 addi- tional days to mature the cells. After three repeated differentiation steps to enrich the ratio of adipocytes to preadipocytes, the cells were sus- pended and diluted in DMEM containing 10% FBS. The diluted cells were cultured to construct single colonies in 8 ml medium in 10 cm2 plates for 7 days. A stainless cup (1 cm2 diameter) was used to covered each colony, then the cells were removed from the culture using 0.1 µl of 0.25% trypsin, collected in a 1.5 ml microtube, and washed with a DMEM medium containing 10% FBS. The cells collected from each colony were cultured in 5 ml of medium in 2.5 cm2 plates for 7 days. Finally, a cell line which contained more oil drops in comparison with the preadipocyte 3T3-L1 line was isolated as a novel adipocyte cell line, and was named 3T3-L24. 2.3. The Production of Triglycerides and TNFα in Preadipocytes and the Newly-Isolated Adipocytes The amounts of triglyceride and TNFα produced by the preadipocytes and adipocytes were examined. The prea- dipocyte 3T3-L1 cell line and the adipocyte 3T3-L24 cell line (5 × 10⁵ cells) were cultured in two 75 cm2 flasks containing 15 ml of DMEM medium for one day, and 0.28 mM oleic acid was added to one of the flasks. After another 3 days of culture, the culture broth was removed for the analysis. The triglyceride level in the cells was found to have gradually increased during the cultivation, and the culture conditions (the lot number of cells, pre-culture conditions, number of inoculated cells and culture time) also led to differences in the triglyc- eride level (data not shown). Thus, we elected to deter- mine the triglyceride content when 90% - 95% of the glucose in the medium was consumed. To measure the concentration, the cells were washed once with PBS solution containing 0.02 mM of EDTA, detached with 0.25% trypsin solution, and harvested. The concentra- tions of protein, triglycerides and TNFα in cells were assayed using the cells. A total of 3 - 4 independent ex- periments were performed, and the average values, standard error (S.E.) and p-value (by the t-test) were calculated. 2.4. The Effects of Additives on the Triglyceride and TNFα Production in Adipocytes The 3T3-L24 adipocytes (5 × 10⁵ cells), which were pre-cultured in 8 ml of DMEM containing 10% FBS, were cultured in several 75 cm2 flasks for one day, and then were exposed to 20 mM glycerol, 0.28 mM long- chain fatty acids (steric, oleic and linoleic acids), 0.5 mM of carboxylates (sodium acetate, sodium citrate, sodium malate and sodium oleate), 0.5 mM of carnitine, 0.5 mM of taurine). The effective concentration of the additive was determined by preliminary experiments (data not shown). After another 3 days of culture (90% - 100% of the glucose was consumed), the culture broth was removed, the cells were washed with 0.02 mM of EDTA/PBS solution, detached with 0.25% trypsin solu- tion, and harvested. The concentration of protein and triglyceride in the cells and the concentration of TNFα in the medium were analyzed. Three independent experi- ments were performed, and the average, S.E. and p-val- ues (by t-test) were calculated. 2.5. Assays The triglyceride concentration in the cells was analyzed by the following method developed in our laboratory: C opyright © 2011 SciRes. JBiSE 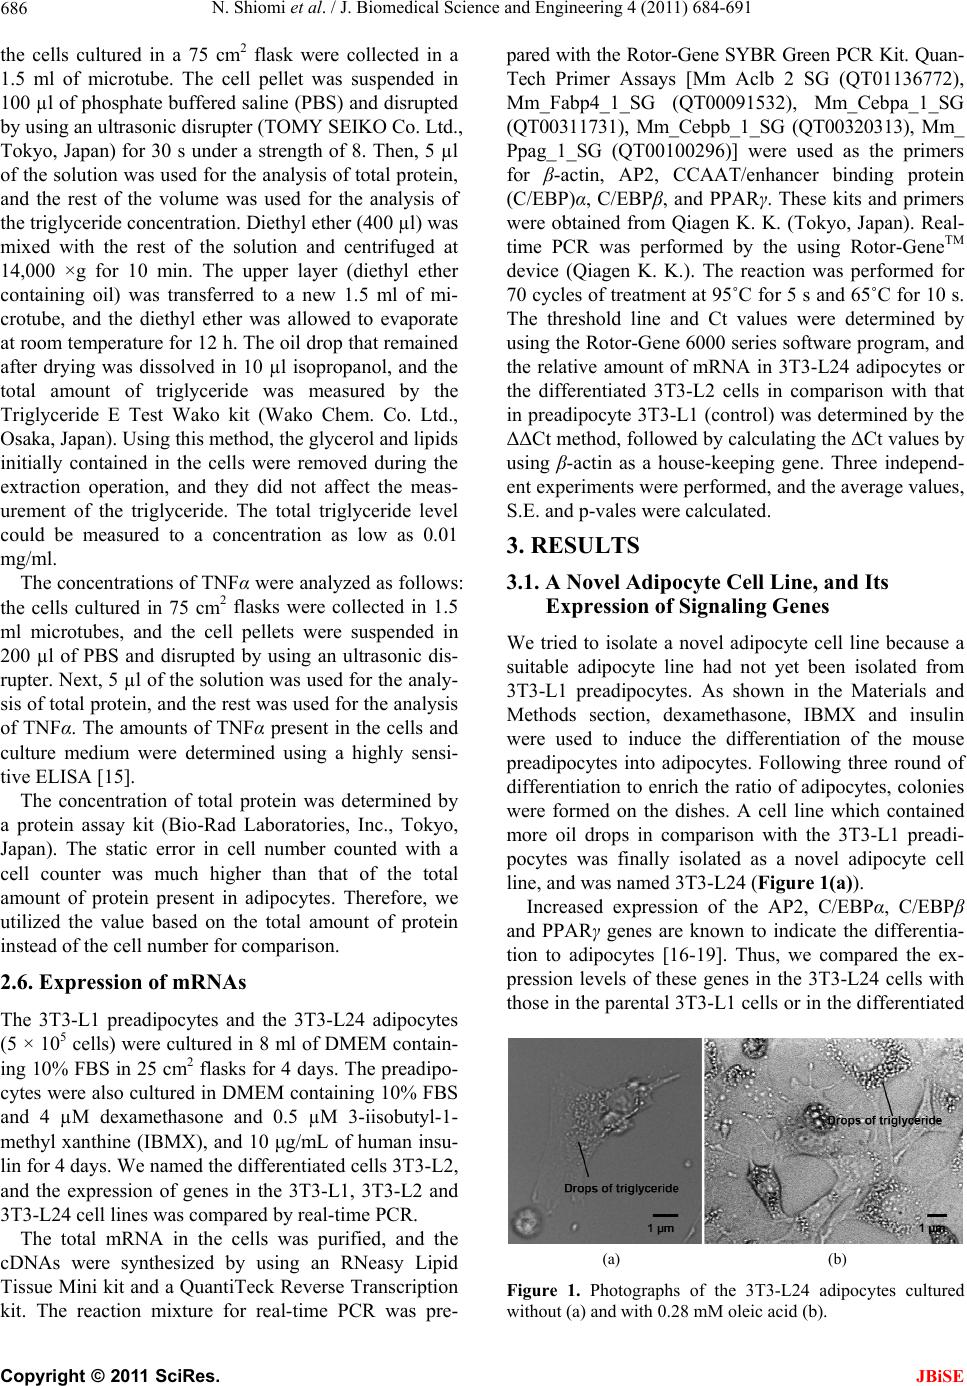 N. Shiomi et al. / J. Biomedical Science and Engineering 4 (2011) 684-691 686 the cells cultured in a 75 cm2 flask were collected in a 1.5 ml of microtube. The cell pellet was suspended in 100 µl of phosphate buffered saline (PBS) and disrupted by using an ultrasonic disrupter (TOMY SEIKO Co. Ltd., Tokyo, Japan) for 30 s under a strength of 8. Then, 5 µl of the solution was used for the analysis of total protein, and the rest of the volume was used for the analysis of the triglyceride concentration. Diethyl ether (400 µl) was mixed with the rest of the solution and centrifuged at 14,000 ×g for 10 min. The upper layer (diethyl ether containing oil) was transferred to a new 1.5 ml of mi- crotube, and the diethyl ether was allowed to evaporate at room temperature for 12 h. The oil drop that remained after drying was dissolved in 10 µl isopropanol, and the total amount of triglyceride was measured by the Triglyceride E Test Wako kit (Wako Chem. Co. Ltd., Osaka, Japan). Using this method, the glycerol and lipids initially contained in the cells were removed during the extraction operation, and they did not affect the meas- urement of the triglyceride. The total triglyceride level could be measured to a concentration as low as 0.01 mg/ml. The concentrations of TNFα were analyzed as follows: the cells cultured in 75 cm2 flasks were collected in 1.5 ml microtubes, and the cell pellets were suspended in 200 µl of PBS and disrupted by using an ultrasonic dis- rupter. Next, 5 µl of the solution was used for the analy- sis of total protein, and the rest was used for the analysis of TNFα. The amounts of TNFα present in the cells and culture medium were determined using a highly sensi- tive ELISA [15]. The concentration of total protein was determined by a protein assay kit (Bio-Rad Laboratories, Inc., Tokyo, Japan). The static error in cell number counted with a cell counter was much higher than that of the total amount of protein present in adipocytes. Therefore, we utilized the value based on the total amount of protein instead of the cell number for comparison. 2.6. Expression of mRNAs The 3T3-L1 preadipocytes and the 3T3-L24 adipocytes (5 × 10⁵ cells) were cultured in 8 ml of DMEM contain- ing 10% FBS in 25 cm2 flasks for 4 days. The preadipo- cytes were also cultured in DMEM containing 10% FBS and 4 µM dexamethasone and 0.5 µM 3-iisobutyl-1- methyl xanthine (IBMX), and 10 μg/mL of human insu- lin for 4 days. We named the differentiated cells 3T3-L2, and the expression of genes in the 3T3-L1, 3T3-L2 and 3T3-L24 cell lines was compared by real-time PCR. The total mRNA in the cells was purified, and the cDNAs were synthesized by using an RNeasy Lipid Tissue Mini kit and a QuantiTeck Reverse Transcription kit. The reaction mixture for real-time PCR was pre- pared with the Rotor-Gene SYBR Green PCR Kit. Quan- Tech Primer Assays [Mm Aclb 2 SG (QT01136772), Mm_Fabp4_1_SG (QT00091532), Mm_Cebpa_1_SG (QT00311731), Mm_Cebpb_1_SG (QT00320313), Mm_ Ppag_1_SG (QT00100296)] were used as the primers for β-actin, AP2, CCAAT/enhancer binding protein (C/EBP)α, C/EBPβ, and PPARγ. These kits and primers were obtained from Qiagen K. K. (Tokyo, Japan). Real- time PCR was performed by the using Rotor-GeneTM device (Qiagen K. K.). The reaction was performed for 70 cycles of treatment at 95˚C for 5 s and 65˚C for 10 s. The threshold line and Ct values were determined by using the Rotor-Gene 6000 series software program, and the relative amount of mRNA in 3T3-L24 adipocytes or the differentiated 3T3-L2 cells in comparison with that in preadipocyte 3T3-L1 (control) was determined by the ΔΔCt method, followed by calculating the ΔCt values by using β-actin as a house-keeping gene. Three independ- ent experiments were performed, and the average values, S.E. and p-vales were calculated. 3. RESULTS 3.1. A Novel Adipocyte Cell Line, and Its Expression of Signaling Genes We tried to isolate a novel adipocyte cell line because a suitable adipocyte line had not yet been isolated from 3T3-L1 preadipocytes. As shown in the Materials and Methods section, dexamethasone, IBMX and insulin were used to induce the differentiation of the mouse preadipocytes into adipocytes. Following three round of differentiation to enrich the ratio of adipocytes, colonies were formed on the dishes. A cell line which contained more oil drops in comparison with the 3T3-L1 preadi- pocytes was finally isolated as a novel adipocyte cell line, and was named 3T3-L24 (Figure 1(a) ). Increased expression of the AP2, C/EBPα, C/EBPβ and PPARγ genes are known to indicate the differentia- tion to adipocytes [16-19]. Thus, we compared the ex- pression levels of these genes in the 3T3-L24 cells with those in the parental 3T3-L1 cells or in the differentiated (a) (b) Figure 1. Photographs of the 3T3-L24 adipocytes cultured without (a) and with 0.28 mM oleic acid (b). C opyright © 2011 SciRes. JBiSE 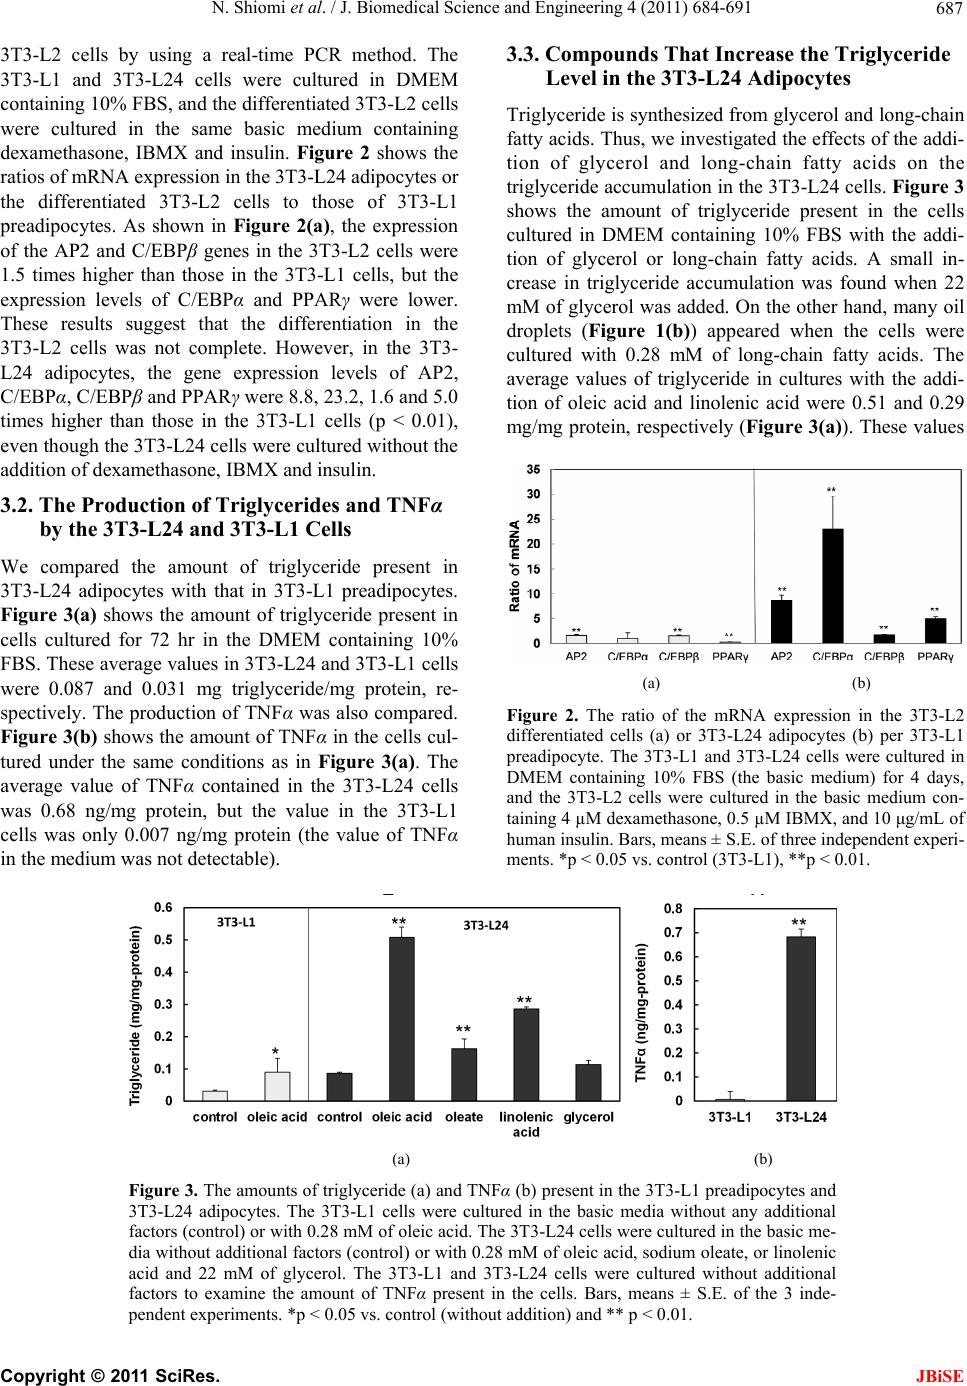 N. Shiomi et al. / J. Biomedical Science and Engineering 4 (2011) 684-691 Copyright © 2011 SciRes. 687 3.3. Compounds That Increase the Triglyceride Level in the 3T3-L24 Adipocytes 3T3-L2 cells by using a real-time PCR method. The 3T3-L1 and 3T3-L24 cells were cultured in DMEM containing 10% FBS, and the differentiated 3T3-L2 cells were cultured in the same basic medium containing dexamethasone, IBMX and insulin. Figure 2 shows the ratios of mRNA expression in the 3T3-L24 adipocytes or the differentiated 3T3-L2 cells to those of 3T3-L1 preadipocytes. As shown in Figure 2(a), the expression of the AP2 and C/EBPβ genes in the 3T3-L2 cells were 1.5 times higher than those in the 3T3-L1 cells, but the expression levels of C/EBPα and PPARγ were lower. These results suggest that the differentiation in the 3T3-L2 cells was not complete. However, in the 3T3- L24 adipocytes, the gene expression levels of AP2, C/EBPα, C/EBPβ and PPARγ were 8.8, 23.2, 1.6 and 5.0 times higher than those in the 3T3-L1 cells (p < 0.01), even though the 3T3-L24 cells were cultured without the addition of dexamethasone, IBMX and insulin. Triglyceride is synthesized from glycerol and long-chain fatty acids. Thus, we investigated the effects of the addi- tion of glycerol and long-chain fatty acids on the triglyceride accumulation in the 3T3-L24 cells. Figure 3 shows the amount of triglyceride present in the cells cultured in DMEM containing 10% FBS with the addi- tion of glycerol or long-chain fatty acids. A small in- crease in triglyceride accumulation was found when 22 mM of glycerol was added. On the other hand, many oil droplets (Figure 1(b)) appeared when the cells were cultured with 0.28 mM of long-chain fatty acids. The average values of triglyceride in cultures with the addi- tion of oleic acid and linolenic acid were 0.51 and 0.29 mg/mg protein, respectively (Figure 3(a)). These values 3.2. The Production of Triglycerides and TNFα by the 3T3-L24 and 3T3-L1 Cells We compared the amount of triglyceride present in 3T3-L24 adipocytes with that in 3T3-L1 preadipocytes. Figure 3(a) shows the amount of triglyceride present in cells cultured for 72 hr in the DMEM containing 10% FBS. These average values in 3T3-L24 and 3T3-L1 cells were 0.087 and 0.031 mg triglyceride/mg protein, re- spectively. The production of TNFα was also compared. Figure 3(b) shows the amount of TNFα in the cells cul- tured under the same conditions as in Figure 3(a). The average value of TNFα contained in the 3T3-L24 cells was 0.68 ng/mg protein, but the value in the 3T3-L1 cells was only 0.007 ng/mg protein (the value of TNFα in the medium was not detectable). (a) (b) Figure 2. The ratio of the mRNA expression in the 3T3-L2 differentiated cells (a) or 3T3-L24 adipocytes (b) per 3T3-L1 preadipocyte. The 3T3-L1 and 3T3-L24 cells were cultured in DMEM containing 10% FBS (the basic medium) for 4 days, and the 3T3-L2 cells were cultured in the basic medium con- taining 4 µM dexamethasone, 0.5 µM IBMX, and 10 μg/mL of human insulin. Bars, means ± S.E. of three independent experi- ments. *p < 0.05 vs. control (3T3-L1), **p < 0.01. (a) (b) Figure 3. The amounts of triglyceride (a) and TNFα (b) present in the 3T3-L1 preadipocytes and 3T3-L24 adipocytes. The 3T3-L1 cells were cultured in the basic media without any additional factors (control) or with 0.28 mM of oleic acid. The 3T3-L24 cells were cultured in the basic me- dia without additional factors (control) or with 0.28 mM of oleic acid, sodium oleate, or linolenic acid and 22 mM of glycerol. The 3T3-L1 and 3T3-L24 cells were cultured without additional factors to examine the amount of TNFα present in the cells. Bars, means ± S.E. of the 3 inde- pendent experiments. *p < 0.05 vs. control (without addition) and ** p < 0.01. JBiSE  N. Shiomi et al. / J. Biomedical Science and Engineering 4 (2011) 684-691 688 were much higher than the value without the addition of either of these factors (0.086 mg/mg protein). Further, the amount of triglyceride accumulation in cells sub- jected to culture media with the addition of sodium ole- ate was only 32% in comparison with the addition of oleic acid. Even in the 3T3-L1 preadipocytes, the amount of triglyceride was also enhanced from 0.031 to 0.090 mg/mg protein by the addition of 0.28 mM oleic acid (Figure 3(a)), but the value was much lower than that in the 3T3-L24 adipocytes (0.51 mg triglyceride/mg pro- tein). 3.4. Compounds That Inhibit Triglyceride and TNFα Production in Adipocytes We examined whether the triglyceride accumulation could be inhibited by using sodium acetate, citrate, car- nitine and taurine. As shown in Figure 4(a), the average triglyceride present in cells treated with the addition of sodium acetate, citrate, carnitine and taurine were de- creased to 57%, 39%, 79% and 26% in comparison of the cells treated without these factors (control) (all p < 0.01). Additionally, the cells were treated with these agents in combination with sodium oleate, which was used as a representative free fatty acid, and the effects of these compounds were examined again. As shown in Figure 4(b), the average triglyceride present in the cells treated with sodium citrate, carnitine and taurine were decreased to 44%, 33%, and 46% (all p < 0.01) of the control value, even in the presence of sodium oleate. Therefore, the additions of these compounds were effective to inhibit the triglyceride accumulation. The effects of triglyceride accumulation on TNFα se- cretion were also examined. Figure 5 shows the amount of TNFα present in the medium of cells cultured under the same conditions (except acetate) as in Figure 4. The concentration of TNFα in cells cultured with sodium oleate was decreased to 68% in comparison with those without (control). Moreover, when sodium citrate, car- nitine and taurine were added, the TNFα secretion was decreased to 90%, 38% and 43% in cells cultured with- out sodium oleate and 67%, 9.4% and 33% in cases where cells were also cultured with sodium oleate. Of interest, the values after treatment with carnitine and taurine were significantly different from the control (p < 0.01), although the value for sodium citrate was not sig- nificantly different from the control (unless the cells were cultured with sodium oleate). Finally, the relationship between the triglyceride ac- cumulation and TNFα expression was analyzed by cal- culating the correlation coefficient for the covariance. Figure 6 shows the covariance between the two factors as determined by using the average values in Figures 4 and 5. The correlation coefficient (r) was 0.63, and the value was increased to 0.87 when the values for sodium citrate were excluded. Therefore, there was a positive correlation between these two factors. 4. DISCUSSION The current study had two objectives: to isolate a novel adipocyte cell line and clarify the differences in the na- tive characteristics between adipocytes and preadipo- cytes, and to use the new-isolated adipocytes to screen for compounds that can affect the triglyceride and TNFα levels in the cells. Under the first objective, we isolated a novel adipo- cyte cell line by using the 3T3-L1 mouse preadipocytes. (a) (b) Figure 4. The effects of sodium carboxylates, carnitine and taurine on the triglyceride level in 3T3-L24 cells. The 3T3-L24 cells were cultured in the basic media without addi- tional factors (a) or with 0.28 mM sodium oleate; (b) A total of 0.5 mM of sodium acetate, sodium citrate, carnitine and taurine were respectively added in these media to examine their effects. The cells cultured in the media in (a) and (b) were used as control. Bars, means ± S.E. of 3 independent experiments. *p < 0.05 vs. control (without addition) and **p < 0.01. C opyright © 2011 SciRes. JBiSE  N. Shiomi et al. / J. Biomedical Science and Engineering 4 (2011) 684-691 689 (a) (b) Figure 5. The effects of sodium carboxylates, carnitine and taurine on the TNFα secretion by adipocytes. The 3T3-L24 cells were cultured under the same condi- tions as in Figure 4. Bars, means ± S.E. of 3 independent experiments. **p < 0.05 and *p < 0.01 vs. control (without addition). Figure 6. The relationship between the triglyceride level and TNFα secretion in the 3T3-L24 adipocytes. The average val- ues of triglycerides and TNFα secretion in Figures 4 and 5 were divided by these control values for normalization (control: 1). It is generally thought that the ratio of adipocytes to preadipocytes is very high in obese subjects in compare- son with normal-weight subjects. Therefore, a source of adipocytes is needed to better understand metabolic syn- drome. Many researchers [2-3] have used the preadipo- cyte 3T3-L1 cells as a useful model for adipocytes, be- cause they can be easily differentiated to 3T3-L2 adipo- cyte-like cells by the addition of induction compounds, such as dexamethasone, IBMX and a PPARγ antagonist [15]. However, as shown in Figure 2(a), the differenti- ated 3T3-L2 cells did not show the full characteristics of adipocyte, because the cells not only still contained many undifferentiated 3T3-L1 preadipocytes, but also had a low ratio of adipocytes to preadipocytes, and the ratio was not constant. Indeed, the newly-isolated 3T3-L24 cells, which were screened in this study, con- tained few preadipocytes, making them a more appropri- ate model for detailed in vitro research on adipocytes. We compared the genetic and biochemical character- istics between the 3T3-L24 and parental 3T3-L1 cells. In the genetic analysis, the expression of the AP2, C/EBPα, C/EBPβ and PPARγ genes were examined. These genes were previously suggested to play important roles in the differentiation of preadipocytes to adipocytes [16-19], and the genes were not expressed or only weekly ex- pressed in the 3T3-L1 preadipocytes as determined using a RT-PCR method [14]. As shown in Figure 2(b), all genes were highly expressed in the 3T3-L24 cells in the present study, and the expression was maintained in the absence of IBMX and other factors. Further, in a bio- chemical examination, 3T3-L24 adipocytes showed a higher capacity for triglyceride production than the 3T3-L1 preadipocytes, as shown in Figure 3(a). These results are in agreement with the reports that obese indi- viduals have a high ratio of adipocytes to preadipocytes and have gained a predisposition toward obesity [20]. Under the second objective, we screened various compounds for the ability to affect triglyceride produc- tion and TNFα secretion. Hypertrophic WAT in an obese subject causes inflammation, aging and obliteration of the bloodflow, and finally leads to the secretion of an undesirable amount of adipocytokines. Therefore, the inhibition of hypertrophy and adipocytokine secretion would be helpful to prevent the development of (or treat existing) metabolic syndrome. First, we examined the effects of glycerol and long- chain fatty acids, the components of triglycerides. As shown in Figure 3(a), the triglyceride levels were en- hanced upon the addition of long chain fatty acids, but were not enhanced by the addition of glycerol. Interest- ingly, the amount of triglyceride in response to the addi- tion of sodium oleate was lower than that in response to the addition of oleic acid. These results suggest the fol- lowing: there is already a sufficient amount of glycerol in cells to synthesize triglyceride by lipoprotein lipase, but long chain fatty acids are a limiting factor. The syn- thesis rate by lipoprotein lipase is a rate-limiting reaction when fatty acids are added to the culture, and the car- C opyright © 2011 SciRes. JBiSE  N. Shiomi et al. / J. Biomedical Science and Engineering 4 (2011) 684-691 690 boxyl group is the key factor involved in the synthesis. Therefore, this suggests that some carboxylates might act as a competitor of fatty acids in the reaction of lipo- protein lipase, and a decrease in fatty acids by degrada- tion might decrease the triglyceride level. To address these possibilities, the effects of some carboxylates were examined in the 3T3-L24 adipocytes which were cultured in medium with or without sodium oleate. As shown in Figure 4, the addition of a carboxy- late, such as sodium acetate or citrate, inhibited the triglyceride accumulation. Further, we examined the effects of addition of carnitine and taurine. Carnitine facilitates the transport of a fatty acid to an inner mem- brane of the mitochondria, and taurine consumes the acetyl CoA degraded from a fatty acid to synthesize cholesterol. These molecules are generally used as die- tary supplements and were previously pointed out to have a relationship with metabolic syndrome [21-23]. In adipocytes cultured in media containing additional car- nitine or taurine, triglyceride accumulation was inhibited (Figure 4(a)). Therefore, the enhancement of the degra- dation of fatty acid metabolism is also effective to de- crease the triglyceride accumulation. Finally, we also examined whether the expression of adipocytokines could be decreased by a decrease in triglyceride accumulation. TNFα, one of the main factors involved in type2 diabetes [9], was the focus of this study. As shown in Figures 3(b), the amount of TNFα produced and secreted by the adipocyte was much higher than the levels of the preadipocytes. In fact, TNFα was produced only in the adipocytes. This result suggests that the enhancement of TNFα in an obese subject might be caused by the increase in the ratio of adipocytes to preadipocytes. We also examined whether sodium citrate, carnitine and taurine could decrease the TNFα secretion by 3T3- L24 adipocytes under the same conditions. As shown in Figure 5, TNFα secretion (as well as triglyceride accu- mulation) could be decreased by the addition of sodium citrate, carnitine and taurine. The levels were especially decreased following the addition of carnitine or taurine. Further, the relationship between triglyceride accumula- tion and TNFα secretion in the adipocytes was analyzed (Figure 6), and the results suggested that the amount of triglyceride was related to the secretion of TNFα, be- cause the correlation factor was high (0.87) when cells were treated with carnitine or taurine. Obese individuals have increased concentrations of free fatty acids in their blood, which likely affects the development and progression of metabolic syndrome [24,25]. As shown in Figures 4(b) and 5(b), we exam- ined the effects of free fatty acids by using sodium oleate as a model compound. Although it was reported that fatty acids regulate the production of TNFα and IL-10 in 3T3-L1 cells [26], the addition of sodium oleate affected led to an increase in triglyceride accumulation but no significant change in TNFα secretion. However, as shown in Figures 4(b) and 5(b), even in cells cultured with so- dium oleate, the triglyceride accumulation and TNFα secretion could be inhibited by the addition of sodium citrate, carnitine and taurine. These results suggest that obese patients might be able to decrease the level of triglycerides in the WAT and the serum TNFα level by increasing their intake of carboxylates, including car- nitine and/or taurine. However, obese subjects have in- crease not only in free fatty acids, but also in insulin, cholesterol and other adipocytokines. We did not exam- ine the effects of all of these using the 3T3-24 adipo- cytes. Further studies are currently underway, and the results will be described in a subsequent manuscript. 5. ACKNOWLEDGEMENTS Our group greatly thanks Ms. S. Aida, A. Fujiwara, K. Imanaka, Y. Kanda, S. Nakayama, H. Shiotsu, A. Sogo, M. Tanaka, Y. Tanaka, M. Yamashita and S. Sunami for their assistance with our research. This work was supported by grant-in aids from the School of Human Sci- ences and the laboratory at Kobe College. REFERENCES [1] Egusa, G., Murakami, F., Ito, C., Matsumoto, Y., Kado, S., Okamura, M., Mori, H., Yamane, K., Hara, H. and Ya- makido, M. (1993) Westernized food habits and concen- trations of serum lipids in the Japanese. A therosclerosis, 100, 249-255. doi:10.1016/0021-9150(93)90211-C [2] Ahima, R.S. (2006) Adipose tissue as an endocrine organ. Obesity, 14, 242-249. doi:10.1038/oby.2006.317 [3] Rosen, E.D. and Spiegelman, B.M. (2000) Molecular regulation of adipogenesis. Annual Review of Cell Biol- ogy, 16, 145- 171. doi:10.1146/annurev.cellbio.16.1.145 [4] Matuzawa, Y. (2006) The metabolic syndrome and adi- pocytokines. FEBS Letters, 580, 2917-292. doi:10.1016/j.febslet.206.04.028 [5] Maeda, K., Okubo, K., Shimomura, I., Funahashi T. and Matsuzawa, K. (1996) cDNA cloning and expression of novel adipose specific collagen-like factor apM1. Bio- chemical and Biophysical Research Communications, 221, 286-289. doi:10.1006/bbrc.1996.0587 [6] Szkudelski, T. (2006) Intercellular mediators in regula- tion of leptin secretion from adipocytes. Physiological Research, 56, 503-512. [7] Hotamisligi, G.S., Peraldi, P., Budavari, A., Ellis, R., White, M.F. and Spiegelman, B.M. (1996) IRS-1-medi- ated inhibition of insulin receptor tyrosine kinase activity in TNF-alpha- and obesity induced insulin resistance. Science, 271, 665-668. doi:10.1126/science.271.5249.665 [8] Yamaguchi, T., Kamo, J., Waki, H., Terauchi, Y., Kubota, N., Hara, K., Mori, Y., Ide, T., Murakami, K., Tsuboyama- Kasaoka, N., Ezaki, O., Akanuma, Y., Gavrilova, O., Vinson, C., Reitman, M.L., Kagechika, H., Shudo, K., C opyright © 2011 SciRes. JBiSE  N. Shiomi et al. / J. Biomedical Science and Engineering 4 (2011) 684-691 Copyright © 2011 SciRes. 691 JBiSE Yoda, M., Nakano, Y., Tobe, K., Nagai, R., Kimura, S., Tomita, M., Froguel, P. and Kadowaki, T. (2001) The fat- derived hormone adiponectin reverses insulin resistance associated with both lipoatrophy and obesity, Nature Medicine, 7, 941-946. doi:10.1038/090984 [9] Simomura, I., Hammer, R.E., Ikemoto, S., Brown, M.S. and Gorldstein, J.L. (1999) Leptin reverses insulin resis- tance and diabetes mellitus in mice with congenital li- podystrophy. Nature, 401, 73-76. doi:10.1038/43448 [10] Hotamisligil, G.S., Sharg, N.S. and Spiegelman, B.M. (1993) Adipose expression of tumor necrosis factor-α: Direct role in obesity-linked insulin resistance. Science, 259, 87-91. doi:10.1126/science.7678183 [11] Bastard, J.P., Maachi, M., Lagathu, C., Kim, M.J., Caron, M., Vidal, H., Capeau, J. and Feve, B. (2006) Recent ad- vances in the relationship between obesity, inflammation, and insulin resistance. European Cytokine Network, 17, 4-12. [12] Minamimoto, T., Orimo, M., Shimizu, I., Kunieda, T., Yokoyama, M., Ito, T., Nojima, A., Nabetani, A., Oike, Y., Matsubara, H., Ishikawa, F. and Komuro, I. (2009) A crucial role for adipose tissue p53 in the regulation of insulin resistance. Nature Medicine, 15, 1082-1087. doi:10.1038/nm.2014 [13] Green, H. and Kehinde, O. (1975) An established prea- dipose cell line and its differentiation in culture. II. Fac- tors affecting the adipose conversion. Cell, 5, 19-27. doi:10.1016/0092-8674(75)90087-2 [14] Gregoire, F.M., Smas, C.M. and Sul, H.S. (1998) Under- standing adipocyte differentiation. Physiologcal Review 78, 783-809. [15] Mimura, M., Nabeshima, R., Maeda, M. and Shiomi, N. (2008) A highly sensitive enzyme-linked immunosorbent assay for quantification of adipocytokines secreted by mouse adipocytes. Biochemical Engineering Journal, 43, 58-63. doi:10.1016/j.bej.2008.08.008 [16] Tang, Q.Q. and Lane, M.D. (2000) Role of C/EBP ho- mologous protein (CHOP-10) in the programmed activa- tion of CCAAT/enhancer binding protein-β during adi- pogenesis. Proceeding of National Academy of Science in USA, 97, 12446-12450. doi:10.1073/pnas.220425597 [17] Noon, L.A., Clark, A.K. and King, P.J. (2004) A perox- isome proliferatore-response element in the murine mc2-γ promoter regulates its transcriptional activation during differentiation of 3T3-L1 adipocytes. Journal of Biological Chemistry, 279, 22803-22808. doi:10.1074/jbc.M401861200 [18] Prusty, D., Park, B.H., Davis, K.E. and Farmer, S.R. (2002) Activation of MEK/ERK signaling promotes adi- pogenesis by enhancing peroxisome proliferation-acti- vated receptor γ (PPARγ) and C/EBPα gene expression during the differentiation of 3T3-L1 preadipocytes. Jour- nal of Biological Chemistry, 277, 46226-46232. doi:10.1074/jbc.M207776200 [19] Wu, Z., Rosen, E.D., Brun, R., Hauser, S., Adelmat, G., Troy, A.E., Mckeon, C., Darlington, G.J. and Spiegelman, B.M. (1999) Cross-regulation of C/EBP alpha and PPARγ controls the transcriptional pathways of adipogenesis and insulin sensitivity. Molecular Cell, 3, 151-158. doi:10.1016/S1097-2765(00)80306-8 [20] Ruderman, N., Chisholm, D., Pi-Sunyer, X. and Schnei- der, S. (1998) The metabolically obese, normal-weight individual revisited. Diabetes, 47, 699-713. doi:10.2337/diabetes.47.5.699 [21] Ishikawa, M., Arai, S., Takano, M., Hamada, A., Kuni- masa, K. and Mon, M. (2010) Taurin’s health influence on Japanese school girls. Journal of Biomedical Science, 17, S47. doi:10.1186/1423-0127-17-S1-S47 [22] Kim, H.M., Do, C.H. and Lee, D.H. (2010) Characteriza- tion of taurine as anti-obesity agent in C. elegans. Jour- nal of Biomedical Science, 17, S33. doi:10.1186/1423-0127-17-S1-S33 [23] Derosa, G., Maffioli, P., Ferrari, I., D’Angelo, A., Fogari, E., Palumbo, I., Randazzo, S. and Cicero, A.F. (2011) Orlistat and L-carnitine compared to orlistat alone on in- sulin resistance in obese diabetic patients. Endocrine Journal, 57, 777-786. doi:10.1507/emdocrj.K10E-049 [24] Warensjö, E., Sundström, J., Lind, L. and Vessby, B. (2006) Factor analysis of fatty acids in serum lipids as a measure of dietary fat quality in relation to the metabolic syndrome in men. American Journal of Clinical Nutri- tion, 84, 442-448. [25] Warensjö, E., Risèrus, U. and Vessby, B. (2005) Fatty acid composition of serum lipids predicts the develop- ment of the metabolic syndrome in men. Diabetologia, 48, 1999-2005. doi:10.1007/s00125-005-1897-x [26] Badley, R.L., Fisher, F.M. and Maratos-Fisher, E. (2008) Dietary acids differentially regulate production of TNF- alpha and IL-10 by murine 3T3-L1 adipocytes. Obesity, 16, 938-944. doi:10.1038/oby.2008.39
|