Paper Menu >>
Journal Menu >>
 Wireless Sensor Network, 2009, 1, 293-299 doi:10.4236/wsn.2009.14036 Published Online November 2009 (http://www.scirp.org/journal/wsn). Copyright © 2009 SciRes. WSN A New Method for Anti-Noise FM Interference Changyong JIANG, Meiguo GAO, Defeng CHEN Department of Electronics Engineering, Beijing Institute of Technology, Beijing, China Email: jieshi08@gmail.com Received May 30, 2009; revised June 20, 2009; accepted June 21, 2009 Abstract Noise Frequency Modulated (NFM) interference causes a disaster to almost all types of Radar systems. The echo signal and the interference are overlapped and because of strong energy of the NFM interference noth- ing could be detected except the interference in the Radar receiver system. Up to now no good method against NFM has been declared, conventional methods are based on the passive Radar to track the interfer- ence source which are not applicable under most conditions. Here a novel anti-noise FM method is proposed to suppress the NFM interference, the method multiply the mixed signal two times by different reference signals. The principle and some key factors of the new method are analyzed in detail and some rules for pa- rameters designing are given. What’s more, results show that the method can eradicate NFM effectively. Keywords: ECM, ECCM, NFM Interference, Anti-NFM 1. Introduction FM jamming is a common jamming forms in oppressive jamming on radar systems [1–2]. Noise FM is a mostly used ECM method, and can cause disasters to nearly all types of Radar systems. So, analysis of the performance of NFM in ECM and solutions against NFM in ECCM has developed for years. [3] Proposed the noise FM jamming method. The effect of noise FM jamming against ISAR one or two-dimensional imaging is de- scribed in detail, and the power requirement of noise FM jamming is compared with that of RF noise jamming. Song [4] uses growth factor analyzed the capability of radar MTI in noise FM jamming. Liu [5] uses signal to jamming ratio (SJR) gains discussed the performance of anti-noise FM jamming of PRC-BPM fuze. [6] uses the effect of Doppler f requency, pseudo-random co de width, the effect of period pseudo-random code serial and aim- ing frequency deviation analyzed the performance of the pseudo-random code binary phase modulated (PRC- BPM) fuze. Xu [7] gave methods of multipath jammer tracking with a passive radar seeker. Chen [8] studied the formula of composite phase-difference of two noise FM jamming. Deergha Rao. K. [9] presented an approach based on jammer instantaneous frequency estimation for suppression of frequency modulated jammers in spread spectrum systems. [10] Focus on Subspace Projection Technique for suppression of jamming in narrowband FM jammers, however, NFM interference is a wideband interference that this technique in [10] cannot be applied. [11] presented performance analysis of subspace projec- tion array processing techniques for suppression of fre- quency modulated (FM) jammers in GPS receivers, and based on this [12] made the approach applied to AM-FM jammers as well, however, the subspace projection tech- niques are not available under some radar receivers. [13] offered a method against NFM based on Square Trans- formation, however, it is only described in the applica- tion of Pseudo-random Coded Fuze and analog circuits. Above all, these research es made big progress in finding solutions against NFM, but the methods cannot totally resolve the problem in the radar systems. Based on all the previous researches, a method is pro- posed to eliminate NFM in this paper. It multiply the mixed signal by two different reference signals two times and with followed signal processing the needed signal can be obtai ned from the output. The paper is organized as follows. In Section 2, the echo signal model and NFM interference model are de- scribed in detail. Section 3 depicts how the new method supposed here excise NFM interference and some key factors of the method are analyzed. Section 4 gives the performance analysis of the method. And some conclu- sions are given in the last section. 2. Signal Model Noise FM is a commonly used method for jamming wireless communication systems such as Radar systems, GPS etc. It has a strong suppress to the needed signal and  294 C. Y. JIANG ET AL. its bandwidth is much wider than the needed signal. The noise-FM is modeled as1 0 cos NFM i ci t s tAtkf d ci (1) where Ai is the amplitude of NFM interference, is the carrier frequency of NFM interference, and k is the FM slope. The bandwidth of the NFM interference is BWi. The echo signal from the target is defined as cos use u 2 c0 s tAtkt c (2) where Au is the amplitude of the echo signal, is the carrier frequency of the echo signal, and k0 is the FM slope (k0=0 when the signal suse(t) is CW and k0≠0 when the signal suse(t) is chirp ). The bandwidth of the echo signal is BW. It is known that in order to make the inter- ference more effective,ci c , iu A A i BW BW use and must be satisfied. Thus it is hard to obtain the needed signal suse(t) neither from time domain nor frequency domain. Without loss of generality, mixed signal which enters the radar receiver is defined as NFM s tstst aab bab aab (3) where sNFM(t) is defined in Equation (1), suse(t) is defined in Equation (2). 3. Nfm Excision 3.1. Basic Concept This part simply shows what the new method derivate from. It is supposed that two variables, “a” and “b” are here. How to change each other’s value without any other variable? A simple description of solving this ques- tion is shown below. First, let (4) Now the value of variable “a” becomes sum of “a” and “b”, the value of variable “b” remains the same. Second, let (5) then the value of variable “a” remains the same, the value of variable “b” becomes the value of “a” which is before Equation (4). Last, let (6) And the aim of changing values of “a” and “b” is reached. Similarly, if two signals are mixed together, it is pos- sible to separate them in the same way above. 3.2. Principle of the New Method As is known to all, it is easy to get two signals added with each other in the frequency domain just by multi- plying each other. Two signals multiplied with each other in the time domain means that their frequencies are added with each other in the frequency domain. In this way the new method contains two steps which mainly consist of two multiplications, so it is called “dou- ble-multiplication” method in the next chapters. 3.2.1. The First Step of Double-Mul tiplication Method The first step of double-multiplication method can be seen from Figure 1. It contains a multiplication, a low pass filter and DC blocked module. The multiplication is 0M s tstst (7) And all parts obtained after this multiplication are as follows, direct current: 22 /2 /2 DCu i stA A (8) low frequency part: 2 10 0 cos t Miu cic tAAkf dtkt (9) s the part whose carrier frequency is nearly twice as large as c : 2 01 /2 cos2 Mu c s tA t (10) 2 02 0 /2 cos 22t Mi ci s tA tkfd (11) 2 03 0 0 cos t Miucic tAAtkf dkt (12) s After sM0(t) goes through a low pass filter and DC blocked module, signals described in Equation (8), (10), (11), (12) are filtered and only sM1(t) is left. 3.2.2. The Second Step of Double-Multiplication Method The second step of double-multiplication method can be seen from Figure 1. It contains a multiplication, a band pass filter. The second multiplication is 21MM ststst (13) And all the parts obtained are as follows. The parts whose carrier frequency is nearly the same with c : 22 210 0 cos 22t Muicci s tAAtktkf d (14) Copyright © 2009 SciRes. IJCNS  C. Y. JIANG ET AL. 295 C opyright © 2009 SciRes. WSN 2 22 cos Mu i0 t ci s tAAtkfd (15) 22 0uc23 cos Mi s tAAtkt (16) 2 24 0 cos 22t Miucic 2 0 s tAAtk f dkt g10( /) iu (17) It is obvious that sM23(t) is the needed signal which just only has a different amplitude with suse(t). Let sM2(t) go through a band pass filter (BPF) which has a center frequency of fc and a bandwidth of BW. As is known that Ai>>Au, sM21(t) and sM22(t) can be omitted compared to sM23(t). What’s more, as BWi>>BW and sM24(t) has a bandwidth of 2BWi, sM24(t) left little after the band pass filter. Thus the needed signal is obtained. The whole process of the method is shown in Figure 1. 3.3. Analysis of Ke y Facto rs in Double - Multiplicati on Method The output signal, sout(t), from the process of dou- ble-multiplication method contains four parts which are described in Equation (14), (15), (16) and (17). Usually the higher the interference to signal ratio (ISR) is, the more effectivel y the in terf erence works ; and the wider the bandwidth of NFM interference is, the more effectively the interference works. So the two factors, ISR and the bandwidth of NFM interference, are analyzed as follows. 3.3.1. Interference to Signal Ratio 1) Relationship between ISR and SIR The interference to signal ratio (ISR) is defined as 20lo I SR A A (18) From Equation (18) it is known that the higher the ISR is, the bigger the Ai/Au is. According to Equation (15), (16) and (17), among the output signal sM2(t) the needed signal to interference ratio is 23 22 22 10log10 / 20log10 / 20log10 1/// MM iuui i uii SIRPstP st AAAA AA AABWBW 24 2/ M u i P st BWBW (19) For a certain bandwidth of NFM interference, the BW/BWi is a constant. As ISR increases, Ai/Au also in- creases, thus SIR described in Equation (19) increases, too. Hence a conclusion is obtained: the higher the ISR is, + + st st LPF DC blocked 2 st M delay BPF out s t BC D The first stepThe second step A 0M st 1M st Figure 1. Structure of double-multiplication method. the bigger the SIR is, which means that the higher the ISR is, the more efficient the new method is. 2) Relationship between ISR and low pass filter Within the first step of double-multiplication method, after multiplication the power of sM02(t) to sM1(t) ratio is 02 120log10/2 MMu i (20) s sRAA c Although the carrier frequency of sM02(t) is nearly twice as large as and sM02(t) is out of the passband of LPF, if the stopband attenuation of LPF is smaller than sM021sM1R, the interference signal sM02(t) may not be filtered from sM1(t) by the low pass filter. So the design of stopband attenuation of LPF must be bigger than sM021sM1R dB. Hence another conclusion is obtained: the higher the ISR is, the bigger the stopband attenuation of LPF must be. Above all, two conclusions related to ISR are ob- tained as follows. The higher the ISR is, the more efficient the dou- ble-multiplication method is. The higher the ISR is, the bigger the stopband attenuation of LPF must be. 3.3.2. Bandwidth of NFM Interference For a certain ISR, the Au/Ai is a constant. As BWi, the bandwidth of NFM increases, SIR described in Equation (19) increases, too. So the bigger the bandwidth of NFM interference is, the h igher the SIR is, which means that the more efficient the double-multiplication method is. However, the bandwidth of NFM interference is un- known under most conditions. Thu s the stopband of the low pass filter cannot be decided. If the stopband of the LPF is smaller than the bandwidth of NFM interference, the output of the first step, i.e. sM1(t), may not be cor- rectly obtained. There are two ways to solve this prob- lem: 1) Measuring the bandwidth of NFM interference if the receiver system is capable of this; 2) Designing the LPF with a high stopband as possible as the receiver system can. Above all, conclusions related to bandwidth of NFM interference are drawn as follows. The bigger the bandwidth of NFM interference is, the more efficient the new method is. When bandwidth of NFM interference is un- known, it is better to measure the bandwidth of NFM interference, otherwise to design the LPF with a high stopband as possible as the receiver system can. 4. Performance Analysis Without loss of generality, considering the echo signal is CW signal and A use=1, fc=100.2MHz. And simulation results are depicted as follows.  296 C. Y. JIANG ET AL. Copyright © 2009 SciRes. IJCNS It is supposed that the bandwidth of NFM interference is known as 20MHz and ISR is 40dB. Simulation results can be seen from Figure 2 and Figure 3. In Figuer 2 the graph above is the spectrum of the mixed signal which contained the echo signal and the NFM interference, the graph below shows the spectrum of the signal which is the output (at dot “B” in Figure 1) after the first step. In Figure 3 the graph above is the spectru m of signal which is the output (at dot “C” in Figure 1) after the second multiplication, the graph below shows the spectrum of signal which is the output (at dot “D” in Figure 1) after the whole process of double-multiplication method. From the graph above in Figure 2 it is obvious that the echo signal and NFM interference are overlapped with each other and the echo signal cannot be distinguished from the interference. However, the graph below in Fig- ure 3 shows that the output signal is mainly the echo signal after the process of double-multiplication method. 80100 120140 160 180200 0 1 2 3x 10 5 The spectrum of mi x ed si gnal (M Hz ) 010 20 304050 6070 8090 2x 10 5 100 0 0. 5 1 1. 5 The s pectrum of s i gnal aft er t he firs t s tep. (MHz) Figure 2. Spectrum of signals at different time. 80100 120140 160 180 15 x 10 7 200 0 5 10 X: 100.2 Y: 1.038e+008 The s pectrum of s i gnal after t he second m ultiplication. (M Hz) 80100 120140 160 180 6x 10 7 200 0 2 X: 100.2 Y: 5.179e+007 4 The s pectrum of out put signal. (M Hz) Figure 3. Spectrum of signals at different time. 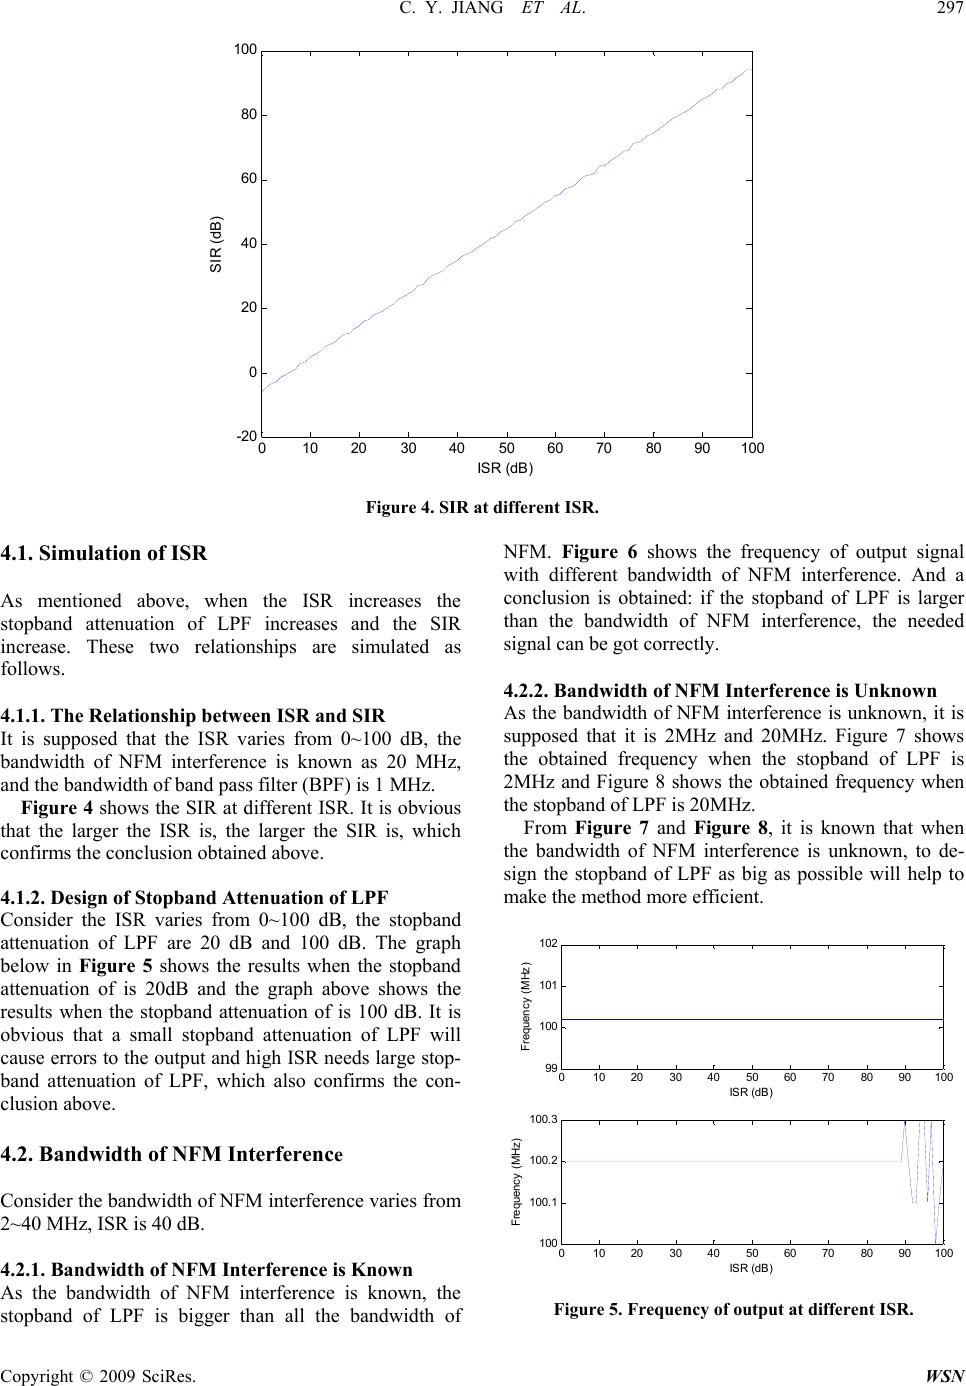 C. Y. JIANG ET AL. 297 100 010 2030 405060708090100 -20 0 20 40 60 80 ISR (dB) SIR (dB) Figure 4. SIR at different ISR. 4.1. Simulation of ISR As mentioned above, when the ISR increases the stopband attenuation of LPF increases and the SIR increase. These two relationships are simulated as follows. 4.1.1. The Relationship between ISR and SIR It is supposed that the ISR varies from 0~100 dB, the bandwidth of NFM interference is known as 20 MHz, and the bandwidth of band pass filter (BPF) is 1 MHz. Figure 4 shows the SIR at different ISR. It is obvious that the larger the ISR is, the larger the SIR is, which confirms the conclusion obtained above. 4.1.2. Design o f Sto pband Attenuation o f L PF Consider the ISR varies from 0~100 dB, the stopband attenuation of LPF are 20 dB and 100 dB. The graph below in Figure 5 shows the results when the stopband attenuation of is 20dB and the graph above shows the results when the stopband attenuation of is 100 dB. It is obvious that a small stopband attenuation of LPF will cause errors to the output and high ISR needs large stop- band attenuation of LPF, which also confirms the con- clusion above. 4.2. Bandwidth of NFM Interference Consider the bandwidth of NFM interference varies from 2~40 MHz, ISR is 40 dB. 4.2.1. Bandwidth of NFM Interference is Known As the bandwidth of NFM interference is known, the stopband of LPF is bigger than all the bandwidth of NFM. Figure 6 shows the frequency of output signal with different bandwidth of NFM interference. And a conclusion is obtained: if the stopband of LPF is larger than the bandwidth of NFM interference, the needed signal can be got correctly. 4.2.2. Bandwidth of NFM Interference is Unknown As the bandwidth of NFM interference is unknown, it is supposed that it is 2MHz and 20MHz. Figure 7 shows the obtained frequency when the stopband of LPF is 2MHz and Figure 8 shows the obtained frequency when the stopband of LPF is 20MHz. From Figure 7 and Figure 8, it is known that when the bandwidth of NFM interference is unknown, to de- sign the stopband of LPF as big as possible will help to make the method more efficient. 010 2030 4050 60 7080 90 100 99 100 101 102 (MHz) ISR ( dB) Frequency 100. 3 010 2030 4050 60 7080 90 100 100 100. 1 100. 2 ISR ( dB) Frequency (MHz ) Figure 5. Frequency of output at different ISR. C opyright © 2009 SciRes. WSN 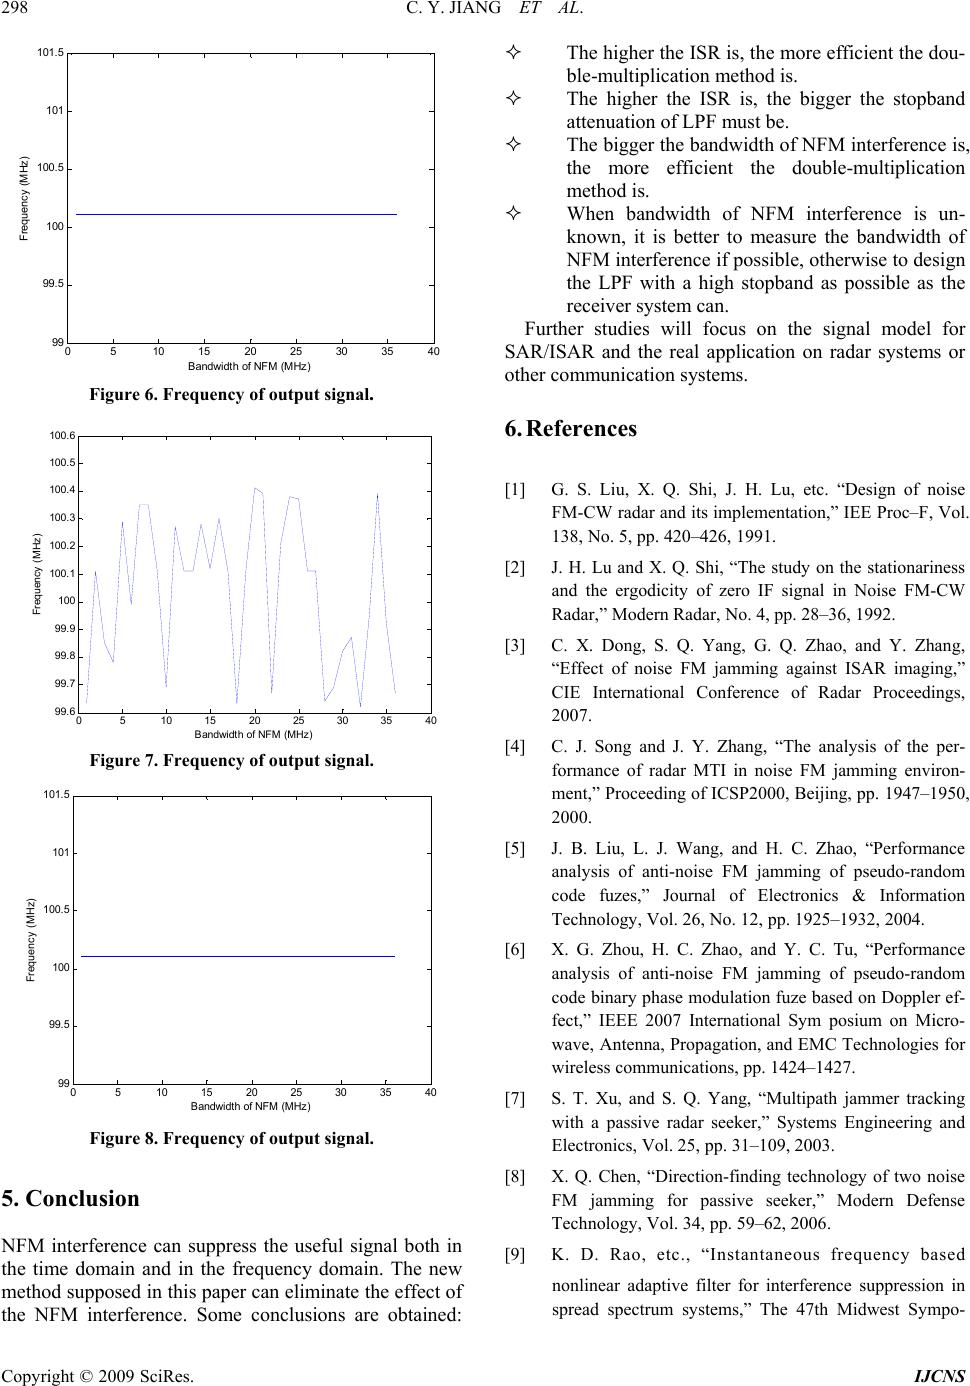 298 C. Y. JIANG ET AL. 05 10 1520 25 30 3540 99 99. 5 100 100. 5 101 101. 5 Ba ndwi dth of NFM (M Hz) Frequen c y (M Hz) Figure 6. Frequency of output signal. 05 10 15 20 25303540 99. 6 99. 7 99. 8 99. 9 100 100. 1 100. 2 100. 3 100. 4 100. 5 100. 6 B andwi dth of NFM (M Hz ) Frequency (MHz ) Figure 7. Frequency of output signal. 0510 15202530 35 40 99 99.5 100 100. 5 101 101. 5 B andwidth of NFM (M Hz) Frequenc y (MHz ) 04. 06. Figure 8. Frequency of output signal. 5. Conclusion NFM interference can suppress the useful signal both in the time domain and in the frequency domain. The new method supposed in this paper can eliminate the effect of the NFM interference. Some conclusions are obtained: The higher the ISR is, the more efficient the dou- ble-multiplication method is. The higher the ISR is, the bigger the stopband attenuation of LPF must be. The bigger the bandwidth of NFM interference is, the more efficient the double-multiplication method is. When bandwidth of NFM interference is un- known, it is better to measure the bandwidth of NFM interference if possible, otherwise to design the LPF with a high stopband as possible as the receiver system can. Further studies will focus on the signal model for SAR/ISAR and the real application on radar systems or other communication systems. 6. References [1] G. S. Liu, X. Q. Shi, J. H. Lu, etc. “Design of noise FM-CW radar and its implementation,” IEE Proc–F, Vol. 138, No. 5, pp. 420–426, 1991. [2] J. H. Lu and X. Q. Shi, “The study on the stationariness and the ergodicity of zero IF signal in Noise FM-CW Radar,” Modern Radar, No. 4, pp. 28–36, 1992. [3] C. X. Dong, S. Q. Yang, G. Q. Zhao, and Y. Zhang, “Effect of noise FM jamming against ISAR imaging,” CIE International Conference of Radar Proceedings, 2007. [4] C. J. Song and J. Y. Zhang, “The analysis of the per- formance of radar MTI in noise FM jamming environ- ment,” Proceeding of ICSP2000, Beijing, pp. 1947–1950, 2000. [5] J. B. Liu, L. J. Wang, and H. C. Zhao, “Performance analysis of anti-noise FM jamming of pseudo-random code fuzes,” Journal of Electronics & Information Technology, Vol. 26, No. 12, pp. 1925–1932, 20 [6] X. G. Zhou, H. C. Zhao, and Y. C. Tu, “Performance analysis of anti-noise FM jamming of pseudo-random code binary phase modulation fuze based on Doppler ef- fect,” IEEE 2007 International Sym posium on Micro- wave, Antenna, Propagation, and EMC Technologies for wireless communications, pp. 1424–1427. [7] S. T. Xu, and S. Q. Yang, “Multipath jammer tracking with a passive radar seeker,” Systems Engineering and Electronics, Vol. 25, pp. 31–109, 2003. [8] X. Q. Chen, “Direction-finding technology of two noise FM jamming for passive seeker,” Modern Defense Technology, Vol. 34, pp. 59–62, 20 [9] K. D. Rao, etc., “Instantaneous frequency based nonlinear adaptive filter for interference suppression in spread spectrum systems,” The 47th Midwest Sympo- Copyright © 2009 SciRes. IJCNS 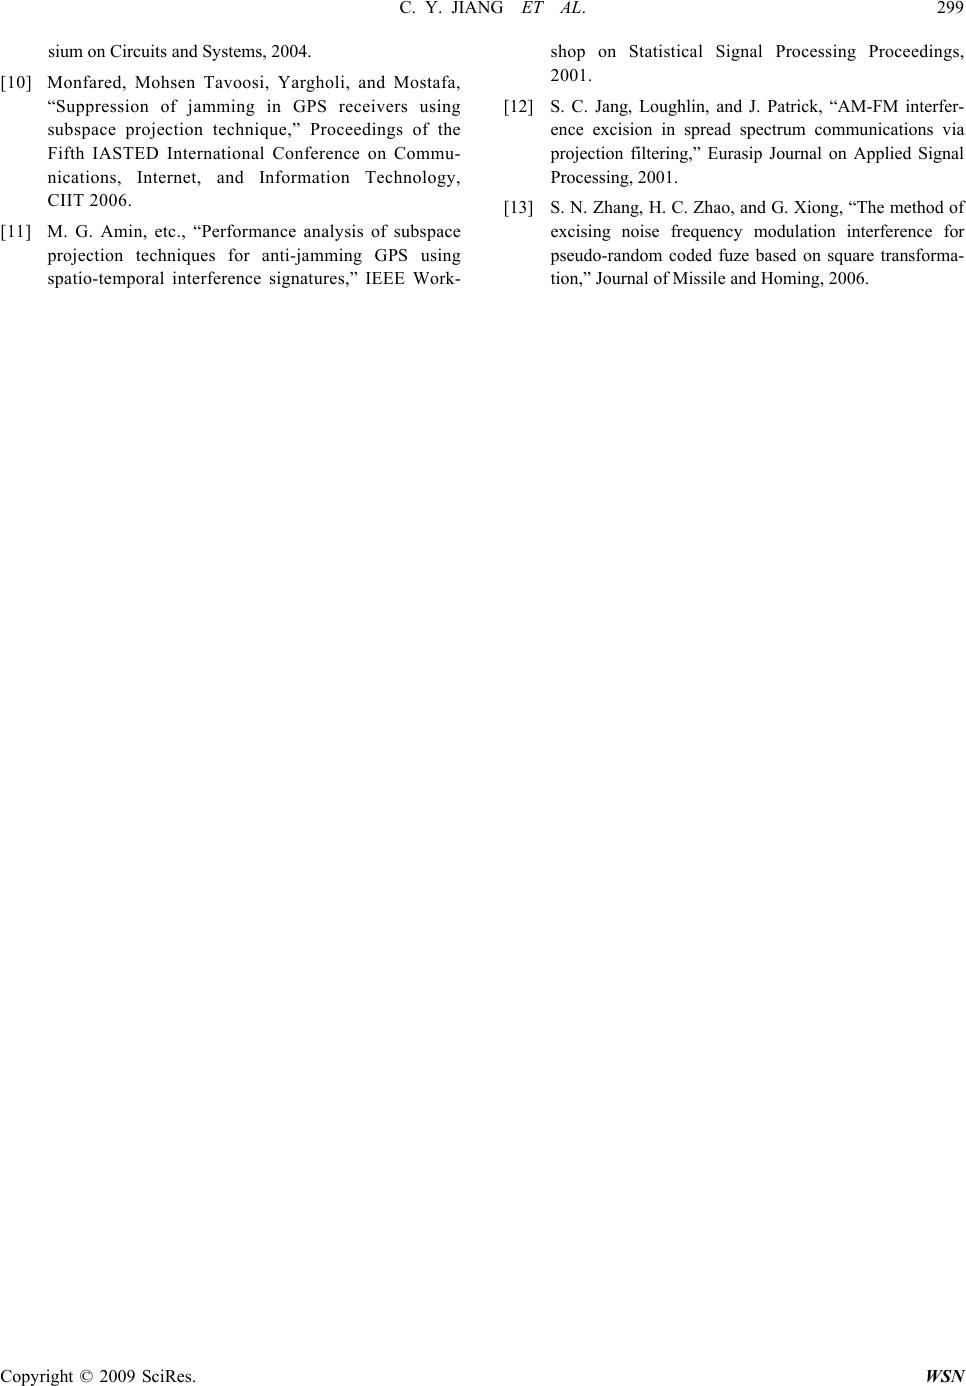 C. Y. JIANG ET AL. 299 Copyright © 2009 SciRes. WSN sium on Circuits and Systems, 2004. [10] Monfared, Mohsen Tavoosi, Yargholi, and Mostafa, “Suppression of jamming in GPS receivers using subspace projection technique,” Proceedings of the Fifth IASTED International Conference on Commu- nications, Internet, and Information Technology, CIIT 2006. [11] M. G. Amin, etc., “Performance analysis of subspace projection techniques for anti-jamming GPS using spatio-temporal interference signatures,” IEEE Work- shop on Statistical Signal Processing Proceedings, 2001. [12] S. C. Jang, Loughlin, and J. Patrick, “AM-FM interfer- ence excision in spread spectrum communications via projection filtering,” Eurasip Journal on Applied Signal Processing, 2001. [13] S. N. Zhang, H. C. Zhao, and G. Xiong, “The method of excising noise frequency modulation interference for pseudo-random coded fuze based on square transforma- tion,” Journal of Missile and Homing, 2006. |