 Vol.1, No.3, 94-100 (2011) doi:10.4236/ojpm.2011.13014 C opyright © 2011 SciRes. Openly accessible at http://www.scirp.org/journal/OJPM/ Open Journal of Preventive Medicine Relationship between meeting the recommendations for physical activity and health-related quality of life in adult Chinese Internet users Jia-Meng Ma1,2*, Ai Shibata3, Isao Muraoka3 1Graduate School of Sport Sciences, Waseda University, Tokyo, Japan; *Corresponding Author: jiameng2011@gmail.com 2School of Physical Education, Sendai University, Sendai, Japan; 3Faculty of Sport Sciences, Waseda University, Tokyo, Japan; aishibata@aoni.waseda.jp, imuraoko@aoni.waseda.jp Received 10 September 2011; revised 17 October 2011; accepted 29 October 2011. ABSTRACT Background: The benefits of a recommended level of physical activity on physiological health indicators such as morbidity and mortality are well-accepted, but few researches has addressed whether or not the association between the re- commended level of physical activity and a health-related quality of life (HRQOL) exists in the Chinese adults. Purpose: The present study examined whether the recommended physical activity (PA) would be associated with HRQOL in the Chinese adults. Methods: Cross-sectional data were collected through an internet-based survey. Total of 1394 Chinese adults responded the International Physical Activity Question- naire-Chinese version examining whether indi- viduals met the recommended ACSM/AHA PA guideline. Demographic data were also obtained. HRQOL was assessed with the Medical Out- comes Survey Shor t Form-3 6 que sti onnair e (SF - 36). Multivariate analyses of covariance were utilized to examine differences in multidimen- sional scales of the SF-36. Results: In both gen- ders, the recommended group had significantly higher physical functioning, vitality, and mental health scores than the inactive group. Signifi- cant differences in role physical, general health, social functioning scores were only found among the recommended and insufficient male groups. Conclusion: Individuals w ho attained the recom- mended level of PA had better scores on some dimensions of HRQOL than those who did not. Keywords: Behavior Science; Health Promotion; HRQOL; Physical Activity 1. INTRODUCTION In its focus on healthy living, the World Health Or- ganization (WHO) places an emphasis not simply on preventing chronic diseases, but on preserving or im- proving quality of life (QOL) through the maintenance of a good state of physical independent function and mental health in daily life. Health-related quality of life (HRQOL) is defined as individual and community per- ceptions of physical and mental health, and is considered an important indicator in evaluating health status [1]. It is also a basic tool used to evaluate self-awareness of the physical and mental aspects of health status in daily life [2,3]. Sufficient physical activity is already known to reduce the risk of mortality and morbidity of chronic conditions such as coronary artery disease, diabetes mellitus, or hypertension [4-7]. It is also well-documented that as well as having such physical effects, physical activity also has mental effects. Previous studies have reported that people who are physically inactive in their daily lives have lower HRQOL than active people [8-10], and that the mental aspect of HRQOL in those who engage in regular exercise is superior to that of those with a sedentary lifestyle [11]. Based on these findings, health care providers and health promotion workers recom- mend engaging in regular physical activity as a means to maintain or improve HRQOL. In the United States (US), the American College of Sports Medicine/American Heart Association (ACSM/ AHA) published guidelines encouraging people to par- ticipation physical activity in order to prevent chronic diseases and maintain or improve health [12]. These guidelines recommend engaging in ≥150 minutes per week of at least physical activity of moderate-intensity, and the guidelines are currently in widespread use around the world [13,14]. In a study using the Medical Outcomes Study short form 36 (SF-36) to investigate the  J.-M. Ma et al. / Open Journal of Preventive Medicine 1 (2011) 94-100 Copyright © 2011 SciRes. Openly accessible at http://www.scirp.org/journal/OJPM/ 95 relationship between meeting the recommended amount of physical activity and HRQOL in French adults, those who met the recommended amount scored higher than those who did not in five of the eight SF-36 domain scales: physical functioning, vitality, general health, so- cial functioning, and mental health [12,15]. Thus, reports mainly from the US and Europe indicate that meeting the recommended amount of physical activity not only reduces the prevalence of chronic diseases or the mortal- ity rate from such diseases, but is also beneficial in in- creasing the HRQOL[10]. China also has the same emphasis on HRQOL as other countries. In the Healthy China 2020 Strategy an- nounced by the Ministry of Health of the People’s Re- public of China, the ultimate goal of health promotion is to increase HRQOL [16]. While there have been occa- sional studies in China of the relationship between HRQOL and physical activity focusing on specific groups such as people suffering a particular disease [17,18], there have been no studies investigating this relationship in Chinese adults across a wide range of age-groups [19]. There has been tremendous socioeconomic growth in China in recent, particularly in urban areas, and lifestyles are becoming westernized at an ever-increasing rate. According to a 2009 survey report of the development of the Internet in China, the number of Internet users in urban areas is increasing every year. Internet penetration in China is 31.8%, and 72.6% of Internet users are urban dwellers. Health problems among these urban Internet users are expected to increase as a result of increasing Westernization of their lifestyles and decreased physical activity. In order to build the measures to address physic- cal inactivity, it would be useful to survey physiccal activity and HRQOL among urban dwellers in China, who are at particularly high risk of physical inactivity. The present study examined that the relationship be- tween recommended amount of physical activity and HRQOL among adult Chinese Internet users. 2. METHODS 2.1. Participants The survey was carried out from December 2009 to January 2010. The participants were Chinese adults reg- istered as monitors (approx. 1,950,000 people as of No- vember, 2009) with a Japanese company specializing in overseas surveys. The goal was to have responses from 1,300 people, and after stratifying the participants to ensure equal numbers of each gender and age group (30 - 39 years, 40 - 49 years, 50 - 59 years), 39,000 adults from across China were randomly selected. The survey company sent an e-mail to each person requesting their cooperation with the questionnaire survey. The final num- ber of respondents was 1501, a response rate of 3.8%. By way of remuneration, the participants who responded to the questionnaire survey were awarded Internet points by the survey company according to the number of sur- vey items to which they responded. The present study was approved by the institutional review board by the Waseda University (approved number 2009-145, Dec. 7. 2009). 2.2. Measures 2.2.1. Physical Activity The Chinese version of the International Physical Ac- tivity Questionnaire–Short Version (IPAQ–SV) [20] was used to estimate the amount of physical activity. The IPAQ–SV was designed for the purpose of identifying the frequency and duration of walking, moderate and vigorous physical activity, and sedentary activity during the past week The reliability and validity of the Chinese version of the IPAQ–SV have already been investigated in a previous study, with a test-retest reliability coeffi- cient of r = 0.779 and validity shown by a good correla- tion of r = 0.598 with the daily energy expenditure cal- culated from the physical activity log [20]. This is a similar result to verification of the reliability and validity of the International Physical Activity Questionnaire car- ried out in 12 countries [21]. The total amount of physical activity (hours/week) was weekly minutes of walking, moderate-intensity and vigorous-intensity activity were calculated by multiply- ing the number of days/week by the frequency of physic- cal activity. On the basis of the ACSM/AHA guidelines, participants with a total weekly amount of physical ac- tivity (including walking and moderate-intensity and vigorous intensity physical activity) of 150 minutes or more were classified into the sufficient group, and those with a total of less than 150 min were classified into the insufficient group. 2.2.2. HRQOL The Chinese version of the SF-36 [22] was used to measure HRQOL. The validity and reliability of apply- ing this instrument to Chinese people have been con- firmed [23]. It has also been shown that the electronic version, used over media such as the Internet, has the same levels of validity and reliability as the paper self- reporting version [24]. The questionnaire has 36 items, organized into the following eight domain scales: physic- cal functioning (PF), role-physical (RP), bodily pain (BP), general health (GH), vitality (VT), social func- tioning (SF), role-emotional (RE), and mental health (MH). Each domain scale is calculated as a score from 0 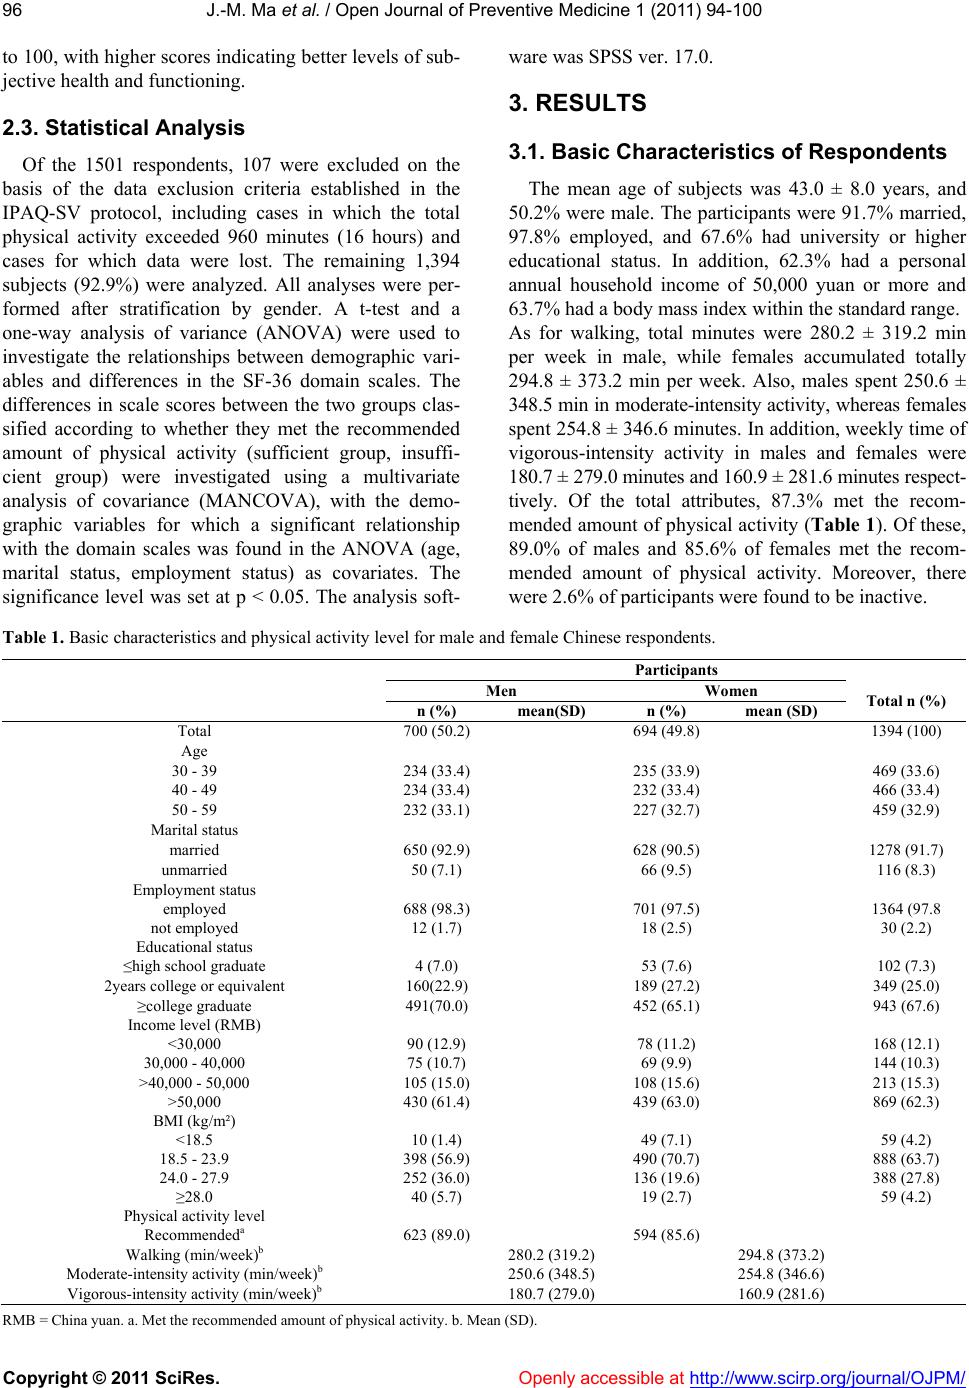 J.-M. Ma et al. / Open Journal of Preventive Medicine 1 (2011) 94-100 Copyright © 2011 SciRes. http://www.scirp.org/journal/OJPM/Openly accessible at 96 to 100, with higher scores indicating better levels of sub- jective health and functioning. 2.3. Statistical Analysis Of the 1501 respondents, 107 were excluded on the basis of the data exclusion criteria established in the IPAQ-SV protocol, including cases in which the total physical activity exceeded 960 minutes (16 hours) and cases for which data were lost. The remaining 1,394 subjects (92.9%) were analyzed. All analyses were per- formed after stratification by gender. A t-test and a one-way analysis of variance (ANOVA) were used to investigate the relationships between demographic vari- ables and differences in the SF-36 domain scales. The differences in scale scores between the two groups clas- sified according to whether they met the recommended amount of physical activity (sufficient group, insuffi- cient group) were investigated using a multivariate analysis of covariance (MANCOVA), with the demo- graphic variables for which a significant relationship with the domain scales was found in the ANOVA (age, marital status, employment status) as covariates. The significance level was set at p < 0.05. The analysis soft- ware was SPSS ver. 17.0. 3. RESULTS 3.1. Basic Characteristics of Respondents The mean age of subjects was 43.0 ± 8.0 years, and 50.2% were male. The participants were 91.7% married, 97.8% employed, and 67.6% had university or higher educational status. In addition, 62.3% had a personal annual household income of 50,000 yuan or more and 63.7% had a body mass index within the standard range. As for walking, total minutes were 280.2 ± 319.2 min per week in male, while females accumulated totally 294.8 ± 373.2 min per week. Also, males spent 250.6 ± 348.5 min in moderate-intensity activity, whereas females spent 254.8 ± 346.6 minutes. In addition, weekly time of vigorous-intensity activity in males and females were 180.7 ± 279.0 minutes and 160.9 ± 281.6 minutes respect- tively. Of the total attributes, 87.3% met the recom- mended amount of physical activity (Table 1). Of these, 89.0% of males and 85.6% of females met the recom- mended amount of physical activity. Moreover, there were 2.6% of participants were found to be inactive. Table 1. Basic characteristics and physical activity level for male and female Chinese respondents. Participants Men Women n (%) mean(SD ) n (%) mean (SD) Total n (%) Total 700 (50.2) 694 (49.8) 1394 (100) Age 30 - 39 234 (33.4) 235 (33.9) 469 (33.6) 40 - 49 234 (33.4) 232 (33.4) 466 (33.4) 50 - 59 232 (33.1) 227 (32.7) 459 (32.9) Marital status married 650 (92.9) 628 (90.5) 1278 (91.7) unmarried 50 (7.1) 66 (9.5) 116 (8.3) Employment status employed 688 (98.3) 701 (97.5) 1364 (97.8 not employed 12 (1.7) 18 (2.5) 30 (2.2) Educational status ≤high school graduate 4 (7.0) 53 (7.6) 102 (7.3) 2years college or equivalent 160(22.9) 189 (27.2) 349 (25.0) ≥college graduate 491(70.0) 452 (65.1) 943 (67.6) Income level (RMB) <30,000 90 (12.9) 78 (11.2) 168 (12.1) 30,000 - 40,000 75 (10.7) 69 (9.9) 144 (10.3) >40,000 - 50,000 105 (15.0) 108 (15.6) 213 (15.3) >50,000 430 (61.4) 439 (63.0) 869 (62.3) BMI (kg/m²) <18.5 10 (1.4) 49 (7.1) 59 (4.2) 18.5 - 23.9 398 (56.9) 490 (70.7) 888 (63.7) 24.0 - 27.9 252 (36.0) 136 (19.6) 388 (27.8) ≥28.0 40 (5.7) 19 (2.7) 59 (4.2) Physical activity level Recommendeda 623 (89.0) 594 (85.6) Walking (min/week)b 280.2 (319.2) 294.8 (373.2) Moderate-intensity activity (min/week)b 250.6 (348.5) 254.8 (346.6) Vigorous-intensity activity (min/week)b 180.7 (279.0) 160.9 (281.6) R MB = China yuan. a. Met the recommended amount of physical activity. b. Mean (SD). 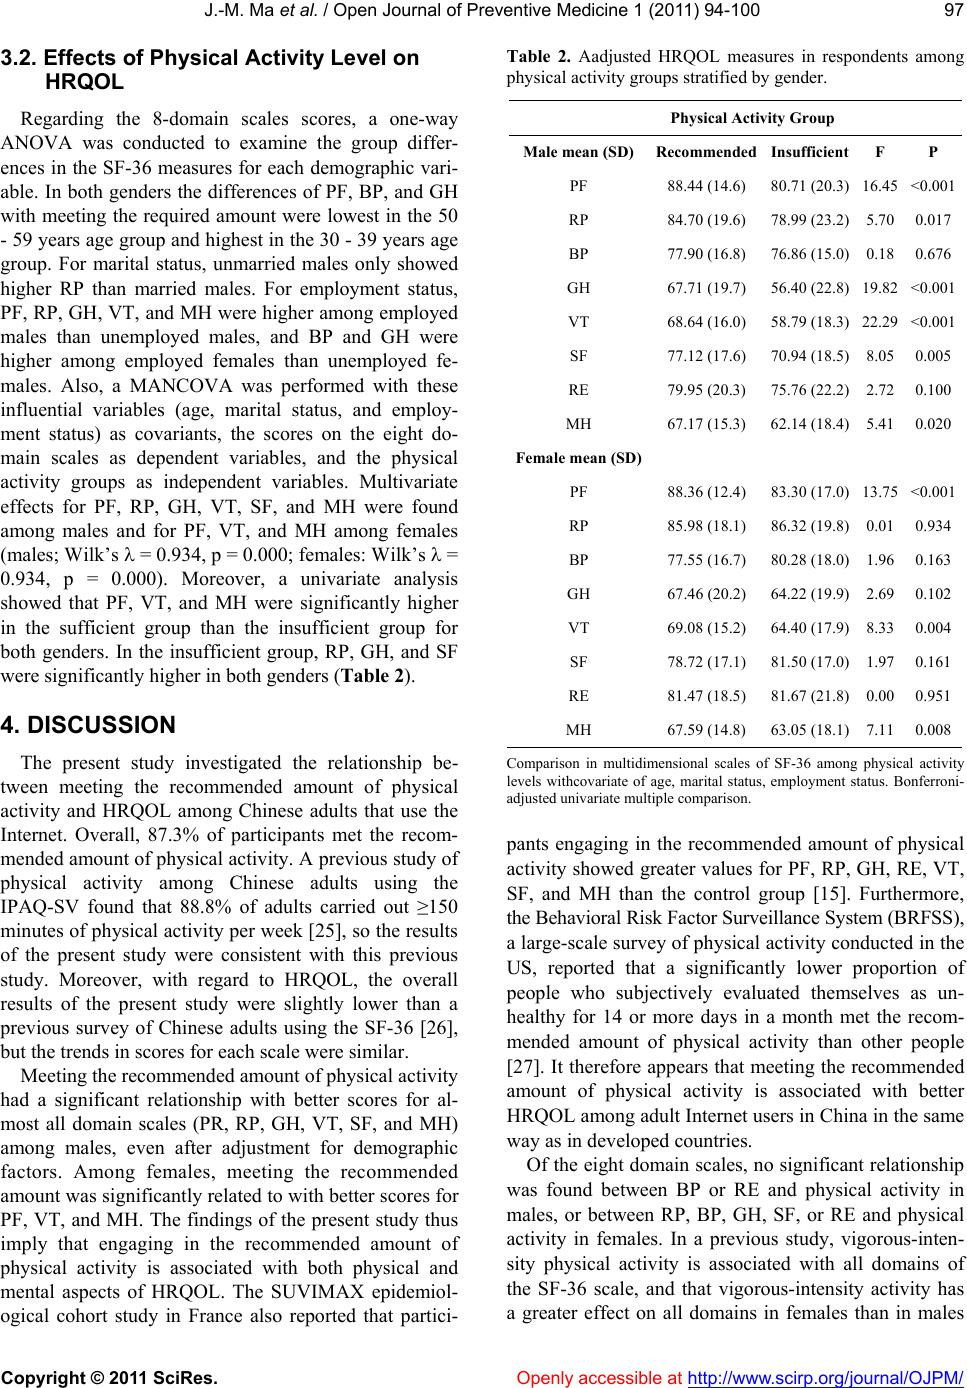 J.-M. Ma et al. / Open Journal of Preventive Medicine 1 (2011) 94-100 Copyright © 2011 SciRes. Openly accessible at http://www.scirp.org/journal/OJPM/ 97 3.2. Effects of Physical Activity Level on HRQOL Regarding the 8-domain scales scores, a one-way ANOVA was conducted to examine the group differ- ences in the SF-36 measures for each demographic vari- able. In both genders the differences of PF, BP, and GH with meeting the required amount were lowest in the 50 - 59 years age group and highest in the 30 - 39 years age group. For marital status, unmarried males only showed higher RP than married males. For employment status, PF, RP, GH, VT, and MH were higher among employed males than unemployed males, and BP and GH were higher among employed females than unemployed fe- males. Also, a MANCOVA was performed with these influential variables (age, marital status, and employ- ment status) as covariants, the scores on the eight do- main scales as dependent variables, and the physical activity groups as independent variables. Multivariate effects for PF, RP, GH, VT, SF, and MH were found among males and for PF, VT, and MH among females (males; Wilk’s = 0.934, p = 0.000; females: Wilk’s = 0.934, p = 0.000). Moreover, a univariate analysis showed that PF, VT, and MH were significantly higher in the sufficient group than the insufficient group for both genders. In the insufficient group, RP, GH, and SF were significantly higher in both genders (Table 2 ). 4. DISCUSSION The present study investigated the relationship be- tween meeting the recommended amount of physical activity and HRQOL among Chinese adults that use the Internet. Overall, 87.3% of participants met the recom- mended amount of physical activity. A previous study of physical activity among Chinese adults using the IPAQ-SV found that 88.8% of adults carried out ≥150 minutes of physical activity per week [25], so the results of the present study were consistent with this previous study. Moreover, with regard to HRQOL, the overall results of the present study were slightly lower than a previous survey of Chinese adults using the SF-36 [26], but the trends in scores for each scale were similar. Meeting the recommended amount of physical activity had a significant relationship with better scores for al- most all domain scales (PR, RP, GH, VT, SF, and MH) among males, even after adjustment for demographic factors. Among females, meeting the recommended amount was significantly related to with better scores for PF, VT, and MH. The findings of the present study thus imply that engaging in the recommended amount of physical activity is associated with both physical and mental aspects of HRQOL. The SUVIMAX epidemiol- ogical cohort study in France also reported that partici- Table 2. Aadjusted HRQOL measures in respondents among physical activity groups stratified by gender. Physical Activity Group Male mean (SD)Recommended Insufficient F P PF 88.44 (14.6) 80.71 (20.3) 16.45<0.001 RP 84.70 (19.6) 78.99 (23.2) 5.700.017 BP 77.90 (16.8) 76.86 (15.0) 0.180.676 GH 67.71 (19.7) 56.40 (22.8) 19.82<0.001 VT 68.64 (16.0) 58.79 (18.3) 22.29<0.001 SF 77.12 (17.6) 70.94 (18.5) 8.050.005 RE 79.95 (20.3) 75.76 (22.2) 2.720.100 MH 67.17 (15.3) 62.14 (18.4) 5.410.020 Female mean (SD ) PF 88.36 (12.4) 83.30 (17.0) 13.75<0.001 RP 85.98 (18.1) 86.32 (19.8) 0.010.934 BP 77.55 (16.7) 80.28 (18.0) 1.960.163 GH 67.46 (20.2) 64.22 (19.9) 2.690.102 VT 69.08 (15.2) 64.40 (17.9) 8.330.004 SF 78.72 (17.1) 81.50 (17.0) 1.970.161 RE 81.47 (18.5) 81.67 (21.8) 0.000.951 MH 67.59 (14.8) 63.05 (18.1) 7.110.008 Comparison in multidimensional scales of SF-36 among physical activity levels withcovariate of age, marital status, employment status. Bonferroni- adjusted univariate multiple comparison. pants engaging in the recommended amount of physical activity showed greater values for PF, RP, GH, RE, VT, SF, and MH than the control group [15]. Furthermore, the Behavioral Risk Factor Surveillance System (BRFSS), a large-scale survey of physical activity conducted in the US, reported that a significantly lower proportion of people who subjectively evaluated themselves as un- healthy for 14 or more days in a month met the recom- mended amount of physical activity than other people [27]. It therefore appears that meeting the recommended amount of physical activity is associated with better HRQOL among adult Internet users in China in the same way as in developed countries. Of the eight domain scales, no significant relationship was found between BP or RE and physical activity in males, or between RP, BP, GH, SF, or RE and physical activity in females. In a previous study, vigorous-inten- sity physical activity is associated with all domains of the SF-36 scale, and that vigorous-intensity activity has a greater effect on all domains in females than in males  J.-M. Ma et al. / Open Journal of Preventive Medicine 1 (2011) 94-100 Copyright © 2011 SciRes. Openly accessible at http://www.scirp.org/journal/OJPM/ 98 [28]. Another previous study also found that vigor- ous-intensity leisure-time physical activity was more strongly associated with all of the domains than moder- ate-intensity physical activity [15]. With the present study, it is not possible to make direct mention to any amount-response relationship between the intensity or amount of physical activity and HRQOL, as the survey examined the relationship between HRQOL and engage- ing in ≥150 minutes per week of at least physical activity of moderate-intensity. Nonetheless, in light of the pre- vious studies, the present results suggest the possibility that higher intensity or greater amount of physical active- ity are required in order to have an effect on the domains in which no relationship with meeting the recommended amount was found, and that carrying out the recom- mended amount of physical activity of 150 minutes per week of physical activity of moderate-intensity or vig- orous-intensity may not be sufficient. Furthermore, while a significant relationship between physical activity and the SF domain was found among males, no relationship was found among females. In a previous study, a longitudinal study found that five years of continual leisure-time activity had a favorable effect in raising SF in females [29]. The present study was cross-sectional, and, moreover, physical activity habits and period of duration were not surveyed, but it seems that engaging in a constant amount and duration of physical activity has an effect on SF in females. There is therefore a need to investigate this point using a longitu- dinal study. Moreover, in the present study, female found a weaker relationship between the physical aspects of HRQOL in particular and meeting the recommended amount of physical activity. A previous study that examined the relationship between long-term physical activity and HRQOL reported that the more intense the physical ac- tivity, the stronger the relationship between physical activity and the physical aspects of HRQOL [30]. This suggests that engaging in high-intensity activity has an effect on the physical aspects of HRQOL. There is also a trend for males to favor high-intensity activity, while females generally engaging in moderate-intensity physic- cal activity [31]. Consequently, in the present study, it is likely that, among those engaging in 150 min or more physical activity per week, the males were engaging in high-intensity activity, while more females were engage- ing in moderate-intensity activity. It would probably be desirable to recommend that female engaging in high- intensity activity in order to achieve more effective im- provement of the physical aspects. In a previous study, engaging in leisure-time physical activity of moderate or greater intensity for 150 min or more per week showed a strong relationship to the HRQOL domain scales (except BP) [15]. In the present study, however, evaluation of the relationship to HRQOL of physical activity of moderate or greater in- tensity that includes activities of daily life observed sev- eral domain scales for which no relationship was found. From this, it may be conjectured that leisure-time physic- cal activity has a greater relation to HRQOL than the general activity of daily life. Moreover, as leisure-time physical activity has a positive effect on overall health, while physical activity from commuting or work has a negative effect on subjective well-being, it has been suggested that physical activity engaging in a passive condition has a great effect on psychological factors [32]. In China, one-third of all people commuting to work go by bicycle or on foot. One would therefore expect that the participants of the present study included many peo- ple met physical activity recommendation by such active commuting. Therefore, the finding of the present study that there was no relationship between physical activity and the psychological domains RE and SF was probably due at least in part to differences in the type of exercise being engaging in by participants. There are a number of limitations to the present study. First, the cross-sectional design of the study makes it impossible to mention a causal relationship between engaging in the recommended amount of physical active- ity and HRQOL. Second, there is the presence of sam- pling bias. Subjects were selected after stratifying by gender and age group, but it has been pointed out that sampling error can occur when subjects are selected by random sampling from monitors registered with a survey company [33]. Comparing the characteristics of the sub- jects of the present survey with the adult population of China as whole using information released by the Na- tional Bureau of Statistics of China in 2008, the survey participants were better educated and had higher income. Adult Chinese people who use the Internet are those with higher socioeconomic status, so there is probably a bias toward people with the same attributes in the moni- tors of the survey company. According to a survey by the China Internet Network Information Center (CNNIC), at least 70% of Internet users are urban dwellers, so that the subjects of the present study were probably a largely urban group. These points mean that caution must be exercised in any attempt to generalize the results of the present survey to the adult population of China as a whole. Furthermore, with regard to the amounts of physical activity of moderate or greater intensity and of walking assumed in the IPAQ, it is impossible to avoid bias due to inaccurate assumptions or recollections on the part of the subjects because of the self-reporting na- ture of the study. In a previous study of physical activity evaluation methods with Chinese subjects [34], the IPAQ  J.-M. Ma et al. / Open Journal of Preventive Medicine 1 (2011) 94-100 Copyright © 2011 SciRes. Openly accessible at http://www.scirp.org/journal/OJPM/ 99 gave a higher evaluation of physical activity amount than a heart rate monitor, an accelerometer, and a ques- tionnaire relating to a daily physical activity log. There- fore, the IPAQ may overestimate the amount of physical activity. 5. CONCLUSIONS Since a relationship was found between meeting the amount of physical activity recommended in the ACSM/ AHA guidelines and HRQOL, it is likely that engaging in the recommended amount of physical activity has an important effect on health. However, as discussed above, further studies should be done to determine more accu- rately the association between HRQOL and the recom- mended physical activity level using a representative sample and a larger sample size. Participants should not be only restricted to the internet user sample. HRQOL may possibly be related to other characteristics of the Chinese population. Moreover, the association between HRQOL with specific domains of physical activity (such as leisure-time household, occupational and transport) should be examined further. Furthermore, effective sup- port strategies are needed for promoting physical activity with the goal of improving HRQOL. 6. ACKNOWLEDGEMENTS This work was supported by a Global COE program “Sport Sciences for the Promotion of Active Life” from the Japan Ministry of Educa- tion, Culture, Sports, Science, and Technology. REFERENCES [1] U.S. Department of Health and Human Services (2000) Measuring healthy days, population assessment of Health- related Quality of Life. [2] Mishoe, S.C. and Maclean, J.R. (2001) Assessment of health-related quality of life. Respiratory Care, 46, 1236- 1257. [3] Ware, J.E. Jr. and Sherbourne, C.D. (1992) The MOS 36- item short-form health survey (SF-36) I. Conceptual frame- work and item selection. Medical Care, 30, 473-483. doi:10.1097/00005650-199206000-00002 [4] Sundquist, K., Qvist, J., Johansson, S.E. and Sundquist, J. (2005) The long-term effect of physical activity on inci- dence of coronary heart disease: A 12-year follow-up study. Preventive Medicine, 41, 219-225. doi:10.1016/j.ypmed.2004.09.043 [5] Warburton, D.E.R., Nicol, C.W. and Bredin S.S.D. (2006) Health benefits of physical activity: The evidence. Cana- dian Medical Association journal, 174, 801-809. doi:10.1503/cmaj.051351 [6] Manson, J.E., Hu, F.B., Rich-Edwards, J.W., Colditz, G.A., Stampfer, M.J. and Willett, W.C. (1999) A prospec- tive study of walking as compared with vigorous exercise in the prevention of coronary heart disease in women. New England Journal of Medicine. 341, 650-658. doi:10.1056/NEJM199908263410904 [7] Bjorntorp, P. (1992) Abdominal Obesity and the Meta- bolic Syndrome. Annals of Medicine, 24, 465-468. doi:10.3109/07853899209166997 [8] Tentori, F., Elder, S.J., Thumma, J., Pisoni, R.L., Bom- mer, J., Fissell, R.B., et al. (2010) Physical exercise a- mong participants in the Dialysis Outcomes and Practice Patterns Study (DOPPS): Correlates and associated out- comes. Nephrology Dialysis Transplantation, 25, 3050- 3062. doi:10.1093/ndt/gfq138 [9] U. S. Department of Health and Human Services (1996) Centers for Disease Control and Prevention, National Center for Chronic Disease Prevention and Health Pro- motion. [10] Harrison, R. A., McElduff, P. and Edwards, R. (2006) Plan- ning to win: Health and lifestyles associated with physi- cal activity amongst 15,423 adults. Public Health, 120, 206-212. doi:10.1016/j.puhe.2005.08.021 [11] Lee, C. and Russell, A. (2003) Effects of physical activ- ity on emotional well-being among older Australian wo- men cross-sectional and longitudinal analyses. Journal of Psychosomatic Rese a rch, 54, 155-160. doi:10.1016/S0022-3999(02)00414-2 [12] Haskell, W. L., Lee, I. M., Pate, R. R., Powell, K. E., Blair, S. N., Franklin, B. A., et al. (2007) Updated rec- ommendation for adults from the American College of Sports Medicine and the American Heart Association. Circulation, 11 6, 1081-1093. doi:10.1161/CIRCULATIONAHA.107.185649 [13] Meseguer, C.M., Galán, I., Herruzo, R., Zorrilla, B. and Rodríguez-Artalejo, F. (2009) Leisure-time physical ac- tivity in a southern European mediterranean country: ad- herence to recommendations and determining factors. Revista espanola de cardiologia, 62, 1125-1133. doi:10.1016/S0300-8932(09)72381-4 [14] Stevinson, C., Capstick, V., Schepansky, A., Tonkin, K., Vallance, J.K., Ladha, A.B. et al . (2009) Physical activity preferences of ovarian cancer survivors. Psychooncology, 18, 422-428. doi:10.1002/pon.1396 [15] Vuillemin, A., Boini, S., Bertrais, S., Tessier, S., Oppert, J.M., Hercberg, S., et al. (2005) Leisure time physical ac- tivity and health-related quality of life. Preventive Medi- cine, 41, 562-569. doi:10.1016/j.ypmed.2005.01.006 [16] Huang, Y.X., Zeng, Y.X. and Kuang, L. (2008) To esti- mate the engaging in effect and policy choice of the health care financing blue print on “Health China by the Year 2020”.Chinese Health Economics, 5, 9-12. [17] Qian, Y., Zhang, J., Lin, Y., Dong, M., Xu, M., Wu, L., et al. (2009) A tailored target intervention on influence fac- tors of quality of life in Chinese patients with hyperten- sion. Clinical and Experimental Hypertension, 31, 71-82. doi:10.1080/10641960802409804 [18] Chan, C., Tang, D. and Jones, A. (2008) Clinical out- comes of a Cardiac Rehabilitation and Maintenance Pro- gram for Chinese patients with congestive heart failure. Disability and rehabilitation, 30, 1245-1253. doi:10.1080/09638280701580226 [19] Schooling, C.M., Lam, T.H., Li, Z.B., Ho, S.Y., Chan, W.M, Ho, K.S., et al.(2006) Obesity, physical activity, and mortality in a prospective Chinese elderly cohort. Archives of Internal Medicine, 166, 1498-1504.  J.-M. Ma et al. / Open Journal of Preventive Medicine 1 (2011) 94-100 Copyright © 2011 SciRes. http://www.scirp.org/journal/OJPM/Openly accessible at 100 doi:10.1001/archinte.166.14.1498 [20] Qu, N.G. and Li, K.J. (2004) Study on the reliability and validity of international physical activity questionnaire (Chinese version IPAQ).Chinese Journal of Epidemiol- ogy, 25, 265-268. [21] Craig, C.L., Marshall, A.L., Sjöström, M., Bauman, A.E., Booth, M.L., Ainsworth, B.E., et al. (2003) Interna- tional physical activity questionnaire. 12-country reli- ability and validity. Medical Science Sports Exercise, 35, 1381-1395. [22] Li., L., Wang. H. and Shen, Y. (2003) Chinese SF-36 Health Survey: Translation, cultural adaptation, valida- tion, and normalization. Journal of Epidemiology and C o m - munity Health, 57, 259-263. doi:10.1136/jech.57.4.259 [23] Ren, X.S., Amick, B., Zhou, L. and Gandek, B. (1998) Translation and psychometric evaluation of a Chinese version of the SF-36 Health Survey in the United States. Journal of Clinical Epidemiology, 51, 1129-1138. doi:10.1016/S0895-4356(98)00104-8 [24] Chen, T.H., Li, L., Sigle, J.M., Du, Y.P., Wang, H.M. and Lei, J. (2007) Crossover randomized controlled trial of the electronic version of the Chinese SF-36. Journal of Zhejiang University Science, 8, 604-608. doi:10.1631/jzus.2007.B0604 [25] Li, Y., Li, W.T., Fan, B.H. and Fu, H. (2004) Physical ac- tivity prevalence study in Shanghai city. Chinese Journal of Industrial Hygiene and Occupational Diseases, 22, 458-460. [26] Wang, R., Wu, C., Zhao, Y., Yan, X., Ma, X., Wu, M., et al. (2008) Health related quality of life measured by SF-36: A population-based study in Shanghai, China. BMC Public Health, 8, 292. doi:10.1186/1471-2458-8-292 [27] Brown, D.W., Balluz, L.S., Heath, G.W., Moriarty, D.G., Ford, E.S., Giles, W.H. and Mokdad, A.H.(2003) Asso- ciations between recommended levels of physical activ- ity and health-related quality of life. Findings from the 2001 Behavioral Risk Factor Surveillance System (BRFSS) survey. Preventive medicine, 37, 520-528. doi:10.1016/S0091-7435(03)00179-8 [28] Morimoto, T., Oguma, Y., Yamazaki, S., Sokejima, S., Nakayama, T. and Fukuhara, S. (2006) Gender differ- ences in effects of physical activity on quality of life and resource utilization. Quality of Life Research, 15, 537- 546. doi:10.1007/s11136-005-3033-2 [29] Wendel-Vos, G.C., Schuit, A.J., Tijhuis, M.A. and Krom- hout, D. (2004) Leisure time physical activity and health- related quality of life: Cross-sectional and longitudinal associations. Quality of Life Research, 13, 667-677. doi:10.1023/B:QURE.0000021313.51397.33 [30] Wolin, K.Y., Glynn, R.J., Colditz, G.A., Lee, I.M. and Kawachi, I. (2007) Long-term physical activity patterns and health-related quality of life in U.S. women. Ameri- can Journal of Preventive Medicine, 32, 490-499. doi:10.1016/j.amepre.2007.02.014 [31] Macera, C.A., Ham, S.A., Yore, M.M, Jones, D.A., Ainsworth, B.E., Kimsey, C.D., et al. (2005) Prevalence of physical activity in the United States: Behavioral risk factor surveillance system, 2001. Preventing Chronic Disease, 2, 1-10. [32] Karim, A.-O. and Alfred, R. (2008) Relation of leisure time, occupational, domestic and commuting physical activity to health indicators in Europe. Preventive Medi- cine, 47, 319-323. doi:10.1016/j.ypmed.2008.03.012 [33] Rhodes, S.D., Bowie, D.A. and Hergenrather, K.C. (2003) Collecting behavioral data using the world wide web: considerations for researchers. Journal of Epidemiology & Community Health, 57, 68-73. doi:10.1136/jech.57.1.68 [34] Macfarlane, D.J., Lee, C.C., Ho, E.Y., Chan, K.L. and Chan, D. (2006) Convergent validity of six methods to assess physical activity in daily life. The Journal of ap- plied psychology, 101, 1328-1334.
|