 Journal of Behavioral and Brain Science, 2011, 1, 234-241 doi:10.4236/jbbs.2011.14030 Published Online November 2011 (http://www.SciRP.org/journal/jbbs) Copyright © 2011 SciRes. JBBS Motor and Nonmotor Components of Event-Brain Potential in Preparation of Motor Response Yasunori Kotani1, Yoshimi Ohgami1, Jun-ichiro Arai2, Shigeru Kiryu3, Yusuke Inoue4 1Department of Human Syst em Science , Department of Social Engi neering, Tokyo Instit ute of Technology , Tokyo, Japan 2Technology Innovation Center Development Department, Daikin Industries, Ltd., Tokyo, Japan 3The Institute of Medical Science, The University of Tokyo, Tokyo, Japan 4Department of Diagnostic Radiology, Kitasato University School of Medicine, Kanagawa, Japan E-mail: kotani@hum.titech.ac.jp, ohgami.y.aa@m. titech.ac.jp Received August 5, 2011; revised October 13, 2011; acce pt ed October 31, 2011 Abstract Stimulus-preceding negativity (SPN), readiness potential (RP), and contingent negative variation (CNV) were recorded to verify the hypothesis that the CNV late wave is the sum of the RP and the SPN. SPN and RP were elicited using a time-estimation task, and the CNV was recorded using a warned reaction-time task. A “virtual CNV” was calculated by superimposing the SPN on the RP. Then the real and virtual CNVs were compared to evaluate the hypothesis. Although an amplitude difference between the real and virtual CNV late waves was observed at the frontal site, the amplitudes at the central and parietal sites were not different between the two. These results suggest that the CNV late wave and the SPN might have a common underly- ing physiological mechanism in the parietal area, and that these potentials might be related to attentional systems. Keywords: Contingent Negative Variation, Stimulus-Preceding Negativity 1. Introduction Contingent negative variation (CNV) is an even-related brain potential (ERP) that relates to motor preparation and anticipatory behavior [1]; it can be elicited in a warned re- action-time paradigm. In such a task, a warning stimulus is presented preceding a response stimulus, and a partici- pant has to make a motor response as quickly as possible after the response stimulus appears. A slow negative shift can be observed between the warning stimulus and the response stimulus, and this negative shift is termed the CNV [1]. The CNV has at least two compon en ts : an ea r ly wave and a late wave [2]. Although the early wave seems to be related to the salience and signal value of the warning stimulus [3], the functional significance of the late wave is more complicated. After activations in the primary motor cortex, anterior cingulate cortex, and sup - plementary motor area (SMA) were confirmed in both a magnetic field encephalography (MEG) study [4] and a functional magnetic resonance imaging (fMRI) study [5], it became evident that a motor preparation process is involved when a motor response is required after a re- sponse stimulus. However, how nonmotor processes in- cluding anticipation contribute to the late wave is un- clear. In order to clarify this issue, Damen and Brunia [6] developed a time estimation task to temporally separate nonmotor processes from motor preparation. In their task, a participant has to press a button when she or he thinks an instructed time, for example 6 seconds, has elapsed. A few seconds after the button press, a feedback stimulus conveying information about the correctness of the par- ticipant’s timing is presented. They found two different slow potentials in this task [6]. One is the readiness po- tential [7] preceding the bu tton press, and the other is the stimulus-preceding negativity (SPN) before the feed- back stimulus. The amplitude of the RP was largest at the precentral and postcentral area contralateral to the respond- ing hand, whereas the SPN showed a right hemisphere preponderance regardless of which hand was used for re- sponding. Based on these distributions, they concluded that the RP reflects motor preparation and the SPN re- flects stimulus anticipation. After conducting several studies to confirm the existence of the SPN, they con- cluded that the CNV late wave is the sum of the RP and the SPN [6,8,9]. After this theory became better known, 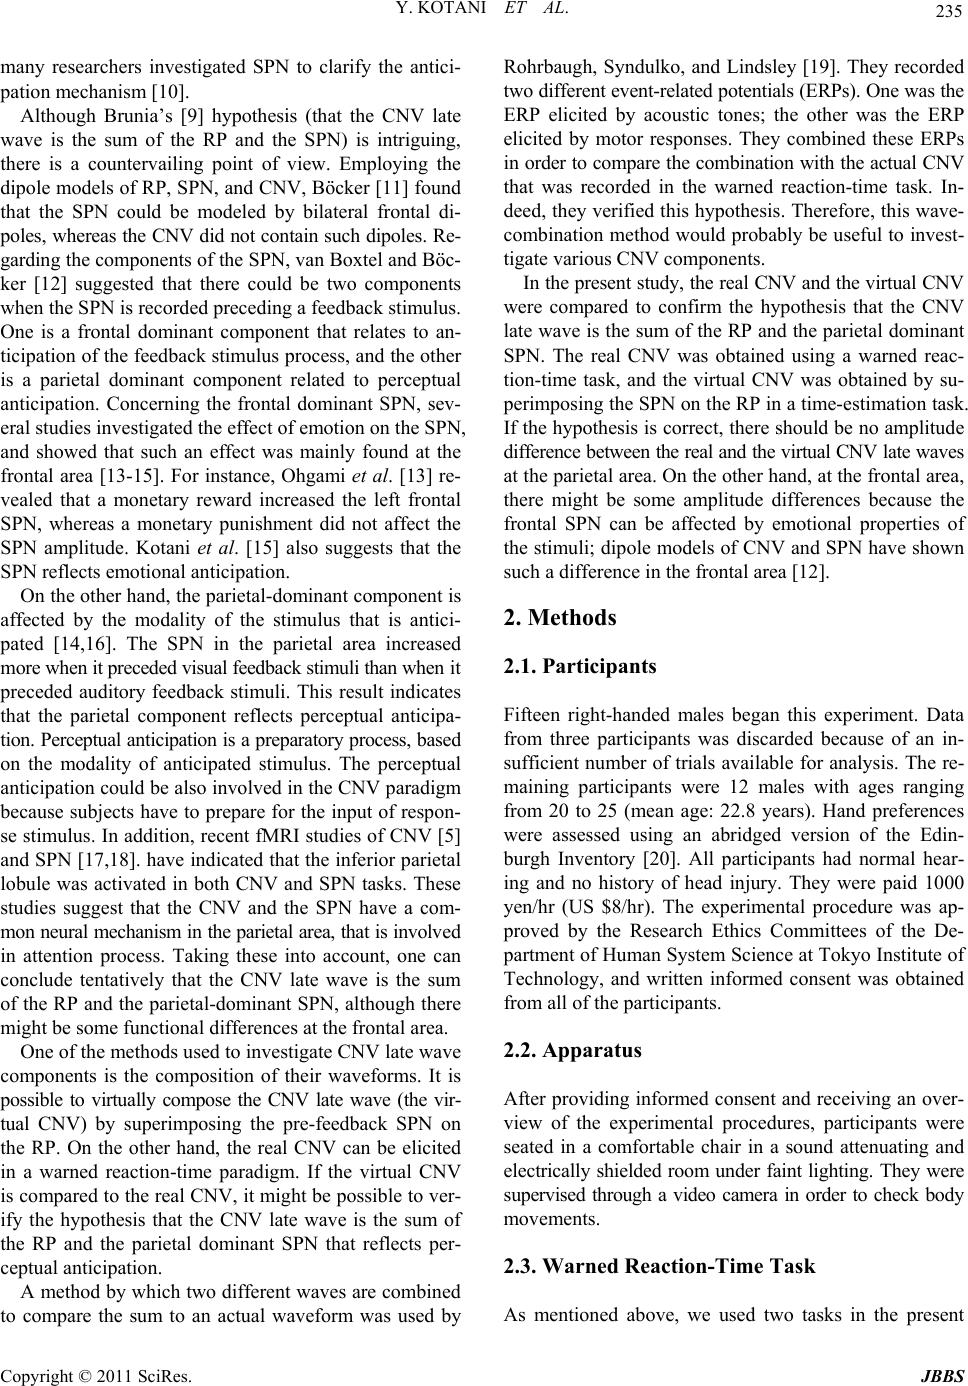 235 Y. KOTANI ET AL. many researchers investigated SPN to clarify the antici- pation mechanism [10]. Although Brunia’s [9] hypothesis (that the CNV late wave is the sum of the RP and the SPN) is intriguing, there is a countervailing point of view. Employing the dipole models of RP, SPN, and CNV, Böcker [11] found that the SPN could be modeled by bilateral frontal di- poles, whereas the CNV did not contain such dipoles. Re- garding the components of the SPN, van Boxtel and Böc- ker [12] suggested that there could be two components when the SPN is recorded preceding a feedback stimulus. One is a frontal dominant component that relates to an- ticipation of the feedback stimulus process, and the other is a parietal dominant component related to perceptual anticipation. Concerning the frontal dominant SPN, sev- eral studies investigated the effect of emotion on the SPN, and showed that such an effect was mainly found at the frontal area [13-15]. For instance, Ohgami et al. [13] re- vealed that a monetary reward increased the left frontal SPN, whereas a monetary punishment did not affect the SPN amplitude. Kotani et al. [15] also suggests that the SPN reflects emotional anticipation. On the other hand, the parietal-dominant component is affected by the modality of the stimulus that is antici- pated [14,16]. The SPN in the parietal area increased mor e wh en it prec ed ed visua l feedb ack s timu li than wh en it preceded auditory feedback stimuli. This result indicates that the parietal component reflects perceptual anticipa- tion. Perceptual anticipation is a preparatory process, based on the modality of anticipated stimulus. The perceptual anticipation could be also involved in the CNV paradigm because subjects have to prepare for the input of respon- se stimulus. In addition, recent fMRI studies of CNV [5] and SPN [17,18]. have indicated that the inferior parietal lobule was activated in both CNV and SPN tasks. These studies suggest that the CNV and the SPN have a com- mon neural mechanism in the parietal area, that is involve d in attention process. Taking these into account, one can conclude tentatively that the CNV late wave is the sum of the RP and the parietal-dominant SPN, although there might be some functional differences at the frontal area. One of the methods used to investigate CNV late wav e components is the composition of their waveforms. It is possible to virtually compose the CNV late wave (the vir- tual CNV) by superimposing the pre-feedback SPN on the RP. On the other hand, the real CNV can be elicited in a warned reaction-time paradigm. If the virtual CNV is compared to the real CNV, it might be possible to ver- ify the hypothesis that the CNV late wave is the sum of the RP and the parietal dominant SPN that reflects per- ceptual anticipation . A method by which two different waves are combined to compare the sum to an actual waveform was used by Rohrbaugh, Syndulko, and Lindsley [19]. They recorded two different event-related potentials (ERPs). One was the ERP elicited by acoustic tones; the other was the ERP elicited by motor responses. They combined these ERPs in order to compare the co mbination with the actua l CNV that was recorded in the warned reaction-time task. In- deed, they verified this hypothesis. Therefore, this wave- combination method would probably be useful to invest- tigate various CNV components. In the present study, the real CNV and the virtual CNV were compared to confirm the hypothesis that the CNV late wave is the sum of the RP and the parietal dominant SPN. The real CNV was obtained using a warned reac- tion-time task, and the virtual CNV was obtained by su- perimposing the SPN on the RP in a time-estimation task. If the hypothesis is correct, there should be no amplitude difference between the real and the virtual CNV late waves at the parietal area. On the other hand, at the frontal area, there might be some amplitude differences because the frontal SPN can be affected by emotional properties of the stimuli; dipo le models of CNV and SPN have sh own such a difference in the frontal area [12]. 2. Methods 2.1. Participants Fifteen right-handed males began this experiment. Data from three participants was discarded because of an in- sufficient number of trials available for analysis. The re- maining participants were 12 males with ages ranging from 20 to 25 (mean age: 22.8 years). Hand preferences were assessed using an abridged version of the Edin- burgh Inventory [20]. All participants had normal hear- ing and no history of head injury. They were paid 1000 yen/hr (US $8/hr). The experimental procedure was ap- proved by the Research Ethics Committees of the De- partment of Human System Science at Tokyo Institu te of Technology, and written informed consent was obtained from all of the participants. 2.2. Apparatus After providing informed consent and receiving an over- view of the experimental procedures, participants were seated in a comfortable chair in a sound attenuating and electrically shielded room under faint lighting. They were supervised through a video camera in order to check body movements. 2.3. Warned Reaction-Time Task As mentioned above, we used two tasks in the present Copyright © 2011 SciRes. JBBS 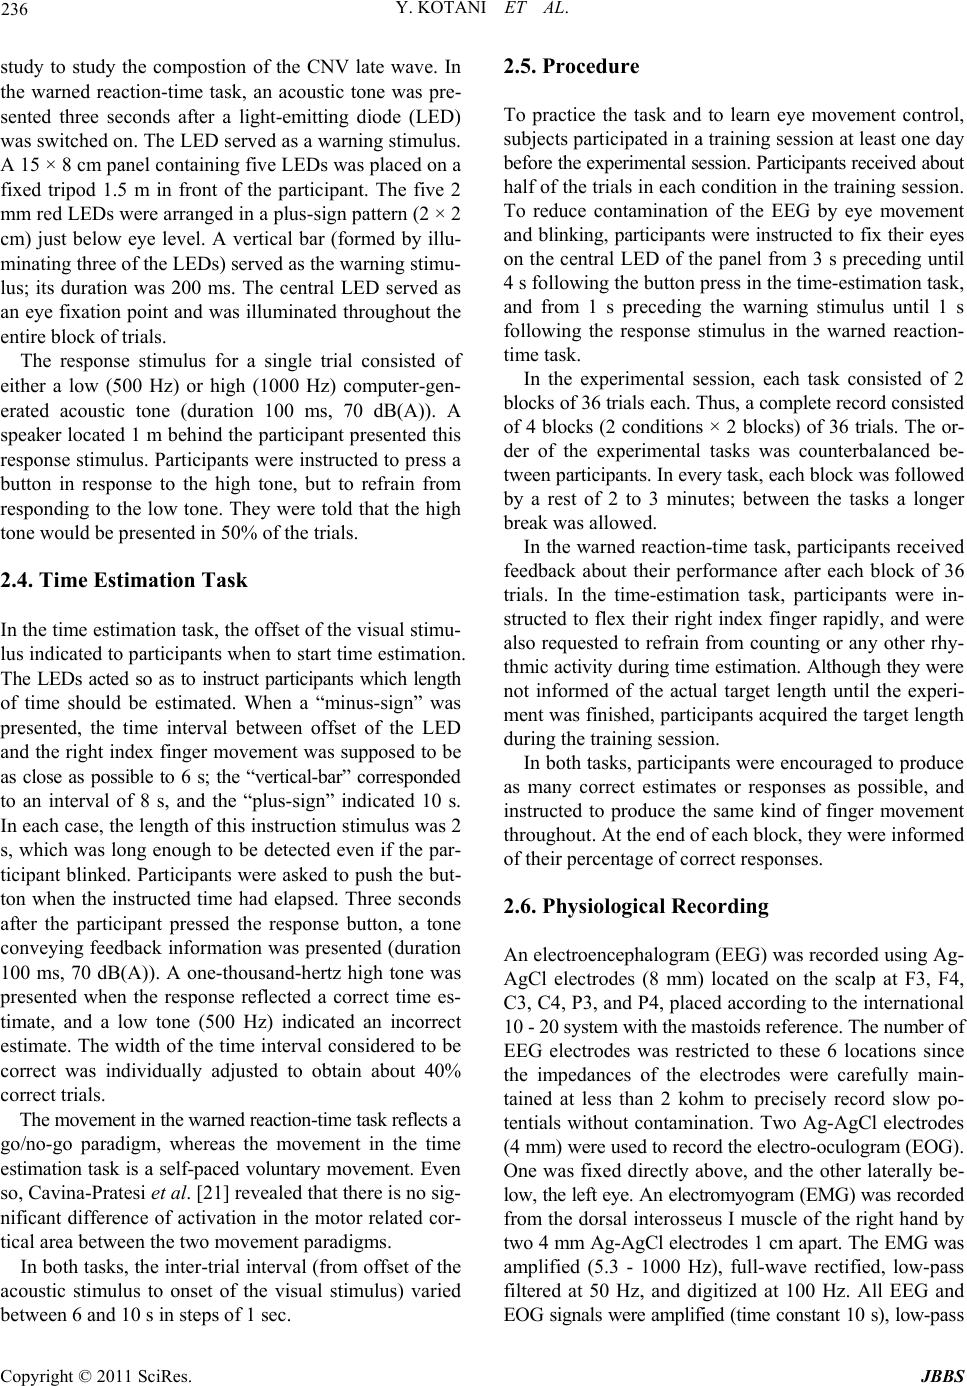 Y. KOTANI ET AL. 236 study to study the compostion of the CNV late wave. In the warned reaction-time task, an acoustic tone was pre- sented three seconds after a light-emitting diode (LED) was switched on. The LED served as a warning stimulus. A 15 × 8 cm panel containing five LEDs was placed on a fixed tripod 1.5 m in front of the participant. The five 2 mm red LEDs were arranged in a plus-sign pattern (2 × 2 cm) just below eye level. A vertical bar (formed by illu- minating three of the LEDs) served as the warning stimu- lus; its duration was 200 ms. The central LED served as an eye fixation point and was illumina ted throughout the entire block of trials. The response stimulus for a single trial consisted of either a low (500 Hz) or high (1000 Hz) computer-gen- erated acoustic tone (duration 100 ms, 70 dB(A)). A speaker located 1 m behind the participan t presented this response stimulus. Participants were instructed to press a button in response to the high tone, but to refrain from responding to the low tone. They were told that the high tone would be presente d in 50% of the trials. 2.4. Time Estimation Task In the time estimation task, the offset of the visual stimu- lus indicated to participants when to start time estimation. The LEDs acted so as to instruct participants which length of time should be estimated. When a “minus-sign” was presented, the time interval between offset of the LED and the right index finger movement was supposed to be as close as possible to 6 s; the “vertical-bar” corresponded to an interval of 8 s, and the “plus-sign” indicated 10 s. In each case, the length of this instruction stimulus was 2 s, which was long enough to be detected even if the p ar- ticipant blinked. Particip ants were asked to push the but- ton when the instructed time had elapsed. Three seconds after the participant pressed the response button, a tone conveying feedback information was presented (duration 100 ms, 70 dB(A)). A one-thousand-hertz high tone was presented when the response reflected a correct time es- timate, and a low tone (500 Hz) indicated an incorrect estimate. The width of the time interval considered to be correct was individually adjusted to obtain about 40% correct trials. The movement in the warned reaction-time task reflects a go/no-go paradigm, whereas the movement in the time estimation task is a self-paced voluntary movement. Even so, Cavina-Pratesi et al. [21] revealed that there is no sig- nificant difference of activation in the motor related cor- tical area between the two movement paradigms. In both tasks, the inter-trial interval (from offset of the acoustic stimulus to onset of the visual stimulus) varied between 6 and 10 s in steps of 1 sec. 2.5. Procedure To practice the task and to learn eye movement control, subjects participated in a training session at least one day before the experimental session. Participants received about half of the trials in each condition in the training session. To reduce contamination of the EEG by eye movement and blinking, participants were instructed to fix their eyes on the central LED of the panel from 3 s preceding until 4 s following the button press in th e ti me-estimation task , and from 1 s preceding the warning stimulus until 1 s following the response stimulus in the warned reaction- time task. In the experimental session, each task consisted of 2 blocks of 36 trials each. Thus, a complete record consisted of 4 blocks (2 conditions × 2 blocks) of 36 trials. The or- der of the experimental tasks was counterbalanced be- tween partic ipants. In every task, each block was followed by a rest of 2 to 3 minutes; between the tasks a longer break was allowed . In the warned reaction-time task, participants received feedback about their performance after each block of 36 trials. In the time-estimation task, participants were in- structed to flex their right index finger rapidly, and w ere also requested to refrain from coun ting or any other rhy- th mic activity during time estimation. Although they were not informed of the actual target length until the experi- ment was finished, participants acquired the target leng th during the training session. In both tasks, participan ts were encouraged to produ ce as many correct estimates or responses as possible, and instructed to produce the same kind of finger movement throughout. At the end of each block, they were informed of their percentage of correct responses. 2.6. Physiological Recording An electroencephalogram (EEG) was recorded using Ag- AgCl electrodes (8 mm) located on the scalp at F3, F4, C3, C4, P3, and P4, placed according to the international 10 - 20 system with the mastoids reference. The number of EEG electrodes was restricted to these 6 locations since the impedances of the electrodes were carefully main- tained at less than 2 kohm to precisely record slow po- tentials without contamination. Two Ag-AgCl electrodes (4 mm) were used to record the electro-oculogram (EOG). One was fixed directly above, and the other laterally be- low, the left eye. An electromyogram (EMG) was recorded from the dorsal interosseus I muscle of the right hand by two 4 mm Ag-AgCl electrodes 1 cm apart. The EMG was amplified (5.3 - 1000 Hz), full-wave rectified, low-pass filtered at 50 Hz, and digitized at 100 Hz. All EEG and EOG signals were amplified ( time constan t 10 s), low-pa ss Copyright © 2011 SciRes. JBBS  237 Y. KOTANI ET AL. filtered at 30 Hz (Butterworth, 6 dB per octave roll-off) and digitized on line at 100 Hz. Stimulus control and mea- surement of performance data were managed by a com- puter. All signals were segmented from 2.5 s preceding until 4 s following switch closure by a second computer and a 12-bit A/D converter. 2.7. Data Analysis Only trials fulfilling the following criteria were accepted for averaging: 1) the change in EEG and EOG ampli- tudes did not exceed 60 µV; 2) obvious body movements were not observed through the video camera; 3) the EMG production was not extremely large or small compared with other trials; 4) the produced time estimation was not less than 3 s in the time-estimation task, and the reac- tion time was not longer than 1 s in the warned reaction- time task. The data of each participant with at least 30 acceptable trials in each task were analyzed. We employed the strictest 60 µV criteria of EEG and EOG for averag- ing [22,23] to prevent EEG contamination. In the warned reaction-time task, the average during the 1 s period be- fore the warning stimulus was used as the baseline. In the time-estimation task, the mean amplitude from 2.5 s to 1.75 s preceding the button press was used as the baseline. 2.8. Real and Virtual CNV Late Waves To compose the virtual CNV from the sum of the RP and the SPN in the time-estimation task, the averaged EEG from 2500 ms before the onset of the feedback stimulus to 500 ms after the onset was superimposed on the aver- aged EEG during the interval from 2500 ms before to 500 ms after the button press. Because there was no re- sponse stimulus in the time estimation task, the onset time of the feedback stimulus was defined as the time of the virtual response stimulus for the virtual CNV. The late wave of the real CNV was calculated as the mean amplitude of the EEG in the interval of 300 ms before the response stimulus. The late wave of the virtual CNV was likewise the mean amplitude of the EEG in the in- terval of 300 ms before the virtual response stimulus. To examine whether there is a difference between the real and the virtual CNV, the CNV late waves were subjected to a repeated measures analysis of variance (ANOVA) with CNV type (Real, Virtual), Hemisphere (Left, Right), and Electrode (Frontal, Central, Parietal) as factors. In order to investigate whether the early wave over- lapped the late wave, the mean amplitudes of every 500 ms interval from the warning stimulus to the response stimulus were calculated. There were five time windows: from 501 ms to 1000 ms after the warning stimulus (ter- med the “1000 ms window”), from 1001 ms to 1500 ms (the 1500 ms window), from 1501 ms to 2000 ms (the 2000 ms window), from 2001 ms to 2500 ms (the 2500 ms win- dow), and from 2501 ms to 3000 ms (the 3000 ms win- dow). The mean CNV amplitudes in each time window were subjected to a repeated measures ANOVA with CNV type (Real, Virtual), Hemisphere (Left, Right), Electrode (Frontal, Central, Parietal), and Window (1000 ms win- dow, 1500 ms window, 2000 ms window, 2500 ms win- dow, 3000 ms window) as factors. When an interaction of CNV type by electrode posi- tion was significant, a normalization procedure [24] was conducted for testing interactions. Follow-up analyses were conducted, where appropriate, using univariate ANOVAs and paired-sample t tests. Greenhouse-Geisser and Bon- ferroni corrections were applied when appropr i ate. In the time est imation task, a virtual EOG was al so cal- culated, by superimposing the EOG preceding the feed- back stimulus upon the EOG before the button press. The mean amplitudes of the virtual EOG and the real EOG (in the 300 ms interval before the warning stimulus) were subjected to a repeated measures ANOVA with CNV type (Real, Virtual) as a factor in order to estimate the effect of EOG amplitude on CNV amplitude. All statistical analyses were conducted at a significance level of 5%. 3. Results 3.1. Task Performance In the warned reaction-time task, the mean reaction time was 308.6 ± 68.5 (S.D.) ms, and the mean correct ratio for the warned reaction was 97.2% ± 2.6%. In the time estimation task, the averaged percentage of correct time estimation was 52.7% ± 12.7%. The averaged widths of (time-interval defined) accurate time estimation were 641 ± 300 ms for 6 s, 825 ± 408 ms for 8 s, and 1108 ± 742 ms for 10 s. 3.2. Slow Potentials Figure 1 shows the grand averag es of the slow poten tials in the warned reaction-time task, and in the time-estima- tion task. CNV was indeed elicited between the warning stimulus and the response stimulus, and the RP and the SPN can be clearly observed before the button press (BP) and feedback stimuli (FB), respectively. 3.3. The Real and Virtual CNV Late Wave Recall that the virtual CNV late wave was calculated from the SPN and the RP, and the real CNV late wave was actually recorded in the warned reaction-time task. The Copyright © 2011 SciRes. JBBS 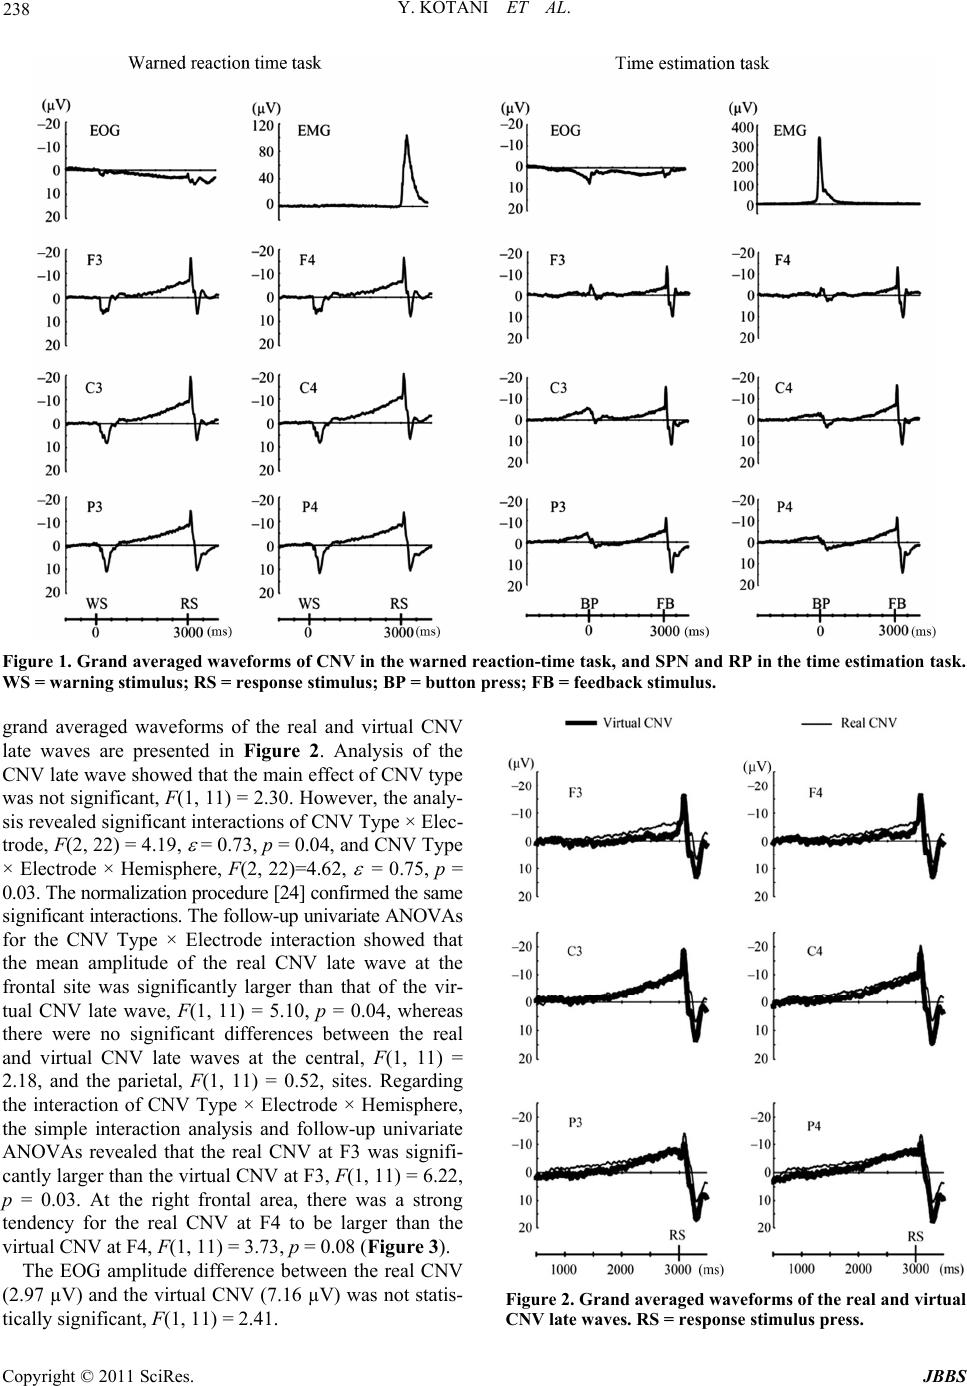 Y. KOTANI ET AL. Copyright © 2011 SciRes. JBBS 238 Figure 1. Grand averaged waveforms of CNV in the warned reaction-time task, and SPN and RP in the time estimation task. WS = warning stimulus; RS = response stimulus; BP = button press; FB = feedback stimulus. grand averaged waveforms of the real and virtual CNV late waves are presented in Figure 2. Analysis of the CNV late wave showed that the main effect of CNV type was not significant, F(1, 11) = 2.30. However, the analy- sis revealed significant interactions of CNV Type × Elec- trode, F(2, 22) = 4.19, = 0.73, p = 0.04, and CNV Type × Electrode × Hemisphere, F(2, 22)=4.62, = 0.75, p = 0.03. The normalization procedur e [24] conf irmed th e same si g n ifican t interaction s. The fo llow-up un ivariate ANOVAs for the CNV Type × Electrode interaction showed that the mean amplitude of the real CNV late wave at the frontal site was significantly larger than that of the vir- tual CNV late wave, F(1, 11) = 5.10, p = 0.04, whereas there were no significant differences between the real and virtual CNV late waves at the central, F(1, 11) = 2.18, and the parietal, F(1, 11) = 0.52, sites. Regarding the interaction of CNV Type × Electrode × Hemisphere, the simple interaction analysis and follow-up univariate ANOVAs revealed that the real CNV at F3 was signifi- cantly larger than the virtual CNV at F3, F(1, 11) = 6.22, p = 0.03. At the right frontal area, there was a strong tendency for the real CNV at F4 to be larger than the virtual CNV at F4, F(1, 11) = 3.73, p = 0.08 (Figure 3). The EOG amplitude difference between the real CNV (2.97 µV) and the virtual CNV (7.16 µV) was not statis- tically significant, F(1, 11) = 2. 41. Figure 2. Grand averaged waveforms of the real and virtual CNV late waves. RS = response stimulus press. 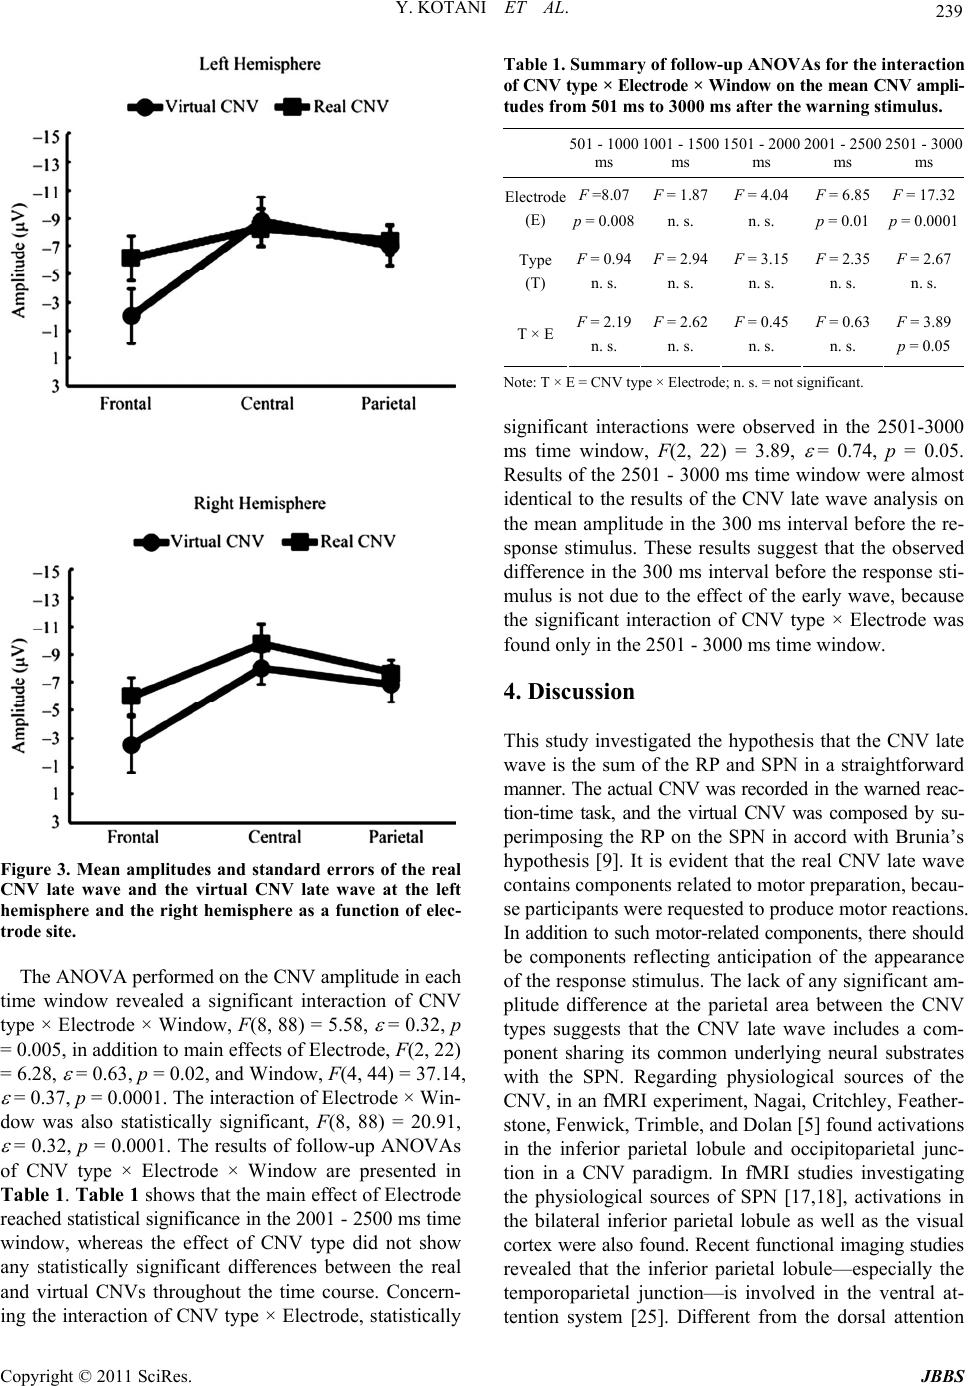 239 Y. KOTANI ET AL. Figure 3. Mean amplitudes and standard errors of the real CNV late wave and the virtual CNV late wave at the left hemisphere and the right hemisphere as a function of elec- trode site. The ANOVA performed on the CNV amplitude in each time window revealed a significant interaction of CNV type × Electrode × Window, F(8, 88) = 5.58, = 0.32, p = 0.005, in addition to main ef f ects of Electrod e, F(2 , 22) = 6.28, = 0.63, p = 0.02, and Window, F(4, 44) = 37.14, = 0.37, p = 0.0001. Th e interactio n of Electrode × Win- dow was also statistically significant, F(8, 88) = 20.91, = 0.32, p = 0.0001. The results of follow-up ANOVAs of CNV type × Electrode × Window are presented in Table 1. Table 1 shows that the main effect of Electrode reached statistical significance in the 2001 - 2500 ms time window, whereas the effect of CNV type did not show any statistically significant differences between the real and virtual CNVs throughout the time course. Concern- ing the interaction of CNV type × Electrode, statistically Table 1. Summary of follow-up ANOVAs for the interaction of CNV type × Electrode × Window on the mean CNV ampli- tudes from 501 ms to 3000 ms after the warning stimulus. 501 -1000 ms 1001 -1500 ms 1501 - 2000 ms 2001 - 2500 ms 2501 -3000 ms F =8.07F = 1.87F = 4.04 F = 6.85F = 17.32 Electrode (E) p = 0.008n. s. n. s. p = 0.01 p = 0.0001 F = 0.94F = 2.94F = 3.15 F = 2.35F = 2.67 Type (T) n. s. n. s. n. s. n. s. n. s. F = 2.19F = 2.62F = 0.45 F = 0.63F = 3.89 T × En. s. n. s. n. s. n. s. p = 0.05 Note: T × E = CNV type × Electrode; n. s. = not significant. significant interactions were observed in the 2501-3000 ms time window, F(2, 22) = 3.89, = 0.74, p = 0.05. Results of the 2501 - 3000 ms ti me window were almost identical to the results of the CNV late wave analysis on the mean amplitude in the 300 ms interval before the re- sponse stimulus. These results suggest that the observed difference in the 300 ms interval before the response sti- mulus is not due to the effect of the early wave, because the significant interaction of CNV type × Electrode was found only in the 2501 - 3000 ms time window. 4. Discussion This study investigated the hypothesis that the CNV late wave is the sum of the RP and SPN in a straightforward manner. The actual CNV was recorded in the w arned reac- tion-time task, and the virtual CNV was composed by su- perimposing the RP on the SPN in accord with Brunia’s hypothesis [9]. It is evident that the real CNV late wave contains components related to motor preparation, becau- se participants were requested to produce motor reactions. In addition to su ch motor-related components , there shoul d be components reflecting anticipation of the appearance of the response stimulus. The lack of any significant am- plitude difference at the parietal area between the CNV types suggests that the CNV late wave includes a com- ponent sharing its common underlying neural substrates with the SPN. Regarding physiological sources of the CNV, in an fMRI experiment, Nagai, Critchley, Feather- stone, Fenwick, Trimble, and Dolan [5] found activation s in the inferior parietal lobule and occipitoparietal junc- tion in a CNV paradigm. In fMRI studies investigating the physiological sources of SPN [17,18], activations in the bilateral inferior parietal lobule as well as the visual cortex were also found. Recent functional imaging studies revealed that the inferior parietal lobule—especially the temporoparietal junction—is involved in the ventral at- tention system [25]. Different from the dorsal attention Copyright © 2011 SciRes. JBBS  Y. KOTANI ET AL. 240 system that is engaged in goal orienting and voluntary attentional orientation, the ventral attention system is re- lated to processing salient stimuli and involuntary atten- tion orientation. Regarding the ventral attention system, Ecker et al. [26] showed that the dorsal attention system is modulated by the anterior insular cortex that belongs to the ventral attention system. Intriguingly, fMRI stud- ies of both the CNV [5] and the SPN [17] found activa- tions in the insula cortex, suggesting that both the dorsal and the ventral attention systems could contribute to the CNV late waves. Taking these into account, the CNV and the SPN might have common neural substrates in the pa- rietal regions that would relate to the ventral attention system interacting with the dorsal attention system. Although the real and the virtual CNVs were not dif- ferent at the central and parietal areas, an amplitude dif- ference was found at the frontal site: The real CNV late wave at the frontal area was larger than that of the virtual CNV. One possible reason for the observed amplitude difference at the frontal area is EOG amplitudes. The EOG might affect EEG amplitudes, especially in the frontal area. However, statistical analysis of EOG amplitudes of the real and the virtual CNVs rev ealed that there was no EOG amplitude difference between them. Furthermore, the elec- trode impedances were strictly controlled (keeping them less than 2 kohms), and the trials where EEG or EOG amplitudes exceeded the 60 µV criterion were rejected for EEG averaging. Therefore, EOG amplitude effects or other artifacts of frontal ERP amplitude should have been negligible. Another possible reason for the difference in the fron- tal area could be activation of medial and superior frontal areas in the CNV task. Gómez, Flores, and Ledesma [27] estimated physiological sources of the CNV using low- resolution brain electromagnetic tomography (LORETA), and found activations in the medial and superior frontal areas in addition to fronto-parietal lateral areas and ex- trastriate visual cortex. Th ey concluded that activation of fronto-parietal networks involved in endogenous atten- tional effort is a main contr ibutor to th e CNV. This notion is in agreement with fMRI findings that activities in the bilateral thalamus, anterior cingulate, and supplementary motor cortex were modulated by CNV amplitude [5]. Regarding frontal activations in the time estimation task, Ohgami et al. [13] calculated topography maps of SPN using high density electrodes, and found that SPN showed more activation at fronto-temporal areas than at fronto-medial areas. Furthermore, they found that the fron- tal SPN was affected by monetary reward, suggesting that the frontal SPN is more responsive to emotional antici- pation than perceptual anticipation. The fact that there is a frontal amplitude difference between the real and the virtual CNVs suggests that the SPN and the CNV have different neural substrates in the frontal area. As Gómez et al. [27] suggested, the CNV could contain the medial and superior frontal activations that are related to the fronto-parietal attention network. On the other hand, the SPN involves more lateral frontal activation that is re- lated to processing emotional and salient stimuli. These functional differences in the frontal area between the CNV and the SPN could be related to the frontal ampli- tude difference between the real and the virtual CNVs. 5. Conclusions In the present study, the real and virtual CNVs were com- pared to verify the hypothesis that the CNV late wave is the sum of the RP and the SPN. The finding that no am- plitude difference was found at the central and parietal areas suggests that the CNV and the SPN could share common neural substrates pertaining to attention systems. At the frontal area, the real CNV showed a larger ampli- tude than the virtual CNV, probably due to the medial and superior frontal activations related to the fronto-parietal attenti o n ne t work. 6. References [1] W. G. Walter, R. Cooper, V. J. Aldridge, W. C. McCallum and A. L. Winter, “Contingent Negative Variation: An Electric Sign of Sensorimotor Association and Expec- tancy in the Human Brain,” Nature, Vol. 203, 1964, pp. 380-384. [2] N. E. Loveless and A. J. Sanford, “Slow Potential Corre- lates of Preparatory Set,” Biological Psychology, Vol. 1, No. 4, 1974, pp. 303-314. doi:10.1016/0301-0511(74)90005-2 [3] J. W. Rohrbaugh and A. W. K. Gaillard, “Sensory and Motor Aspects of the Contingent Negative Variation,” In: W. K. G. Anthony and R. Walter, Eds., Advances in Psy- chology, North-Holland, 1983, pp. 269-310. [4] M. J. Liu, P. B. Fenwick, J. Lumsden, C. Lever, K. M. Stephan and A. A. Ioannides, “Averaged and Single-Trial Analysis of Cortical Activation Sequences in Movement Preparation, Initiation, and Inhibition,” Human Brain Ma- pping, Vol. 4, No. 4, 1996, pp. 254-264. doi:10.1002/(SICI)1097-0193(1996)4:4<254::AID-HBM 3>3.0.CO;2-2 [5] Y. Nagai, H. D. Critchley, E. Featherstone, P. B. Fenwick, M. R. Trimble and R. J. Dolan, “Brain Activity Relating to the Contingent Negative Variation: An fMRI Investi- gation,” Neuroimage, Vol. 21, No. 4, 2004, pp. 1232- 1241. doi:10.1016/j.neuroimage.2003.10.036 [6] E. J. Damen and C. H. Brunia, “Changes in Heart Rate and Slow Brain Potentials Related to Motor Preparation and Stimulus Anticipation in a Time Estimation Task,” Psychophysiology, Vol. 24, No. 6, 1987, pp. 700-713. doi:10.1111/j.1469-8986.1987.tb00353.x Copyright © 2011 SciRes. JBBS  Y. KOTANI ET AL. Copyright © 2011 SciRes. JBBS 241 [7] H. H. Kornhuber and L. Deecke, “Hirnpotentialderungen bei Wil lkbe wegun gen un d Pas sive n Bewe gungen des Men- schen: Bereitschaftspotential und Reafferente Potentiale,” Pflugers Archiv fur Die Gesamte Physiologie des Men- schen und der Tiere, Vol. 284, 1965, pp. 1-17. [8] G. J. Van Boxtel and C. H. Brunia, “Motor and Non- Motor Aspects of Slow Brain Potentials,” Biological Psy- chology, Vol. 38, No. 1, 1994, pp. 37-51. doi:10.1016/0301-0511(94)90048-5 [9] C. H. Brunia, “Movement and Stimulus Preceding Nega- tivity,” Biological Psychology, Vol. 26, No. 1-3, 1988, pp. 165-178. doi:10.1016/0301-0511(88)90018-X [10] C. H. Brunia, S. A. Hackley, G. J. van Boxtel, Y. Kotani and Y. Ohgami, “Waiting to Perceive: Reward or Punish- ment?” Clinical Neurophysiology, Vol. 122, No. 5, 2011, pp . 858-868. doi:10.1016/j.clinph.2010.12.039 [11] K. B. Bocker, “Spatiotemporal Dipole Models of Slow Cortical Potentials,” Ph.D. Dissertation, Tiburg Univer- sity, Tilburg, 1994. [12] G. J. Van Boxtel and K. B. E. Böcker, “Cortical Meas- ures of Anticipation,” Journal of Psychophysiology, Vol. 18, 2004, pp. 61-76. [13] Y. Ohgami, Y. Kotani, T. Tsukamoto, K. Omura, Y. Inoue, Y. Aihara and M. Nakayama, “Effects of Monetary Re- ward and Punishment on Stimulus-Preceding Negativity,” Psychophysiology, Vol. 43, No. 3, 2006, pp. 227-236. doi:10.1111/j.1469-8986.2006.00396.x [14] Y. Ohgami, Y. Kotani, S. Hiraku, Y. Aihara and M. Ishii, “Effects of Reward and Stimulus Modality on Stimulus- Preceding Negativity,” Psychophysiology, Vol. 41, No. 5, 2004, pp. 729-738. doi:10.1111/j.1469-8986.2004.00203.x [15] Y. Kotani, S. Kishida, S. Hiraku, K. Suda, M. Ishii and Y. Aihara, “Effects of Information and Reward on Stimulus- Preceding Negativity Prior to Feedback Stimuli,” Psycho- physiology, Vol. 40, No. 5, 2003, pp. 818-826. doi:10.1111/1469-8986.00082 [16] C. H. Brunia and G. J. van Boxtel, “Anticipatory Atten- tion to Verbal and Non-Verbal Stimuli Is Reflected in a Mo da lity-Specific SPN,” Exp e ri me nt al B rai n Re sear c h, Vol. 156, No. 2, 2004, pp. 231-239. doi:10.1007/s00221-003-1780-2 [17] Y. Kotani, Y. Ohgami, Y. Kuramoto, T. Tsukamoto, Y. Inoue and Y. Aihara, “The Role of the Right Anterior In- sular Cortex in the Right Hemisphere Preponderance of Stimulus-Preceding Negativity (SPN): An fMRI Study,” Neuroscience Letters, Vol. 450, No. 2, 2009, pp. 75-79. doi:10.1016/j.neulet.2008.11.032 [18] T. Tsukamoto, Y. Kotani, Y. Ohgami, K. Omura, Y. Inoue a nd Y. Aihara, “Activation of Insular Cortex and Subcortical Regions Related to Feedback Stimuli in a Time Estima- tion Task: An fMRI Study,” Neuroscience Letters, Vol. 399, No. 1-2, 2006, pp. 39-44. doi:10.1016/j.neulet.2006.01.061 [19] J. W. Rohrbaugh, K. Syndulko and D. B. Lindsley, “Brain Wave Components of the Contin gent Negative Variation in Humans,” Science, Vol. 191, No. 4231, 197 6, p p. 10 55-1057. doi:10.1126/science.1251217 [20] R. C. Oldfield, “The Assessment and Analysis of Hand- edness: The Edinburgh Inventory,” Neuropsychologia, Vol. 9, No. 1, 1971, pp. 97-113. doi:10.1016/0028-3932(71)90067-4 [21] C. Cavina-Pratesi, K. F. Valyear, J. C. Culham, S. Kohler, S. S. Obhi, C. A. Marzi and M.A. Goodale, “Dissociating Arbitrary Stimulus-Response Mapping from Movement Planning during Preparatory Period: Evidence from Eve nt- Related Functional Magnetic Resonance Imaging,” Journal of Neuroscience, Vol. 26, No. 10, 2006, pp. 2704-2713. doi:10.1523/JNEUROSCI.3176-05.2006 [22] Y. Kotani and Y. Aihara, “The Effect of Stimulus Dis- criminability on Stimulus-Preceding Negativities Prior to Instructive and Feedback Stimuli,” Biological Psychology, Vol. 50, No. 1, 1999, pp. 1-18. doi:10.1016/S0301-0511(98)00047-7 [23] E. J. Damen and C. H. Brunia, “Is a Stimulus Conveying Task-Relevant Information a Sufficient Condition to Elicit a Stimulus-Preceding Nega t i v it y ?” Psychophysiology, Vol. 31, No. 2, 1994, pp. 129-139. doi:10.1111/j.1469-8986.1994.tb01033.x [24] G. McCarthy and C. C. Wood, “Scalp Distrib utions of Ev- ent-Related Potentials: An Ambiguity Associated with Analysis of Variance Models,” Electroencephalography and Clinical Neurophysiology, Vol. 62, No. 3, 1985, pp. 203208. [25] M. D. Fox, M. Corbetta, A. Z. Snyder, J. L. Vincent and M. E. Raichle, “Spontaneous Neuronal Activity Distin- guishes Human Dorsal and Ventral Attention Systems,” Proceedings of the National Academy of Sciences of the United States of America, Vo l. 10 3, No. 26, 20 06, pp . 10046- 10051. doi:10.1073/pnas.0604187103 [26] M. A. Eckert, V. Menon, A. Walczak, J. Ahlstrom, S. Den- slow, A. Horwitz and J. R. Dubno, “At the Heart of the Ventral Attention System: The Right Anterior Insula,” Human Brain Mapping, Vol. 30, No. 8, 2009, pp. 2530- 2541. doi:10.1002/hbm.20688 [27] C. M. Gómez, A. Flores and A. Ledesma, “Fronto-Pa- Rietal Networks Activation during the Contingent Nega- tive Variation Period,” Brain Research Bulletin, Vol. 73, No. 1-3, 2007, pp. 40-47. doi:10.1016/j.brainresbull.2007.01.015
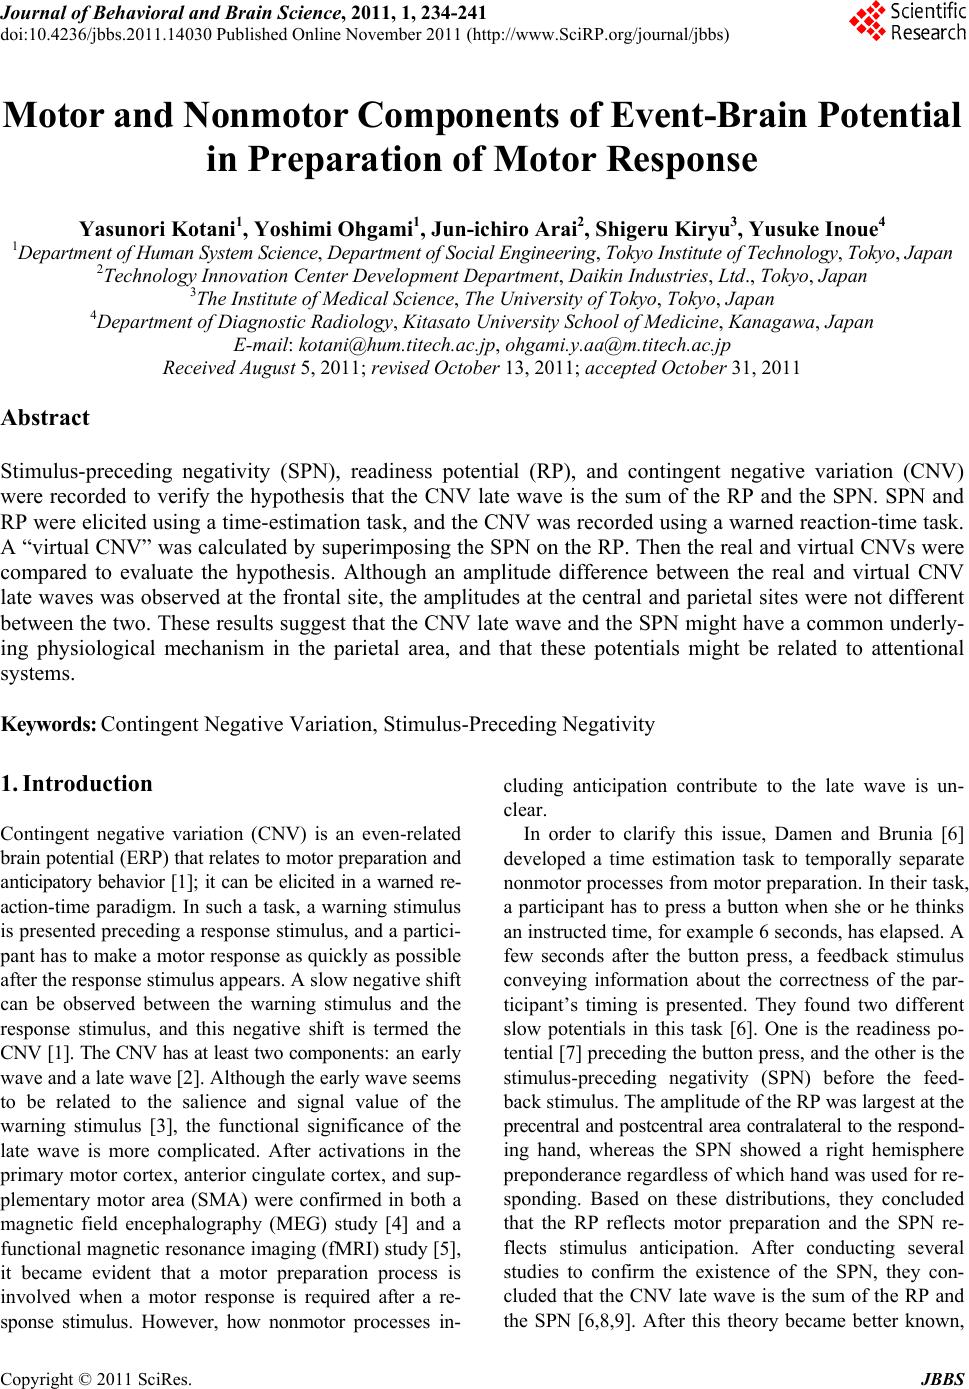
|