 Journal of Behavioral and Brain Science, 2011, 1, 210-228 doi:10.4236/jbbs.2011.14028 Published Online November 2011 (http://www.SciRP.org/journal/jbbs) Copyright © 2011 SciRes. JBBS Behavioral Evidence for Cognitive Dysfunctions in the (BALB/cByJ-Kv1.1mceph/mceph) Mouse Model for Epilepsy Sarah Holst1,4, Elin Åberg2, Therese M. Eriksson3, Catharina Lavebratt2, Sven Ove Ögren1 1Department of Ne ur osci enc e, Karolinska Institute, Stockholm, Swede n 2Department of Molecular Medicine and Sur gery, Karolinska University Hospital, Stockholm, Sweden 3Center of Molecular Medicine, Department of Physiology and Pharmacology, Karolinska Institute, Stockholm, Sweden 4Department of Clinical Neuroscience, Karolinska Institute, Stockholm, Sweden E-mail: Sarah.Holst@ki.se Received July 25, 201 1; revised August 16, 2011; accepted September 5, 20 1 1 Abstract The epileptic mouse model BALB/cByJ-Kv1.1mceph/mceph (mceph/mceph) is homozygous for a spontaneous mutation truncating the Shaker-like voltage gated potassium channel, Kv1.1 (Kcna1). The mceph/mceph mice are asymptomatic at birth, but develop from 3 weeks of age epileptic seizures, overgrowth and neuronal hyperplasia of the hippocampus. Hippocampal cognitive function of the mice was examined by investigating emotional memory using the aversive Passive Avoidance (PA) task combined with studies of explorative behavior using the non-aversive Novel Cage test (NCT). The behavioural results were examined by multi- variate analysis. Compared to wild type and heterozygous mice, the mceph/mceph mice displayed lower ex- ploratory and safety assessment behavior in the NCT and impairment in PA retention 24 hours after training, indicating an impairment in cognitive functions. In conclusion, the epileptic mouse model BALB/cByJ- Kv1.1mceph/mceph, with chronic epilepsy related to potassium-channelopathy, display a behavioural phe- notype characterized by impairments in emotional memory and defensive motivational responses probably related to hippocampal dysfunctions. Keywords: Epilepsy, Potassium Ion-Channelopathy, Hippocampus, Passive Avoidance, Novel Cage Test, Principal Component Analysis 1. Introduction The potassium-channel subunit Kv1.1 is widely expressed in neurons and forms tetramers with other Kv1 subunits, creating channels that regulate neuronal excitability and signaling. Lack of Kv1.1 has been reported to cause hy- perexcitability of CA3 pyramidal cells in hippocampus, of auditory neurons and of pyramidal neurons in the neo- cortex [1-3]. Consequently, Kv1.1 single amino acid sub- stitutions, currently 17, result in an alteration in channel function, associated with human episodic ataxia type 1 and partial epilepsy in humans [4]. A case study has re- ported a more severe Kv1.1 mutation that lacked the C- terminal with retained pore domain but altered current kinetics; which was asso ciated with severe drug-resistant episodic ataxia type 1 [5 ]. The BALB/cByJ-Kv1.1mceph/mceph (mceph/mceph) mice carry a spontaneous severe mutation in Kv1.1 resulting in expression of a Kv1.1 containing only the N-terminal domain, the first transmembrane domain and the first ex- tracellular loop. Therefore, this truncated Kv1.1 lack s the voltage sensor and ion pore domains and appears to be rapidly degraded in the brain [6]. Both the mceph/mceph mice as well as Kv1.1 null mice, which completely lack the Kv1.1, display progressive complex partial seizures involving primarily the limbic syste m [7,8]. Temporal lobe epilepsy (TLE) is the most common par- tial epilepsy in adults and there is growing evidence for genetic predisposition [for review see 9 ]. TLE in humans and rodent models is characterized by hippocampal sei- zures commonly followed by rapid loss of neural cells through necrosis. Thereafter, there is a dramatic rescue attempt through altered expression of trophic molecules, and an increased gliosis and neurogenesis seen in the hip- pocampus. The extent of survival of the newly formed cells is controlled by apoptosis [10]. TLE is for some, but far from all, clinical cases accompanied by hippo- campal sclerosis (loss of pyramidal neurons, granule cell  211 S. HOLST ET AL. dispersion and r eactive gliosis) not directly related to th e severity of the epileptic disorder [9]. The mceph/mceph mice show, from 3 weeks of age, mild seizures (hind leg tonus and jittering, epileptiform in vivo EEG recordings and increased firing frequency in stimulated hippocampal mossy cells [7]; Fisahn et al. sub- mitted), disturbances in expression of several growth re- gulating hormones and trophic neuropeptides in the hip- pocampus and the amygdala [11], as well as reactive glios is and increased neuronal proliferation in the hippocampus. The increased proliferation in combination with reduced apoptosis results in a h ippocampus characterized by dou- bled number of neurons in dentate gyrus (DG) and CA3 at 10 - 12 weeks of age [6,12-15]. Kv1.1 null (–/–) mice show a similar phenotype, whereas heterozygous mice (mceph/+ and –/+) show hippocampal volume similar to that in wild types at 10 - 12 weeks of age but it is not known if the heterozygotes are characterized by exces- sive proliferation [13]. Thus, impeding a reduction of in- tracellular potassium is known to inhib it apoptotic ev ents in various cell types [16]. TLE is often associated with an impaired memory [17- 19] probably due to hippocampal dysfunctions [20]. The hippocampal formation is crucial for memory, e.g. spatial and emotional memories [21-24]. Thus, specific hippo- campal dysfunctions might represent a causal link be- tween seizures and memory impairment [17,25]. Animal models of epilepsy may help to enhance our understand- ing of mechanisms underlying cognitive abnormalities in different epilepsy disorders. The most common model of TLE, pilocarpine or kainate-induced status epilepticus and subsequent recurrent seizures in rodents, leads to impaired visual-spatial memory and modest neurodegeneration in CA1, CA3 and dentate gyrus [23,24]. In addition, a non- spatial memory deficit was found in the genetic TLE mouse model lacking the presynaptic scaffolding protein Bsn resulting in an abnormal apical dendrite morphology in CA1 pyramidal neurons [26]. Hippocampal related cog- nitive functions have to our knowledge not been previ- ously investigated in any chronic genetic epilepsy model without hippocampal neurodege neration. The aim of the present study was to investigate hippo- campal/amygdala [21,29] functions expressed as emotiona l memory in the Passive Avoidance test (PA) and to relate such effects to the behavioral phenotype in this mouse model of epilepsy by studying homozygous mceph/mceph mice, and heterozygous (mceph/+) mice. In addition, an- xiety-related behavior was assessed in the Elevated Plus Maze (EPM) and Open Field (OF), while the Rotarod was used to investigate motor coordination. The previously described physiological characteristics of mceph/mceph mice, such as teary eyes, low body weight and seizures [27], were scor ed fo r v erification. The behaviors displayed at PA training and retention was scored au toma tica lly by a compu ter based syst em, with the addition of manual recordings of additional behaviors by the experimenter. Moreover, an extensive behavioral characterisation at 3 and 6 weeks of age was performed with the Novel Cage test (NCT). The results obtained in the PA and NCT were analyzed with the multivariate analyse principal component analysis (PCA) in order to characterize a behavioral profiles for each genotype. 2. Materials and Methods 2.1. Animals The experiment comprised of 132 BALB/cByJ-Kv1.1mceph/mceph (mceph/mceph) mice of wild type (+/+), heterozygotes (mceph/+) and homozygous mutants (mceph/mceph) (Ex- periment 1: wild type n = 10, heterozygotes n = 22, n = 16; Experiment 2: wild type n = 13, heterozygotes n = 16, mceph/mceph n = 9; Experiment 3: wild type n = 9, het- erozygotes n = 9; Experiment 4: heterozygotes n = 18, mceph/mc eph n = 10). Male and female mice (3 to 6-weeks old) were housed in a light/temperature/humidity-con- trolled environment: 12-h light-dark cycle (light on at 06:00 h), temperature 22˚C ± 1˚C and 40% - 50% humidity. Mice were housed in groups of 2 - 7 animals in standard transparent M3 Macrolon® cages (1290H Euro standard Type III 425 × 266 × 155 mm - floor area 820 cm², Ma- terialScience, Leverkusen, Germany) lined with bedding material (Scanbur’s Aspen wood Bedding, Scanbur AB Sweden, Sollentuna, Sweden). Food (R34, Labfor, Lant- männen, Stockholm, Sweden) and tap water were provided ad libitum. All experiments were performed between 8 a.m. and 3 p.m. All animals were treated according to the guidelines approved by the local ethics committee (Stock- holm Northern Ethics Board of Animal Experimentation) and the “Principles of laboratory animal care” (NIH pub- lication No. 86-23, revised 19 85). 2.2. Experimental Design The experimental design was adapted to the brain devel- opment and impairments due to seizure activity; the NCT was examined after weaning and one month later to ex- amine developmental impairments. The emotional mem- ory was examined at four weeks when the brain is fully developed [30]. Moreover, this time point was also cho- sen to avoid the increased seizure activity with age in the mceph/mceph. Experiment 1: Each mouse was tested in the NCT after weaning (21 - 22 days of age), PA (four weeks of age) and the NCT (six weeks of age). Body weight, eye condition and vocalisations were recorded after each NCT. Since Copyright © 2011 SciRes. JBBS  S. HOLST ET AL. 212 the seizures tend to develop and increase from 3 weeks of age until 6 weeks of age when the animals are retarded, the mice was tested after weaning, in order to test them when they were old enough but not influenced by their seizures and then before they could not perform the NCT test due to too many seizures. Experi ment 2: Each mouse was tested in three tests dur- ing their fourth week of age. Two days elapsed between the tests. First they were tested in the PA, followed by OF and th e EPM. Experiment 3: The motor coordination of two sets of heterozygotes and mceph/mceph mice were examined in the Rotarod. In the first set the mice were 28 and 38 days old and in the second test 28, 34 and 38 days old. Experiment 4: Five weeks old mice which did not take part in the behavioral experiments were used for the his- tological examination. This procedure was used in order to reduce the risk of eliciting seizure in mice subj ected to the behavioural testing. 2.3. Step-Through Passive Avoidance Test (PA) The PA emotio nal memo ry task was ch osen since p ilot stu- dies showed large variations in the ability to perform the tasks in two other memory tests; Novel Object Recogni- tion test and the Morris Water Mazes related to a high de- gree of emotionality in the background strain B ALB/c [28]. The PA task is an associative learning paradigm based on contextual fear conditioning (Pavlovian conditioning), involving neuronal circuits in the limbic forebrain, such as hippocampus and amy gdal a [21,29] . In t he st ep-t hrough PA procedure, performed in a two-compartment box, the suppression of the innate preference of rodents for the dark compartment following the exposure to an inescap- able foot shock is defined as PA behavior [29-32]. Me- mory retention was tested in a computer-controlled PA (TSE-Systems GmbH, Homburg, Germany). In order to evaluate the effect of strength of the aversive cue on per- formance two separate experiments was performed; the first experiment had an electrical current of 0.30 mA and the second of 0.50 mA. Test of memory retention was performed 24 hours after the training [31,32]. During training the mouse was placed in a brightly lit (ca 1200 lux) compartment (BC) (280 × 155 × 160 mm) for 60 s. Then the door be tween th e co m- partments was opened and the mouse has free access to the dark compartment (DC) (280 × 155 × 160 mm). Upon entering the DC the door closes after 3 s and the mouse received weak electrical current (US) (duration 1 s) 0.30 mA (Exp. 1, “low aversity”) or 0.50mA (Exp. 2, “high aversity”). The mouse is left in the dark compartment for 60 s after the aversive cue (US) had been presented to increase the association of the context and the US [31,32] . In the retention test the mouse was placed in the BC with the door closed. After 15 s the door was opened and the mouse had free access to both compartments for 10 min, 600 s. The memory retention was examined by measur- ing the latency time to the first transfer from the BC to the DC with a cut-off latency of 10 min (600 s) [31-33]. After the end of each test, the arena was cleaned and deodorised after each animal using 70% ethanol. Since the mceph/mceph mice have a reduced locomo- tor activity partly due to sub-epileptic seizures, to facili- tate step-through the size of the BC was diminished to one third of the total size, by placing a wall of transparent plastic placed 10 grid bars away from the door. In addition to the step-through latency time, the dura- tion of activity, inactivity, exploration, place preference and transfers were computer based calculated by the PA software (see Table 1 for definitions). Moreover, the fre- quency of rearings (free- and wall rearing), stretch attend postures (SAP) and grooming, as well as the number of feces were rec orded manually (see Table 1 for definitions). 2.4. Novel Cage Test (NCT) The NCT evaluates emotional reactivity by quantifying exploration and risk assessment behavior [34]. The mouse was placed in the centre of clean a Macrolon type III cage with fresh bedding under a light intensity of approxima- tely 200 lux. The behavior was video-recorded for 5 min using a digital camera placed above the cage. The laten- cy time, frequency and duration of the behaviors describe d in Table 2. were analyzed with EthoLog® [35]. After NCT the mice were weighed (SP401 Scout Pro Scale, Ohaus Corporation, New Jersey, USA). Since the mceph/mceph mice often have red and teary eyes the eye condition of the individual was registered as normal (0) or abnormal (1). In addition, the number of vocalisations per individual was registered during handling by the ex- perimenter. 2.5. Elevated Plus Maze (EPM) Anxiety-related behavior was assessed using the EPM con- sisting of a cross-shaped platform with two arms without walls (open arms; 30 × 5 cm), two arms with walls (closed arms; 30 × 5 cm) with open endings and a central arena (5 × 5 cm). The apparatus was elevated 1 m above the floor. The light intensity o n the EPM was about 300 lux. Two white lamps placed above and facing outwards, as well as a fluorescent lamp illuminated the arena indi- rectly. Mice were placed individually in the central arena and left to explore for 5 min. The latency time to first visit, the total visits, distance travelled and time spent in the open arms, closed arms and in the central region were Copyright © 2011 SciRes. JBBS  S. HOLST ET AL. Copyright © 2011 SciRes. JBBS 213 Table 1. Ethogram of behaviors registered in the PA test (Ex p 1 & 2). Behavioral categories (unit) Computer based (C) or visually recorded (V) Measured in BC and/ or DC during Trai ning (TR) and/or Retention (RE) Definition Activity (s) C TR/RE BC DC Duration of locomotor activity more than 5 cm/s i n B C respective DC. Locomotion Inactivity (s) C TR/RE BC DC Duration of no activity less than 5 cm/s measured i n BC during training before door opened. Exploring (s) C TR/RE BC DC Forward locomotor activity in which two photo beams after one another is broken in BC respective DC. Free rearing (nr) V TR BC RE Rising and standing o nly on hind legs and then putting the front legs back down. Exploration Transfer (nr) V RE The number of transfers between the compartments. Risk assessment Stretched attend posture (SAP) (nr) V RE BC Stretching the neck or front part of the body while sniffing the air, with 4 paws on the floor. Measured only at the retention session. Grooming (nr) V TR/RE BC Shaking, scratching, wiping or licki n g body parts (fur, ears, nose, tail). Time spent in BC (s)C RE BC DC The duration of photo beams broken in the BC. Time spent in DC (s)C RE BC DC The duration of photo beams br oken in the DC. Other Feces (nr) V TR/RE BC DC Number of feces in BC/DC. Table 2. Ethogram of behaviors registered in NCT (Exp 1). Behavioral categories Definition Motionless Sitting or lying immobile. Locomotion Walking Locomotor behavior with normal body posture. Investigating Exploring flo or, cage walls or air trough olfactory activity. Free rearing Standing on hind legs. Exploration Wall rearing Standing on hind legs with forepaws leani ng against a wall. Stretch attend posture (SAP) Stretching the n eck or front part of the body while sniffing the air, with 4 paws on the floor a flat body posture. Risk assessment Stretch approach Walking with a flat body posture stretched and close to the floor. Self-Grooming Displacement behavior; Scratching, shaking, wiping or licking body parts (fur, ears, nose, tail). Burrowing Defensive behavior; Moving substrate forward with front paws and nose, or backwards with hind paws. Freezing Escape behavior; Sudden suppres sion of movement. Other behaviors Escape Jumping towards the walls of the appara tus-measured but did not appear.  S. HOLST ET AL. 214 recorded by a video camera mounted in the ceiling and analysed by the TSE system (Hamburg, Germany), as well as the number of transitions between the walled arms. Arm entries were defined as entering the arms with all four paws. The open time ratio is taken as a measure of anxiety-like behavior and is calculated by dividing the time spent in the open arms and the central region with the total time. After the end of each test, the arena was cleaned as described in the PA. 2.6. Open Field Test (OF) Spontaneous locomotor activity and anxiety-like behav- ior were as se s sed in a n OF cha mbe r , a s qu are a r en a (50 × 50 × 25 cm) made of black glacial polyvinyl chloride. Intense light and sound often provokes seizures in the mceph/mceph mice, so the arena was sparsely illuminated by 2 × 60 W lamps with red light mounted 1.5 m above the box. The area was divided into 16 quadrants (4 cen- tral and 12 peripheral, 10 cm from the walls). Mice were placed individually into the centre of the OF and left to explore for 5 min. The time spent in the central and pe- ripheral zones, total distance travelled during the experi- ment and numbers of crossings between the zones were automatically recorded b y the TSE digital analysing sys- tem based on a video camera and PC-compatible software (TSE, Hamburg, Germany). To assess anxiety-like behavior, the percentage of the time spent in the centre of the OF was used. The bo x was cl eaned as described i n the PA . 2.7. Accelerating Rotating Rod Test The accelerating Rotarod (Ugo Basile, Biological Re- search Apparatus, Varese, Italy) was used to test balance and motor coordination. The Rotarod test was performed by placing a mouse on a rotating drum (3 cm of diameter) and automatically recording the time that each mouse was able to achieve walking on the top of the rod. The speed of the Rotarod accelerated from 8 to 40 rpm over a 4.5-min period. Mice were given four consecutive trials with a minimum of 15 min inter-trial rest interval. The fall latency average of these four trials was used for sta- tistical analysis. 2.8. Perfusion Mice deeply anesthetised with isofluran (Abbot Scandi- navia AB, Solna) were perfused transcardially with 10 ml Ca2-free Tyrode’s solution including 0.1 ml heparin, followed by 50 ml of fixative (4% paraformaldehyde and 0.4% picric acid in 0.16 M PBS, pH 7.4) at forced pres- sure. Brains were dissected and postfixed in the same fixative for 1 h at room temperature and subsequently rinsed in 0.1 M PBS with 10% sucrose and 0.1% sodium azide several times during 48 hr. The brains were stored in sucrose solution at 4˚C before cryosectioning. 2.9. Immunohistochemistry Coronal sections 30 µm were cut using a cryostat (Mi- crom) through the en tire hippocampus starting at –0.94 mm from bregma and ending at –3.88 mm from bregma [36]. Every tenth section was processed for mature neuronal nuclei, by staining with NeuN (Chemicon, Temicula, CA, USA) immunohistochemistry. A mouse on mouse (MOM) kit for NeuN-immunodetection (Vector, Burlingame, CA, USA) was used according to manufacturer’s instruction. Briefly, primary antibody (NeuN, 1:100) was diluted in MOM diluent and incubated in 4˚C overnight. Biotiny- lated secondary antibody (antimouse IgG, MOM kit) was diluted in MOM diluent (1:250) followed by an incuba- tion in room temperature for 1 h. Avidin-biotin (Vector Laboratories, Inc. Burlingame, CA, USA) was then ad- ministered for 40 min in room temperature followed by visualization by 3.3’-diaminobenzidine (DAB) (Sigma- Aldrich Sweden AB, Stockholm, Sweden). All slides were dehydrated and mounted with Pertex (Histolab Pro- ducts AB, Göteberg). 2.10. Stereology The optical fractionators-method was used to count NeuN- immunoreactive cells in the entire dentate gyrus [36-38]. Briefly, every tenth section was systematically sampled and an unbiased counting frame with a known area was then superimposed on the field of view, where after count- ing frames were systematically distributed throughout the marked region from a random starting point. The optical fractionator estimates are free of assumptions about cel- lular shape and size and are unaffected by tissue shrink- age. The dentate gyrus, including an area exceeding the subgranular zone by two cell diameters and an area ex- ceeding the molecular layer by one cell diameter, was manually outlined using a 10× lens. Cell counts were per- formed with a 60× lens (numerical aperture = 1.4). 2.11. Statistical Analysis The data were first analysed for the normality by assess- ing the sample distribution or by Levine’s test of homo- geneity for variances. The results which passed the tests for normality were analysed with parametric test. Dif- ferences between the groups were tested with one way- analysis of variance (ANOVA). Significant differences between groups were tested with the Fisher LSD test. The results which did not passed the tests for normality Copyright © 2011 SciRes. JBBS  215 S. HOLST ET AL. were analysed with th e non-parametric Mann Wh itney-U test. Comparisons of repeated measurements were ana- lysed by the Wilcoxon Matched Pairs Test; p-values of 0.05 or less were regarded as statistically significant. The results were analysed using Statistica 7.0 (Statsoft, Up- psala, Sweden). The results analysed parametrically are presented as means ± SEM. The results analysed non-pa- rametrically are presented as scatter plot with median. A pattern recognition analysis was used to establish the different response patterns of each genotype by use of a multivariate data analysis, the SIMCA (Soft Inde- pendent Modelling of Class Analogy), principal compo- nents analysis (PCA); PCA SIMCA-P+11 software (Ume- trics ). Using both scaling and mean-centring, variables are pre-processed to standardise weighting of each para- meter. The PCA transforms the number of possibly cor- related variables into a smaller number of uncorrelated variables that are called principal components. The first component represents the largest variation in the data set, the second component the largest of the remaining vari- ance, etc [39]. 3. Results 3.1. Step-Through Passive Avoidance 3.1.1. Step-Through Latenc y Low aversity cue (Exp 1) There was a significant effect of genotype on training latency (H (2, N = 39 ) = 10.72, p = 0.0046), as well as on the retention latency (H (2, N = 47) = 6.46, p = 0.040) (Figure 1, Table 3). High aversity cue (Exp 2) The training latency was longer in the mceph/mceph mice (H (2, N = 50) = 8.01, p = 0.018), compared to the het- erozygous (p = 0 .0046) an d to the wild types (p = 0.0 14). There was no significant effect of genotype on the reten- tion latency (Figure 1, Table 3). Comparing the training latency time with the retentio n latency within the same individual showed in both expe- riments, that the retention latency was significantly in- creased in the wild type (Z = 2.38, p = 0.017; Z = 2.84, p = 0.0045) and heterozygotes (Z = 3.12, p = 0.0018; Z = 3.88, p = 0.00011) whereas it was unchanged in the mceph/- mceph mice (Z =0.45, p =0.65; Z = 1.18, p = 0.24) (Fig- ure 1, Ta ble 3). These data indica te that th e wild type a n d heterozygous mice acquired the emotional learning task, since they showed avoidance of the aversive dark com- partment, at retention. In contrast, latency between train- ing and retention did not differ in the mceph/mceph mice. 3.1.2. Additional Behaviors Recorded in the PA Compared to wild type and the heterozygous mice the mceph/mceph mice, in both experiments, displayed a sig- nificantly lower risk assessment and explorative behav- iors, as well as general activity in the bright compartment (Table 3). 3.1.3. C omparison o f the mceph/mceph, Heterozygous and Wild Type Mice in the PA In view on the large amount of data recorded during the PA, it is critical to use statistics that include multivariate analysis. Therefore, PCA based on the PA results pre- sented in the Table 3 was used to identify clusters and (a) (b) Figure 1. The step-through latency time (s) of “low adversity” (Exp. 1, 0.30 mA) (a) and “high aversity” (Exp. 2, 0.50 mA) (b) in the Passive Avoidance (PA) test presented in a scatter plot with median. The retention latency was significantly increased compared to the training latency in the wild type (0.30 mA: p < 0.05; 0.50 mA: p < 0.01) and heterozygous (0.30 mA: p < 0.01; 0.50 mA: p < 0.001), while it was unchanged in the mceph/mceph mice. WT = wild type mice, HE = to heterozygous mice, MUT = mceph/mceph mice. # p = 0.05 ## p= 0.01 comparing training to retention in wild type mice, ** p= 0.01;*** p= 0.001 comparing training to retention in heterozygous mice. Copyright © 2011 SciRes. JBBS 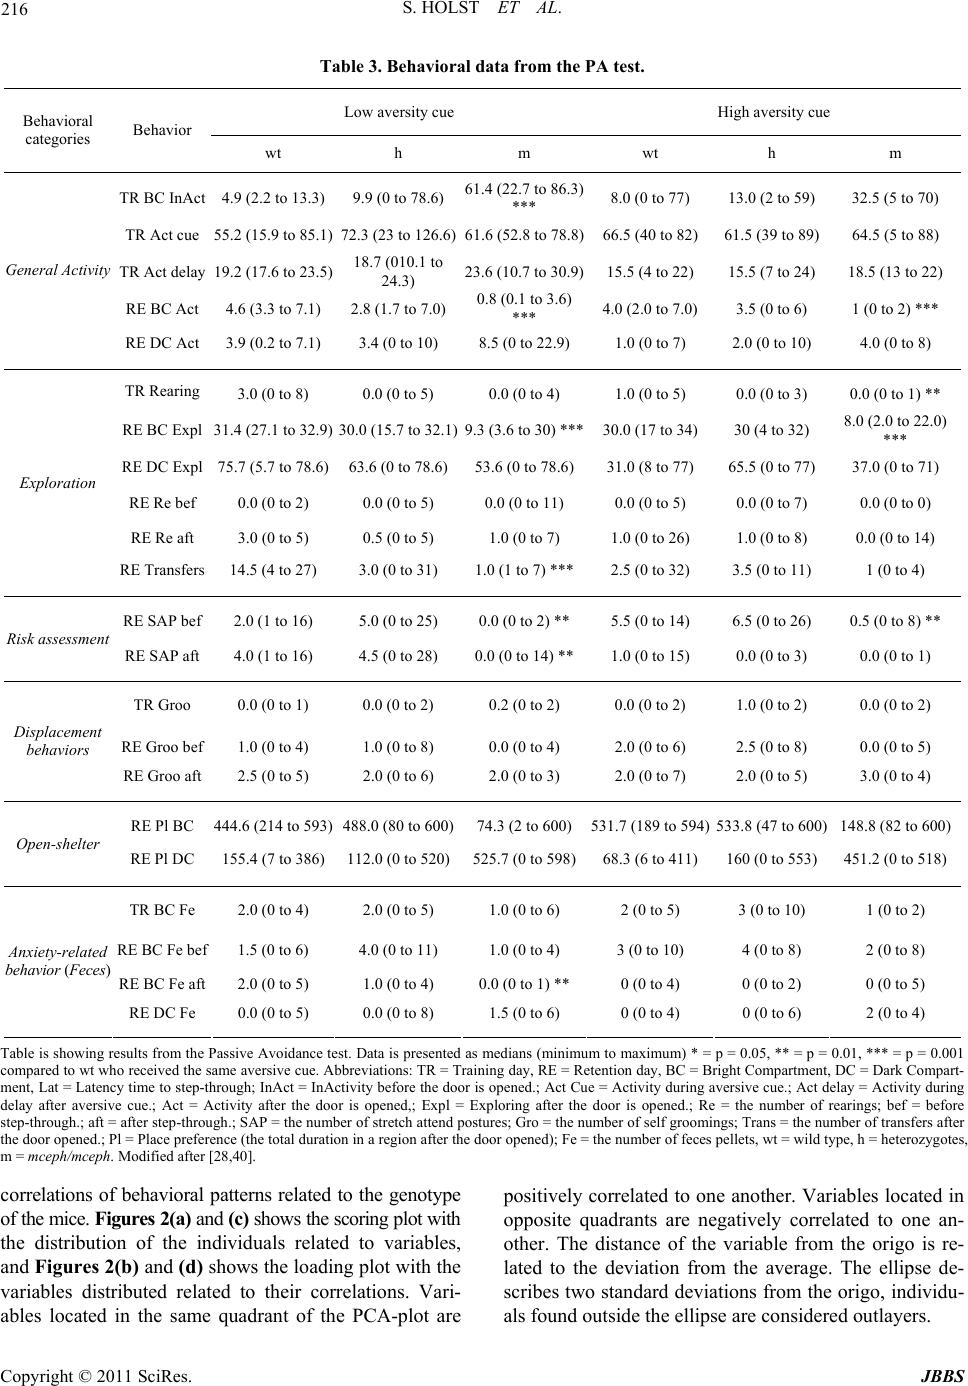 S. HOLST ET AL. 216 Table 3. Behavioral data from the PA test. Low aversity cue High aversity cue Behavioral categories Behavior wt h m wt h m TR BC InAct 4.9 (2.2 to 13.3 ) 9.9 (0 to 78.6) 61.4 (22.7 to 86.3) *** 8.0 (0 to 77) 13.0 (2 to 59) 32.5 (5 to 70) TR Act cue 55.2 (15.9 to 85.1) 72.3 (23 to 126.6)61.6 (52.8 to 78.8)66.5 (40 to 82)61.5 (39 to 89) 64.5 (5 to 88) TR Act delay 19.2 (17.6 to 23.5) 18.7 (010.1 to 24.3) 23.6 ( 10.7 to 30.9)15.5 (4 to 22) 15.5 (7 to 24) 18.5 (13 to 22) RE BC Act 4.6 (3.3 to 7.1) 2.8 (1.7 to 7.0)0.8 (0.1 to 3.6) *** 4.0 (2.0 to 7.0)3.5 (0 to 6) 1 (0 to 2) *** General Activity RE DC Act 3.9 (0.2 to 7.1) 3.4 (0 to 10) 8.5 (0 to 22.9) 1.0 (0 to 7) 2.0 (0 to 10) 4.0 (0 to 8) TR Rearing 3.0 (0 to 8) 0.0 (0 to 5) 0.0 (0 to 4) 1.0 (0 to 5) 0.0 (0 to 3) 0.0 (0 to 1) ** RE BC Expl 31.4 (27.1 to 32.9) 30.0 (15.7 to 32.1)9.3 (3.6 to 30) ***30.0 (17 to 34)30 (4 to 32) 8.0 (2.0 to 22.0) *** RE DC Expl 75.7 (5.7 to 78.6) 63.6 (0 to 78.6)53.6 (0 to 78.6)31.0 (8 to 77) 65.5 (0 to 77) 37.0 (0 to 71) RE Re bef 0.0 ( 0 t o 2 ) 0.0 (0 to 5) 0.0 (0 to 11) 0.0 (0 to 5) 0.0 (0 to 7) 0.0 (0 to 0) RE Re aft 3.0 (0 to 5) 0.5 (0 to 5) 1.0 (0 to 7) 1.0 (0 to 26) 1.0 (0 to 8) 0.0 (0 to 14) Exploration RE Transfers 14.5 (4 to 27) 3 .0 (0 to 31) 1.0 (1 to 7) ***2.5 (0 to 32) 3.5 (0 to 11) 1 (0 to 4) RE SAP bef 2.0 (1 to 16) 5.0 (0 to 25) 0.0 (0 to 2) ** 5.5 (0 to 14) 6.5 (0 to 26) 0.5 (0 to 8) ** Risk assessment RE SAP aft 4.0 (1 to 16) 4.5 (0 to 28) 0.0 (0 to 14) **1.0 (0 to 15) 0.0 (0 to 3) 0.0 (0 to 1) TR Groo 0.0 (0 to 1) 0 .0 (0 to 2) 0.2 (0 to 2) 0.0 (0 to 2) 1.0 (0 to 2) 0.0 ( 0 to 2) RE Groo bef 1.0 (0 to 4) 1.0 (0 to 8) 0.0 (0 to 4) 2.0 (0 to 6) 2.5 (0 to 8) 0.0 (0 to 5) Displacement behaviors RE Groo aft 2.5 ( 0 t o 5 ) 2.0 (0 to 6) 2.0 (0 to 3) 2.0 (0 to 7) 2.0 (0 to 5) 3.0 (0 to 4) RE Pl BC 444.6 (214 to 593) 488.0 (80 to 600)74.3 (2 to 600)531.7 (189 to 594)533.8 (47 to 600) 148.8 (82 to 600) Open-shelter RE Pl DC 155.4 (7 to 386) 112.0 (0 to 520 )525.7 (0 to 598)68.3 (6 to 411)160 (0 to 553) 451.2 (0 to 518) TR BC Fe 2.0 (0 to 4) 2.0 (0 to 5) 1.0 (0 to 6) 2 (0 to 5) 3 (0 to 10) 1 (0 to 2) RE BC Fe bef 1.5 (0 to 6) 4.0 (0 to 11) 1.0 (0 to 4) 3 (0 to 10) 4 (0 to 8) 2 (0 to 8) RE BC Fe aft 2.0 (0 to 5) 1.0 (0 to 4) 0.0 (0 to 1) ** 0 (0 to 4) 0 (0 to 2) 0 (0 to 5) Anxiety-related behavior (Feces) RE DC Fe 0.0 (0 t o 5) 0. 0 (0 to 8) 1.5 (0 to 6) 0 (0 to 4) 0 (0 to 6) 2 (0 to 4) Table is showing results from the Passive Avoidance test. Data is presented as medians (minimum to maximum) * = p = 0.05, ** = p = 0.01, *** = p = 0.001 compared to wt who receiv ed th e same av ersiv e cue. Abb revi ations : TR = Tra ining day, RE = R eten tion day, BC = Bright Compart ment, DC = Dark Co mpart- ment, Lat = Latency time to step-through; InAct = InActivity before the door is opened.; Act Cue = Activity during aversive cue.; Act delay = Activity during delay after aversive cue.; Act = Activity after the door is opened,; Expl = Exploring after the door is opened.; Re = the number of rearings; bef = before step-through.; aft = after step-through.; SAP = the number of stretch attend postures; Gro = the number of self groomings; Trans = the number of transfers after the door op ened.; Pl = Place p r ef erence (th e to t al duration in a r eg i on after the d oo r opened); Fe = t h e number of feces pellets, wt = wild type, h = heterozygotes, m = mceph/mcep h. Modified after [28,40]. correlations of behavioral patterns related to the genotype of the mice. Figures 2(a) and (c) shows the scoring plot with the distribution of the individuals related to variables, and Figures 2(b) and (d) shows the loading plot with the variables distributed related to their correlations. Vari- ables located in the same quadrant of the PCA-plot are positively correlated to one another. Variables located in opposite quadrants are negatively correlated to one an- other. The distance of the variable from the origo is re- lated to the deviation from the average. The ellipse de- scribes two standard deviations from the origo, individu- als found outside the ellipse are considered outlayers. Copyright © 2011 SciRes. JBBS 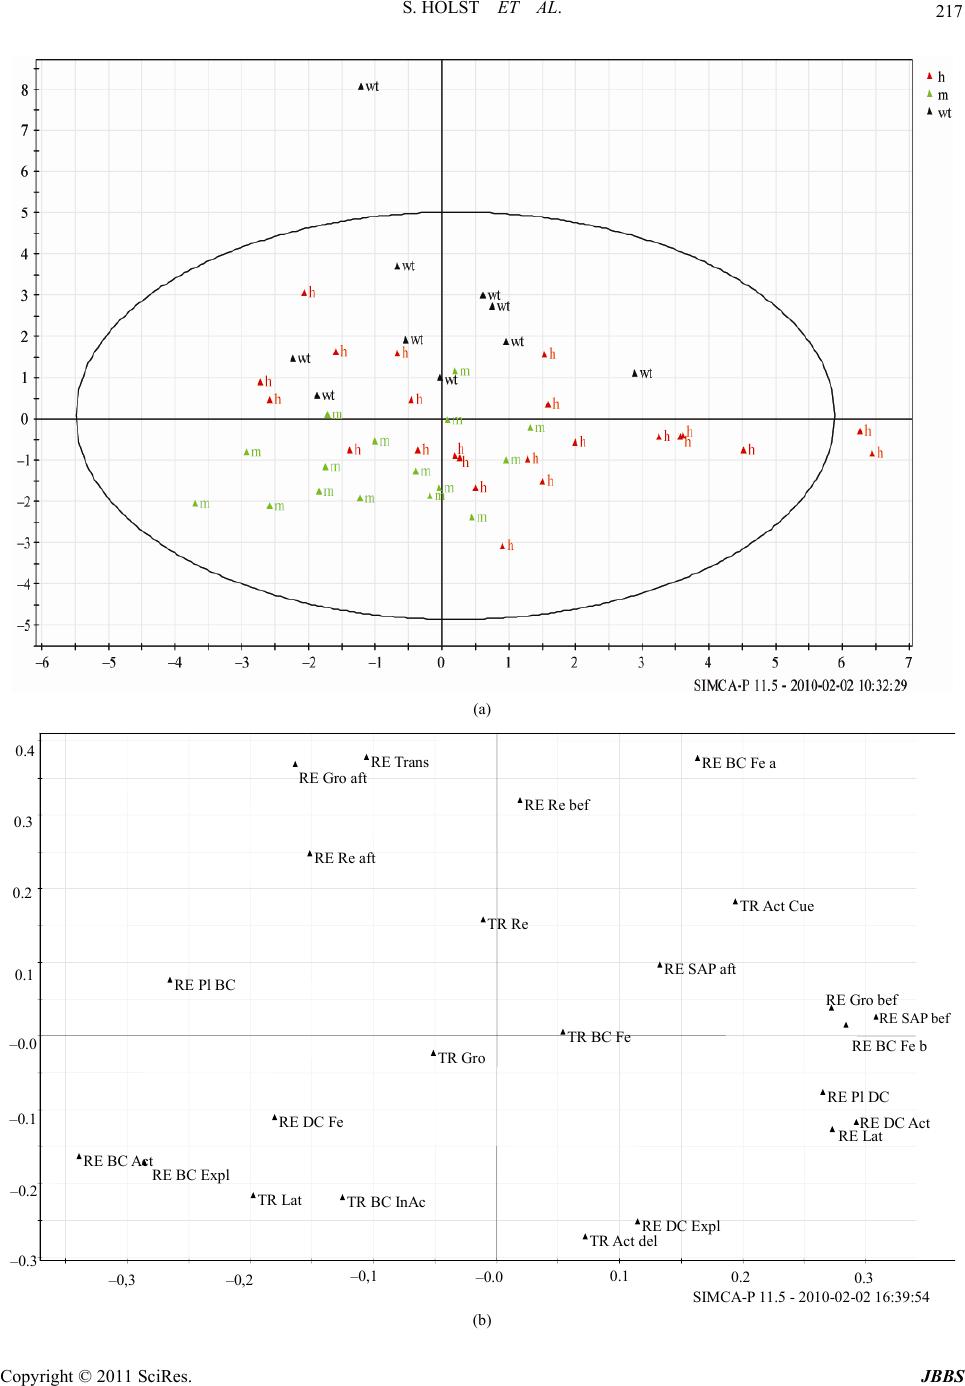 217 S. HOLST ET AL. (a) 0.3 0.2 0.1 0.0 0.1 0.2 0.3 0.4 0,3 0,2 0,1 0.0 0.1 0.2 0.3 TR La t RE La t TR BC InAc TR Act Cue TR Act del RE BC Act RE DC Act RE BC Expl RE DC Exp TR Re RE Re bef RE Re aft RE SAP bef RE SAP af TR Gro RE Gro bef RE Gro aft RE Tra ns RE Pl BC RE Pl DC TR BC FeRE BC Fe b RE BC Fe a RE DC Fe SIMC -P 11.5 - 2010-02-02 16:39:54 (b) Copyright © 2011 SciRes. JBBS 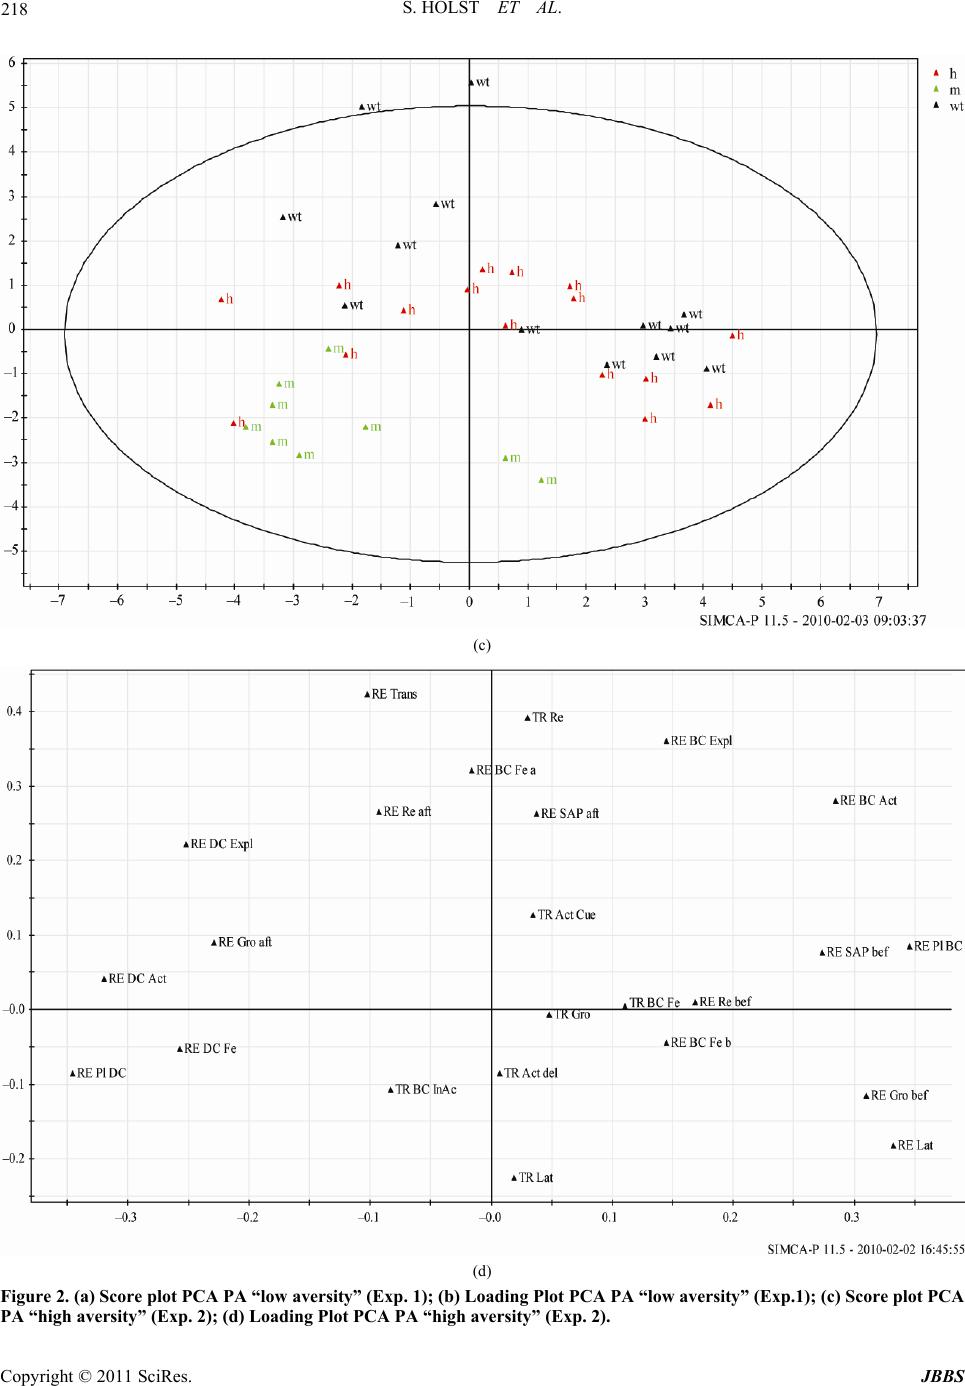 S. HOLST ET AL. 218 (c) (d) Figure 2. (a) Score plot PCA PA “low aversity” (Exp. 1); (b) Loading Plot PCA PA “low aversity” (Exp.1); (c) Score plot PCA PA “high aversity” (Exp. 2); (d) Loading Plot PCA PA “high aversity” (Exp. 2). Copyright © 2011 SciRes. JBBS  S. HOLST ET AL. Copyright © 2011 SciRes. JBBS 219 In Exp 1. “low aversity cue”, the genotypes did not form separate groups, although the location of the geno- types in the score plot were found in the same quadrants as in Exp 2. In the Exp. 2 “high aversity cue”, three main gr oups were outlined, the mceph/mceph mice in one group and two groups including both wild type and heterozygous mice. Both groups consisting of both wild type and het- erozygous mice co rresponded to a high frequency of risk assessments behaviors (RE SAP bef, RE SAP aft). The location of the mceph/mceph mice corresponded with a low or lack of risk assessment behaviors suggestive of a decreased defensive response to the aversive cue. One of the groups with both wild type and heterozy- gous mice was located in correspondence with a high retention latency time (RE Lat), situated far out to the right in the loading p lots in both trials. In both trials, risk assessment behaviors (RE SAP be), displacement beha- vior (RE Gro be) and anxiety-related behavior (RE BC Fe) were clustered with or located nearby RE Lat. Indi- viduals, more often heterozygous than wild type mice, with high retention latency also displayed behaviors re- lated w ith a reactive stress coping strategy. The other grou p with both wild type and heterozygous mice was instead located in correspondence with a high frequency of ex- ploratory behaviors (e g RE Tra) and risk assessment be- haviors relating to a proactive stress coping strategy (Fi- gure 2). In Exp 1, the two principal components explained 30% of the variance (R2X = 0.303; Q2X = –0.105 respectively) and in Exp. 2 it explained 47% of the variance (R2X = 0.469; Q2X = –0.172 respectively) (Figure 2) and values of explained variation and predicted variation were within an appropriate range. 3.2. Novel Cage Test In order to further analyse general exploratory behaviour in a non-aversive environment, the NCT was performed. Since the mceph/mceph mice showed changes of explo- ratory activity and risk-assessment behaviors in the PA task, more detailed behavioral data can be achieved in a neutral environment, compared to the short PA test per- formed in an aversive environment. 3.2.1. Behavior during NCT Both during 3 and 6 weeks of age, the mice started the test sessions by walking followed by investigating and subsequently they paused to groom. Mice of 3 weeks of age spent most of the recording time on general activity combined with risk assessment behaviors whereas mice of 6 weeks of age were more engaged in explorative be- haviors (Table 4; see Table 2 for ethogram). Within group comparison over age showed that the mceph/mceph mice decreased their risk assessment and exploratory behaviors from 3 weeks to 6 weeks, whereas the wild type and heterozygou s mice increased defensive behavior and general activity as well as decreased dis- placement behaviors (Table 4). Compared to the heterozygous and wild typ e mice, the mceph/mceph mice had lower explorative behavior at 3 weeks of age. At 6 weeks of age they also had lower ge- neral activity and defensive behavior. Unlike the results obtained in PA, risk assessment behaviour did not differ in relation to genotype, pro bably related to the non-aver- sive nature of the NC T (Table 4). 3.2.2. Comparison of the mceph/mceph, Heterozygous and Wild Type Mice in the NCT A PCA based on the NCT results presented in the Table 4 was used to identify relationships between the behav- ioral patterns and the genotype of the mice (see PCA for PA for further description of PCA). At 3 weeks of age there was no clear difference between the groups. How- ever, at 6 weeks of age, there was a trend that the mceph/- mceph mice formed a group that differed from the group including wild type and heterozygous mice. The indi- viduals of the groups with both wild type and heterozy- gous mice were located corresponding to a high frequen- cy of exploratory and risk assessments behaviors (e.g. 6DSAP 6FSAP, 6F wallrearing and 6F rearing). The lo- cation of the individuals of the mceph/mceph group cor- responded to a long latency time of several behaviors (e.g. 6L wallrearing, 6L investigating) and long duration or fr equency of seizures, freezing and motionless (e.g. 6D motionless, 6F freeze an 6D seizure). Also at 3 weeks of age these behaviors were located corresponding to the mceph/mceph mice group (Figures 3(a)-(d)). At 3 as well as of 6 weeks of age, the two principal components explained 58% of the variance (R2X = 0.579; Q2X = 0.067 and R2X = 0.581; Q2X = 0.365 at 3 and 6 weeks of age, respectively) (Figures 3(a)-(d)) and val- ues of explained variation and predicted variation were within an appropriate range. 3.3. Behavioral Comparison of mceph/mceph, Heterozygous and Wild Type Mice The difference in the PA and NCT in overlapping be- haviors is summarized in Tabl e 5. 3.4. Elevated Plus Maze (Exp. 2) Since most of the mceph/mceph mice developed seizures immediately when placed in the EPM, no relevant con- clusion of anxiety-related behavior could be obtained. However, the heterozygous and the wild type mice did not differ in the EPM (data not shown). 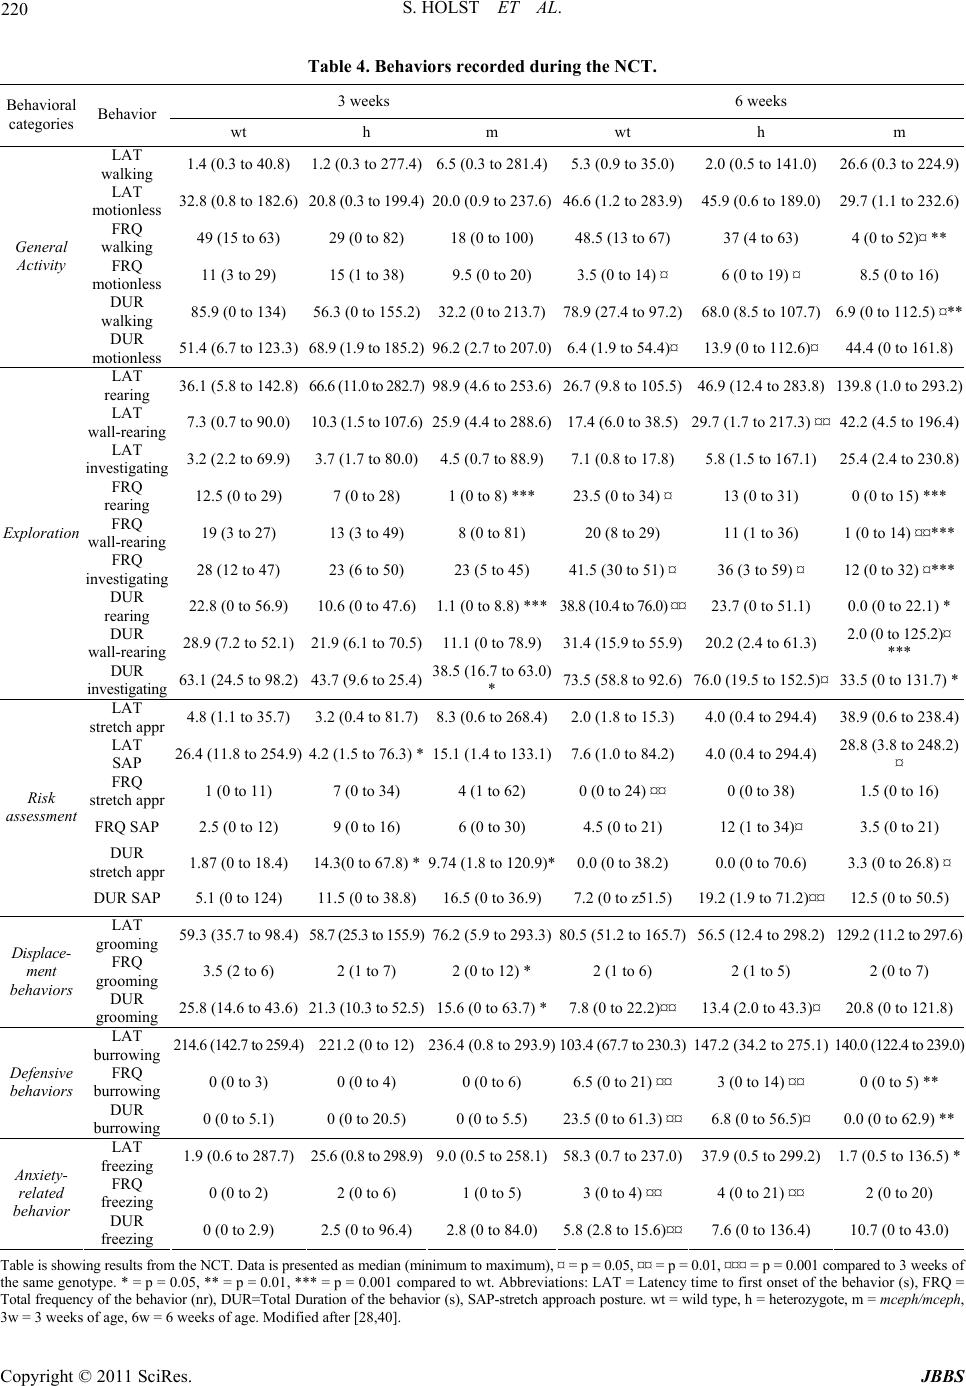 S. HOLST ET AL. 220 Table 4. Behaviors recorded during the NCT. 3 weeks 6 weeks Behavioral categories Behavior wt h m wt h m LAT walking 1.4 (0.3 to 40.8) 1.2 (0.3 to 277.4)6.5 (0.3 to 281.4)5.3 (0.9 to 35.0)2.0 (0.5 to 141.0) 26.6 (0.3 to 224.9) LAT motionless 32.8 (0.8 to 182.6) 20.8 (0.3 to 199.4)20.0 (0.9 to 237.6)46.6 (1.2 to 283.9)45.9 (0.6 to 189.0) 29.7 (1.1 to 232.6) FRQ walking 49 (15 to 63) 29 (0 to 82) 18 (0 to 100) 48.5 (13 to 67) 37 (4 to 63) 4 (0 to 52)¤ ** FRQ motionless 11 (3 to 29) 15 (1 to 38) 9.5 (0 to 20) 3.5 (0 to 14) ¤ 6 (0 to 19) ¤ 8.5 (0 to 16) DUR walking 85.9 (0 to 134) 56.3 (0 to 155.2)32.2 (0 to 213. 7)78.9 (27.4 to 97.2)68.0 (8.5 to 107.7) 6.9 (0 to 112.5) ¤** General Activity DUR motionless 51.4 (6.7 to 123.3) 68.9 (1.9 to 185.2)96.2 (2.7 to 207.0)6.4 (1.9 to 54.4)¤13.9 (0 to 112.6)¤ 44.4 (0 to 161. 8 ) LAT rearing 36.1 (5.8 to 142.8) 66.6 (11.0 to 282.7)98.9 (4.6 to 253.6)26.7 (9.8 to 105.5)46.9 ( 12.4 to 283.8) 139.8 (1.0 to 293.2) LAT wall-rearing 7.3 (0.7 to 90.0) 10.3 (1.5 to 107.6)25.9 (4.4 to 288.6)17.4 (6.0 to 38.5)29.7 (1.7 to 217.3) ¤¤ 42.2 (4.5 to 196.4) LAT investigating 3.2 (2.2 to 69.9) 3.7 (1.7 to 80.0)4.5 (0.7 to 88.9)7.1 (0.8 to 17.8)5.8 (1.5 to 167.1) 25.4 (2.4 to 230.8) FRQ rearing 12.5 (0 to 29) 7 (0 to 28) 1 (0 to 8) *** 23.5 (0 to 34) ¤13 (0 to 31) 0 (0 to 15) *** FRQ wall-rearing 19 (3 to 27) 13 (3 to 49) 8 (0 to 81) 20 (8 to 29) 11 (1 to 36) 1 (0 to 14) ¤¤*** FRQ investigating 28 (12 to 47) 23 (6 to 50) 23 (5 to 45) 41.5 (30 to 51) ¤36 (3 to 59) ¤ 12 (0 to 32) ¤*** DUR rearing 22.8 (0 to 56.9) 10.6 (0 to 47.6)1.1 ( 0 t o 8.8) ***38.8 (10.4 to 76.0) ¤¤23.7 (0 to 51.1) 0.0 (0 to 22.1) * DUR wall-rearing 28.9 (7.2 to 52.1) 21.9 (6.1 to 70.5)11.1 (0 to 78.9)31.4 (15.9 to 55.9)20.2 (2.4 to 61.3) 2.0 (0 to 125.2)¤ *** Exploration DUR investigating 63.1 (24.5 to 98.2) 43.7 (9.6 to 25.4)38.5 (16.7 to 63.0) * 73.5 (58. 8 to 92.6)76.0 (19.5 to 152.5)¤ 33.5 (0 to 131. 7) * LAT stretch appr 4.8 ( 1.1 to 35.7) 3.2 (0.4 to 81.7)8.3 (0.6 to 268.4)2.0 (1.8 to 15.3)4.0 (0.4 to 294.4) 38.9 (0.6 to 238.4) LAT SAP 26.4 (11.8 to 254.9) 4.2 (1.5 to 76. 3) *15.1 (1.4 to 133.1)7.6 (1.0 to 84.2)4.0 (0.4 to 294.4) 28.8 (3.8 to 248.2) ¤ FRQ stretch appr 1 (0 to 11) 7 (0 to 34) 4 (1 to 62) 0 (0 to 24) ¤¤ 0 (0 to 38) 1.5 (0 to 16) FRQ SAP 2.5 (0 to 12) 9 (0 to 16) 6 (0 to 30) 4.5 (0 to 21) 12 (1 to 34)¤ 3.5 (0 to 21) DUR stretch appr 1.87 (0 to 18.4) 14.3(0 to 67.8) *9.74 (1.8 to 120.9)*0.0 (0 to 38.2) 0.0 (0 to 70.6) 3.3 (0 to 26 .8) ¤ Risk assessment DUR SAP 5.1 (0 to 124) 11.5 (0 to 38.8)16.5 (0 to 36.9)7.2 (0 to z51.5) 19.2 (1.9 to 71.2)¤¤ 12.5 (0 to 50.5) LAT grooming 59.3 (35.7 to 98.4) 58.7 (25.3 to 155.9)76.2 (5.9 to 293.3)80.5 (51.2 to 165.7)56.5 (12.4 to 298.2) 129. 2 (11.2 to 2 97. 6) FRQ grooming 3.5 (2 to 6) 2 (1 to 7) 2 (0 to 12) * 2 (1 to 6) 2 (1 to 5) 2 (0 to 7) Displace- ment behaviors DUR grooming 25.8 (14.6 to 43.6) 21.3 (10. 3 to 52.5)15.6 (0 to 63.7) *7.8 (0 to 22.2)¤¤13.4 (2.0 to 43.3) ¤ 20.8 (0 to 121.8) LAT burrowing 214.6 (142.7 to 259. 4) 221.2 (0 to 12)236.4 (0.8 to 293.9)103.4 (67.7 to 230.3)147.2 (34.2 to 275.1) 140.0 (122.4 to 239.0) FRQ burrowing 0 (0 to 3) 0 (0 to 4) 0 (0 to 6) 6.5 (0 to 21) ¤¤3 (0 to 14) ¤¤ 0 (0 to 5) ** Defensive behaviors DUR burrowing 0 (0 to 5.1) 0 (0 to 20.5) 0 (0 to 5.5) 23.5 (0 to 61.3) ¤¤6.8 (0 to 56.5)¤ 0.0 (0 to 62.9) ** LAT freezing 1.9 ( 0.6 to 287.7) 25.6 (0.8 to 298.9)9.0 (0.5 to 258.1)58.3 (0.7 to 237.0)37.9 (0.5 to 299.2) 1.7 (0.5 to 136.5) * FRQ freezing 0 (0 to 2) 2 (0 to 6) 1 (0 to 5) 3 (0 to 4) ¤¤ 4 (0 to 21) ¤¤ 2 (0 to 20) Anxiety- related behavior DUR freezing 0 (0 to 2.9) 2.5 (0 to 96.4)2.8 (0 to 84.0) 5.8 (2.8 to 15.6)¤¤7.6 (0 to 136.4) 10.7 (0 to 43.0) Table is showing results from the NCT. Data is pr esented as median (minimum to maximum), ¤ = p = 0.05, ¤¤ = p = 0.01, ¤¤¤ = p = 0.001 compared to 3 weeks of the same genotype. * = p = 0.05, ** = p = 0.01, *** = p = 0.001 compared to wt. Abbreviations: LAT = Latency time to first onset of the behavior (s), FRQ = Total frequency of the behavior (nr), DUR=Total Duration of the behavior (s), SAP-stretch approach posture. wt = wild type, h = heterozygote, m = mceph/mceph, 3w = 3 weeks of age, 6w = 6 weeks of age. Modified after [28,40]. Copyright © 2011 SciRes. JBBS  221 S. HOLST ET AL. (a) (b) Copyright © 2011 SciRes. JBBS  S. HOLST ET AL. 222 (c) (d) Figure 3. (a) Score plot PCA NCT 3 weeks of age; (b) Loading Plot PCA NCT 3 weeks of age; (c) Score plot PCA NCT 6 weeks of age; (d) Loading Plot PCA NCT 6 weeks of age. Copyright © 2011 SciRes. JBBS  S. HOLST ET AL. Copyright © 2011 SciRes. JBBS 223 Table 5. Summary of behavioral differences between geno- types in the PA and NCT. Test Behavioral categories m wt h? wt h? PA General Activity m < h wt - NCT m < h wt - PA Exploratoration m < h wt wt h NCT m < h wt - PA Risk assessment m < h wt - NCT - wt < h PA Displacement behaviors - - NCT m < wt - PA Defensive behaviors n m n m NCT m < h wt - PA Open-shelter n m n m NCT m <h - PA Anxiety-related behavior m < h - NCT - - Table is showing differences recorded from the PA and NCT. Arrows indi- cate the direction of the difference. Abbreviations: NCT = Novel Cage, PA=Passive Avoidance, n m = not measured, wt = wild type, h = heterozy- gotes, m = mceph/mceph. Modified after [28,40]. 3.5. Open Field (Exp. 2) The wild type mice visited the central region significant- ly (p = 0.022) more than the mceph/mceph mice, and ten- dened to have more visits than the heterozygous mice (p = 0.069) (wild type: 59.9 ± 16.1; heterozygotes: 27.73 ± 8.6; mceph/mceph: 17.40 ± 10.1; one way ANOVA F2,26 = 3.40 p = 0.049). The distance travelled latency to the first visit and duration at each location did not differ sig- nificantly due to genotype (data not shown). 3.6. Additional Phenotypical Characterisation (Exp. 1) 3.6.1 Seizures Unlike the wild type or heterozygous mice the mceph/ mceph mice had seizures at 3 weeks or 6 weeks. At 3 weeks of age, the latency to first seizure was 32.6 (me- dian, min: 5.4, max: 176.5) s and at 6 weeks it was 8.82 (median, min: 0.47, max: 101) s. At 3 weeks of age, the number of seizures was 0 (median, min: 0, max: 7) and at 6 weeks 1 (median, min: 0, max: 101). At 3 weeks of age, duration of seizures was 0 (median, min: 0, max: 76.6) s and at 6 weeks 81.8 (median, min: 0, max: 292.5) s. The seizures were mostly mild, in a typical seizure the hind legs of the mceph/mceph mouse cramped and were stret- ched out behind the body combined with the body shak- ing. Except for one mouse, all the mice remained conscious during the seizures. The first minutes after the seizure passed some mice walked or run very quickly. However, most of the mice sat still or groomed for some minutes after the seizure whereupon they continued with the pre- vious be hav ioral repe rt o i r e. 3.6.2. Phenot y pi cal Characterisati o n There was no significant difference between heterozygous and wild type mice in body weight, number of individu- als with teary eyes or number of vocalisations per indi- vidual, neither at 3 weeks nor at 6 weeks of age (Table 6). However, compared to heterozygous and wild type mice the mceph/mceph mice had significantly lower body weight at 3 weeks (Table 6, one-way ANOVA F2,46= 12.44 p < 0.001) and 6 week s (Ta ble 6, on e-way ANOV A F2,46 = 14.60 p < 0.001) of age, significantly higher number of individuals with teary eyes at 3 weeks (Table 6, H (2, N = 49) = 18.30 p < 0.001) and at 6 weeks (Table 6, H (2, N = 49) = 39.60 p < 0.001) and significantly lower num- ber of vocalisations per individual at 3 weeks (Table 6, H (2, N = 49) = 24.63 p < 0.001) but not at 6 weeks (Table 6, H (2, N = 49) = 2.15 p = 0.34) (Table 6). 3.6.3. Rotarod (Ex p. 3) There was no significant difference in accelerating Ro- tarod performance between mceph/mceph and heterozy- gous mice neither in set 1 (mceph/mceph, n = 4; mean ± SEM: 88.5 ± 9.3 and heterozygo tes, n = 8; 104.8 ± 10.2 s; p = 0.27) nor in set 2 (mceph/mceph, n = 6; mean ± SEM: 74.3 ± 10.7 and heterozygotes, n = 10; 99.1 ± 8.9 s; p = 0.10) indicating that motor performance did not differ in mceph/mceph mice in contrast to the alterations of Table 6. Phenotypical characterisation at 3 and 6 weeks. 3 weeks 6 weeks Phenotypical characterisation wt h m wt h m Body Weight (g) 10.6 0.47 9.9 0.26 8.2 0.34***20 .3 0.68 18.7 0.50 1 5.7 0.55*** Teary eyes (nr/total nr) 1/10 1/23 10/16** 0/10 0/23 14/16*** Vocalisation (x/individual) 2.00 0.00 1.78 0.09 1.13 0.09***1.10 0.10 1.13 0.07 1.00 0.00 Table is sh owing pheno typical chara cterisation measured after Novel Cage t est. Data is presented as means SEM or n r of individu als/total n r of individu als. wt = wild type, h = heterozygotes, m = mceph/mceph, ** = p = 0.01, *** = p = 0.001 com p ared to mceph/mceph.  S. HOLST ET AL. 224 sp ont a neo u s mo tor activity these mice d isp la y in o ther te st (see above). 3.7. Stereology (Exp. 4) There was no significant difference in the number of NeuN- positive neurons in the hippoca mpus of the wild type and heterozygous mice (wild type: 102 736.35 15089.9; heterozygotes: 108 493.55 22479.3; one-way ANOVA F1,14 = 0.045 p = 0.83). The number of NeuN-positive neu- rons in the hippocampus of the mceph/mceph has been reported previously and was found to be increased (see introduction). 4. Discussion The aim of the present study was to analyse the effects of genetically induced potassium-ionchannelopathy on be- havior and hippocampal co gnitive function. The BALB/- cByJ-Kv1.1 mceph/mceph with a germline complete lack of functional Kv1.1, displaying chronic TLE without appa- rent neurodegeneration, showed impaired memory in the PA task. The mceph/mceph mice did not show a learn- ing-induced increase in step-through latency into the dark compartment at the retention test compared to training. In contrast, in wild type and heterozygous, Kv1.1 mceph/+ mice, the step-through latency time was significantly in- creased at retention compa red to training, indicative of suc- cessful learning to avoid the aversive context. To further st rengthen the analysis, th e behavioral data r ecorded during the PA was subjected to multivariate analysis. This ana- lysis indicated that the mceph/mceph mice displayed a lower frequency of risk assessment behaviors compared to wild type and heterozygo us mice. In th e NCT the mceph/mceph mice were characterised by a low general activity and exploratory behavior at 3 weeks of age and from 6 weeks of age also low defensive behavior. Although the mceph/mceph mice had mild seizures, their motor coordination was not affected. The heterozygous mice showed indications of lower explor- ative behaviors and higher risk assessment behaviors compared to wild type mice in the PA. The mceph/mceph mice have been shown to have an excessive number of NeuN-immunoreactive neurons in the hippocampus. How- ever, the number of NeuN-immunoreactive cells in the DG of the heterozygous mice did not differ from the wild type mice, considered with or unchanged hippocampal vo- lume [14]. Compared to wild type and heterozygous mice the mceph/mceph mice had a low frequency of the risk as- sessment behavior SAPs in the PA test, unlike results obtained in the non-aversive NCT test. SAP is interpreted as the intention of the mouse to assess the environment in a safe manner, motivated by a state of fear. The mceph/ - mceph mice did not display displacement behaviors (groom- ing) before step-through and they did not transfer back to the bright compartment of the PA apparatus. Instead the mceph/mceph mice spent more time in the dark compart- ment, which they explored, probably due to a lack of fear. This suggests that the mceph/mceph mice prefer the dark compartment despite the aversive cue received there 24 h earlier. Moreover, the activity of the mceph/mceph mice in response to the aversive cue as well as during the 60s delay in the dark compartment after the aversive cue, was either increased or not differed from the activity of wild type and heterozygous mice, indicating unaltered response to the aversive stimulus. Therefore, the failure to learn the PA memory task appears no t to be a result of altered pain perception, but related to impaired memory retention of the aversive context. Human TLE patients suffer from impaired memory function [41-42] as well as rodents with spontaneous or provoked epilepsy [17-19]. The behavioral phenotype of the mceph/mceph mice may reflect a dysfunction in hip- pocampal excitability. Recent electrophysiological stud- ies in the mceph/mceph hippocampus (Fisahn et al., sub- mitted), indicate disturbances in gamma oscillations, i.e. synchronous activity in the gamma frequency-range that depends directly on network excitability. Gamma oscil- lations play an important role in higher processes in the brain such as learning, memory, cognition and perception [44,45]. This abnormal network excitability may in part result from the excessive adult-borne hippocampal neu- rons in mceph/mceph. Seizure-induced new neurons are reported to be less excitable and aberrant in their po larity, migration and integration pattern compared to non-sei- zure-induced adult-born neurons, although stably integrated into the hippocampal circuitry within 24 h to weeks [46-48], in contrast to neurogenesis induced by running and/or enriched environment [49]. Both the wild type and the heterozygous mice increased their step-through latencies at retention compared to train- ing. However, both groups displayed a large variation of the step-though latency. The ethological study revealed that both groups displayed risk assessment behaviors reflect- ing the remembrance of the earlier presented aversive cue. The large variation of the step-through latency is m ost likely a result of different stress coping strategies to the aversive cue. Individuals with short step-through latency often had a high frequency of exploratory behaviors, in- cluding transfers inbetween the compartments, suggest- ing a proactive coping style. In contrast, individuals with long step-through latency often had a higher frequency of anxiety-related behaviors, suggesting a reactive coping style. Stress coping strategies are related to the fight-and- flight responses. A reactive coping strategy is associated Copyright © 2011 SciRes. JBBS  225 S. HOLST ET AL. with an increased immobility and freezing in order to at- tempt playing dead or outwait stressful stimulus. A pro- active coping strategy is associated either with an assess- men t of the r isk to inves tigat e th e environ men t by expo sing defensive behaviors such as exploring, rearing and SAP, or with aggressive and aversive behaviors [50]. This in- dicates that also mice with shorter step-through latencies at retention may have acquired the PA task with succes- sful memory consolidation, implying the importance of combining the step-through latency measure with etholo- gically based measures when examining emotional mem- ory functions. In the NCT exploratory and defensive behavior as well as general activity was low in the mceph/mceph mice. Explorative behaviour refers to activities aiming at increas- ing the knowledge of the surrounding environment for sa- fety assessment, e.g. rearing, sniffing and ambulation. Also mice with seizures provoked by a hippocampal pilocar- pine injection reduced their explorative behavior such as rearing in the OF and frequency of transfer measured in li g h t-dark box [18,19,51]. The mceph/mc eph mice had long periods of grooming, rather than short bouts. This may be interpreted as cleaning of the body, in con trast to short bouts that is associated with displacement behavior [52], which may indicate fear and is displayed when the ani- mal is in conflict of what behavior to display. Th e lack of displacement behavior in the mceph/mceph mice may indicate low stress levels related to the con text of the be- havioral tests. Although the mceph/mceph displayed lower levels of stress related behaviors, they had an increased frequency of freezing, which probably is related to low- ering of subthresholds for seizures provoked by light ex- posure. Also mice with seizures provoked by a hippocampal pilocarpine injection have increased scores of freezing [51]. The general activity of the mceph/mceph mice was low compared to wild type and heterozygous mice also when behavioral scoring was adjusted for reoccurring sei- zures. In contrast, in the OF illuminated with a red light bulb, general activity of the mceph/mceph mice did not differ from heterozygous and wild type mice. Exposure to the light may have provoked seizures in the mceph/- mceph mice that disturbed the perception or processing of the contextual stimuli and their coping to the aversive cue in the PA task. This probably also explains the be- havioral phenotype of the mceph/mceph mice including impaired memory, which seems to reflect several of the behavioral and cognitive distur bances associated with epi- lepsy in humans. 5. Conclusions In this study, the mceph/mceph mouse model for epilepsy with potassium channelopathy was assessed for hippo- campal-dependent emotional memory function in the PA task combined with a detailed behavioral analysis, per- formed both in the aversive context (PA) and in a neutral environment (NCT). In contrast to wild-type and hetero- zygous mice, the mceph/mceph mice fa iled to acquire avoi- dance of the environment associated with contextual fear in the PA retention test. Thus, the mceph/mceph mice displayed unchanged step-through latency at retention compared to training as well as low exploration and risk- assessment behaviors. The multivariate an alysis indicates that alterations of exploration and risk-assessment beha- viors are key variables for analysing deficits in memory pr ocessing. Also, in the NCT the mceph/mceph mice were characterised by a pattern of explorative, locomotor and risk assessment behaviors indicative of a blunted re- sponse to aversiv e stimuli. In conclusion, the results suggest that the mceph/mceph mice have a deficit in behavioural defensive responses to aversive stimuli probably as a result of impairments in emotional processing and memory. This suggests that th e mceph/mceph mice may be a relevant animal model for studying of limbic system mechanisms involved in emo- tional and cognitive pro blems related to epilepsy. 6. Acknowledgements We thank Professor Kristina Dahlborn for access to the Simpca + software (Umetrics), and Dr Elin Elvander- Tottie and Dr Eugenia Kutee va for valuable comments on the manuscript. This study was supported by The Swed- ish Research Council, Karolinska Institutet Foundations and Thuring Fo undations. 7. References [1] J. F. van Brederode, J. M. Rho, R. Cerne, B. L. Tempel and W. J. Spain, “Evidence of Altered Inhibition in Layer V Pyramidal Neurons from Neocortex of Kcna1-Null Mice,” Neuroscience, Vol. 103, No. 4, 2001, pp. 921-929. doi:10.1016/S0306-4522(01)00041-0 [2] V. Lopantsev, B. L. Tempel and P. A. Schwartzkroin, “Hyperex citability of CA3 Pyramidal Ce lls in Mice Lack - Ing the Potassium Channel Subunit Kv1.1,” Epilepsia, Vol. 44, No. 12, 2003, pp. 1506-1512. doi:10.1111/j.0013-9580.2003.44602.x [3] H. M. Brew, J. L. Hallows and B. L.Tempel, “Hyperex- citability and Reduced Low Threshold Potassium Cur- rents in Auditory Neurons of Mice Lacking the Channel Subunit Kv1.1,” Journal of Physiology, Vol. 548, 2003, pp. 1-20. doi:10.1113/jphysiol.2002.035568 [4] S. M. Zuberi, L. H. Eunson, A. Spauschus, R. De Silva, J. Tolmie, N. W. Wood, R. C. McWilliam, J. B. Stephenson, D. M. Kullma nn and M. G. Hanna, “A Novel Mutation in the Human Voltage -Gated Pota ssium Channel Gene (Kv1.1) Associates with Episodic Ataxia Type 1 and Sometimes Copyright © 2011 SciRes. JBBS  S. HOLST ET AL. 226 with Partial Epilepsy,” Brain, Vol. 122, No. 5, 1999, pp. 817- 825. doi:10.1093/brain/122.5.817 [5] L. H. Eunson, R. Rea, S. M. Zuberi, S. Youroukos, C. P. Panayiotopoulos and R. Liguori, “Clinical, Genetic, and Expression Studies of Mutations in the Potassium Chan- nel Gene KCNA1 Reveal New Phenotypic Variability,” Annals of Neurology, Vol. 48, No. 4, 2000, pp. 647-656. doi:10.1002/1531-8249(200010)48:4<647::AID-ANA12 >3.0.CO;2-Q [6] A. S. Persson, G. Klement, M. Almgren, K. Sahlholm, J. Nilsson, S. Petersson, P. Århem, M. Sc halling a nd C. Lave- bratt, “A Truncated Kv1.1 Protein in the Brain of the Megencephaly Mouse: Expression and Interaction,” BMC Neuroscience, Vol. 6, 2005, p. 65. doi:10.1186/1471-2202-6-65 [7] S. Petersson, A.S. Persson, J. Johansen, M. Ingvar, M. Schalling and C. Lavebratt, “Truncation of the Shaker- Like Voltage-Gated Potassium Channel, Kv1.1, Causes Megencephaly,” European Journal of Neuroscience, Vol. 18, No. 12, 2003, pp. 3231-3240. doi:10.1111/j.1460-9568.2003.03044.x [8] S. L. Smart, V. Lopantsev, C. L. Zhang, C. A. Robbins, H. Wang, S. Y. Chiu, P. A. Schwartzkroin, A. Messing and B. L. Tempel, “Deletion of the Kv1.1 Potassium Channel Causes Epilepsy in Mice,” Neuron, Vol. 20, No. 4, 1998, pp. 809-819. doi:10.1016/S0896-6273(00)81018-1 [9] A. Gambardella, A. Labate, A. Giallonardo and U. Agug- lia, “Familial Mesial Temporal Lobe Epilepsies: Clinical and Genetic Features,” Epilepsia, Vol. 50, Suppl. 5, 2009, pp. 55-57. doi:10.1111/j.1528-1167.2009.02123.x [10] S. Jessberger, B. Römer, H. Babu and G. Kempermann, “Seizures Induce Proliferation and Dispersion of Dou- blecortin-Positive Hippocampal Progenitor Cells,” Ex- perimental Neurology, Vol. 196, No. 2, 2005, pp. 342- 351. doi:10.1016/j.expneurol.2005.08.010 [11] S. Petersson, C. Lavebratt, M. Schalling and T. Hökfelt, “Expression of Cholecystokinin, Enkephalin, Galanin and Neuropeptide Y Is Markedly Changed in the Brain of the Megencephaly Mouse,” Neuroscience, Vol. 100, No. 29, 2000, pp. 297-317. doi:10.1016/S0306-4522(00)00285-2 [12] M. Diez, P. Schweinhardt, S. Petersson, F.-H. Wang, C. Lavebratt, M. Schalling, M., T. Hökfelt and C. Spenger, “MRI and in Situ Hybridization Reveal Early Distur- bances in C erebral Size and Gene Ex pression in the Mege n- cephalic (mceph/mceph) Mouse,” European Journal of Neuroscience, Vol. 18, No. 12, 2003, pp. 3218-3230. doi:10.1111/j.1460-9568.2003.02994.x [13] A. S. Persson, E. Westman, F.-H. Wang, F. H. Khan, C. Spenger and C. Lavebratt, “Kv1.1 Null Mice Have En- larged Hippocampus and Ventral Cortex,” BMC Neuro- science, Vol. 8, 2007, p. 10. doi:10.1186/1471-2202-8-10 [14] M. Almgren, A. S. Persson, C. Fenghua, B. M. Witgen, M. Schalling, J. R. Nyengaard and C. Lavebratt, “Lack of Potassium Channel Induces Proliferation and Survival Causing Increased Neurogenesis and Two-Fold Hippo- ca mp u s E nla r ge m ent,” Hippoca mpus, Vol. 17, No. 4, 2007, pp. 292-304. doi:10.1002/hipo.20268 [15] M. Almgren, M. Schalling and C. Lavebratt, “Idiopathic Megalencephaly-Possible Cause and Treatment Opportu- nities: From Patient to Lab,” European Journal of Paedi- atric Neurology, Vol. 1, No. 26, 2008, pp. 438-445. doi:10.1016/j.ejpn.2007.11.008 [16] E. D. Burg, C. V. Remillard and J. X. Yuan, “K + Chan- nels in Apoptosis,” The Journal of Membrane Biology, Vol. 209, No. 1, 2006, pp. 3-20. doi:10.1007/s00232-005-0838-4 [17] M. Lynch, U. Sayin, J. Bownds, S. Janumpalli and T. Sutula, “Long-Term Consequences of Early Postnatal Seizures on Hippocampal Learning and Plasticity,” Euro- pean Journal of Neuroscience, Vol. 12, No. 7, 2000, pp. 2252-2264. doi:10.1046/j.1460-9568.2000.00117.x [18] C. J. Müller, I. Gröticke, M. Bankstahl and W. Löscher, “Behavioral and Cognitive Alterations, Spontaneous Sei- zur e s, and Neuropatholo gy Developing after a Pilocarpine- Induced Status Epilepticus in C57BL/6 Mice,” Experi- mental Neurology, Vol. 219, No. 1, 2009, pp. 284-297. doi:10.1016/j.expneurol.2009.05.035 [19] I. Gröticke, K. Hoffmann and W. Löscher, “Behavioral Alterations in a Mouse Model of Temporal Lobe Epi- lepsy in Mice Induced by Intrahippocampal Injection of Kainite,” Experimental Neurology, Vol. 213, No. 1, 2008, pp. 71-83. doi:10.1016/j.expneurol.2008.04.036 [20] M. Cãrreno, A. Donaire and R. Sánchez-Carpintero, “Cognitive Disorders Associated with Epilepsy: Diagno- sis and Treatment,” Neurologist, Vol. 14, No. 6, 2008, pp. S26-S34. doi:10.1097/01.nrl.0000340789.15295.8f [21] J. E. LeDoux, “Emotional Me mory Systems in the Brain,” Behavioural Brain Research, Vol. 58, No. 1-2, 1993, pp. 69-79. doi:10.1016/0166-4328(93)90091-4 [22] R. G. Morris, “Developments of a Water-Maze Procedure for Studying Spatial Learning in the Rat,” Journal of Neu roscience Methods, Vol. 11, No. 1, 1984, pp. 47-60. doi:10.1016/0165-0270(84)90007-4 [23] B. Milner, L. R. Squire and E. R. Kandel, “Cognitive Neuroscience and the Study of Memory,” Neuron, Vol. 20, N o. 3 , 1998, pp. 445-468. doi:10.1016/S0896-6273(00)80987-3 [24] S. O. Ögren, T. M. Eriksson, E. Elvander-Tottie, C. D’Ad- dario, J. C. Ekström, P. Svenningsson, B. Meister, J. Kehr and O. Stiedl, “The Role of 5-HT(1A) Receptors in Learning and Memory,” Behavioural Brain Research, Vol. 195, No. 1, 2008, pp. 54-77. doi:10.1016/j.bbr.2008.02.023 [25] B. P. Hermann, J. J. Lin, J. E. Jones and M. Seidenberg, “The Emerging Architecture of Neuropsychological Im- pairment in Epilepsy,” Neurologic Clinics, Vol. 27, No. 4, 2009, pp. 881-907. doi:10.1016/j.ncl.2009.08.001 [26] C. Sgobio, V. Ghiglieri, C. Costa, V. Bagetta, S. Siliquini, I. Barone, M. Di Filippo, F. Gardoni, E. D. Gundelfinger, M. Di Luca, B. Picconi and P. Calabresi, “Hippocampal Synaptic Plasticity, Memory, and Epilepsy: Effects of Long-Term Valproic Acid Treatment,” Biological Psy- chiatry, Vol. 67, No. 6, 2010, pp. 567-574. Copyright © 2011 SciRes. JBBS  227 S. HOLST ET AL. doi:10.1016/j.biopsych.2009.11.008 [27] L. R. Donahue, S. A. Cook, K. R. Johnson, R. T. Bronson and M. T. Davisson, “Megencephaly: A New Mouse Mutation on Chromosome 6 That Causes Hypertrophy of the Brain,” Mammalian Genome, Vol. 7, No. 12, 1996, pp. 871-876. doi:10.1007/s003359900259 [28] H. Augustsson, K. Dahlborn and B. J. Meyerson, “Ex- ploration and Risk Assessment in Female Wild House Mice (Mus Musculus Musculus) and Two Laboratory Strains,” Physiology & Behavior, Vol. 84, No. 2, 2005, pp. 265-277. doi:10.1016/j.physbeh.2004.12.002 [29] P. J. Baarendse, G. van Grootheest, R. F. Jansen, A. W. Pieneman, S. O. Ögren, M. Verhage and O. Stiedl, “Dif- ferential Involvement of the Dorsal Hippocampus in Pas- sive Avoidance in C57bl/6J and DBA/2J Mice,” Hippo- campus, Vol. 18, No. 1, 2008,pp. 11-19. doi:10.1002/hipo.20356 [30] B. L. Finlay and R. B. Darlington, “Linked Regularities in the Development and Evolution of Mammalian Brains,” Science, Vol. 268, No. 5217, 1995, pp. 1578-1584. doi:10.1126/science.7777856 [31] N. Madjid, E. E. T ottie , M. Lüttge n, B. Meiste r, J. Sa ndin, A. Kuzmin, O. Stiedl, S. O. Ögren, “5-Hydroxytryptamine 1A Receptor Blockade Facilitates Aversive Learning in Mice: Interactions with Cholinergic and Glutamatergic Mechanisms,” The Journal of Pharmacology and Experi- mental Therapeutics, Vol. 316, No. 2, 2006, pp. 581-591. doi:10.1124/jpet.105.092262 [32] T. M. Eriksson, N. Madjid, E. Elvander-Tottie, O. Stiedl, P. Svenningsson and S. O. Ögren, “Blockade of 5-HT 1B Receptors Facilitates Contextual Aversive Learning in Mice by Disinhibition of Cholinergic and Glutamatergic Neurotrans-Mission,” Neuropharmacology, Vol. 54, No. 7, 2008, pp. 1041-1050. doi:10.1016/j.neuropharm.2008.02.007 [33] O. Stiedl, I. Misane, P. Tovote, A. Ronnenberg, J. Spiess and S. O. Ögren, “Involvement of NMDA Receptors in the Dorsal Hippocampus in Passive Avoidance Learning in Mice,” Society for Neuroscience Abstract, Vol. 773, 2004, p. 12. [34] J. M. Marque s, I. A. Olsson, S. O. Ögren an d K. Dahlborn, “Evaluation of Exploration and Risk Assessment in Pre- Weaning Mice Using the Novel Cage Test,” Physiology & Behavior, Vol. 93, No. 1-2, 2008, pp. 139-147. doi:10.1016/j.physbeh.2007.08.006 [35] E. B. Ottoni, “EthoLog 2.2: A Tool for the Transcription and Timing of Behavior Observation Sessions,” Behavior Research Methods, Instruments, & Computers, Vol. 32, No. 3, 2000, pp. 446-449. doi:10.3758/BF03200814 [36] K. Franklin and G. Paxinos, “The Mouse Brain in Stereo- Taxic Coordinates,” Academic Press, San Diego, 1997. [37] E. Åberg, C. P. Hofstetter, L. Olson and S. Brené, “Mod- erate Ethanol Consumption Increases Hippocampal Cell Proliferation and Neurogenesis in the Adult Mouse,” In- ternational Journal of Neuropsychopharmacology, Vol. 8 No. 4, 2005, pp. 557-567. doi:10.1017/S1461145705005286 [38] M. J. West and H. J. Gundersen, “Unbiased Stereological Estimation of the Number of Neurons in the Human Hippocampus,” Journal of Comparative Neurology, Vol. 296, No. 1, 1990, pp. 1-22. doi:10.1002/cne.902960102 [39] J. E. Jackson, “A User’s Guide to Principal Compo- nents,” John Wiley & Sons Inc, New York, 1991. doi:10.1002/0471725331 [40] E. Roman and G. Colombo, “Lower Risk Taking and Ex- Ploratory Behavior in Alcohol-Preferring sP Rats than in Alcohol Non-Preferring sNP Rats in the Multivariate Concentric Square Field (MCSF) Test,” Behavioural Brain Resea rc h , Vol. 205, No. 1, 2009, pp. 249-58. doi:10.1016/j.bbr.2009.08.020 [41] A. R. Giovagnoli and G. Avanzini, “Quality of Life and Memory Performance in Patients with Temporal Lobe EpilLepsy,” Acta Neurologica Scandinavica, Vol. 101, No. 5, 2000, pp. 295-300. doi:10.1034/j.1600-0404.2000.90257a.x [42] U. Hlobil, C. Rathore, A. Alexander, S. Sarma and K. Radhakrishnan, “Impaired Facial Emotion Recognition in Patients with Mesial Temporal Lobe Epilepsy Associated with Hippocampal Sclerosis (MTLE-HS): Side and Age at Onset Matters,” Epilepsy Research, Vol. 80, No. 2-3, 2008, pp. 150-157. [43] V. Tuchscherer, M. Seidenberg, D. Pulsipher, M. Lan- caster, L. Guidotti and B. Hermann, “Extrahippocampal Integrity in Temporal Lobe Epilepsy and Cognition: Th- alamus and Executive Functioning,” Epilepsy & Behav- iour, Vol. 17, No. 4, 2010, pp. 478-482. doi:10.1016/j.yebeh.2010.01.019 [44] C. M. Gray and W. Singer, “Stimulus-Specific Neuronal Oscillations in Orientation Columns of Cat Visual Cor- tex,” Proceedings of the National Academy of Sciences of the United States of America, Vol. 86, No. 5, 1989, pp. 1698-1702. [45] A. K. Engel and W. Singer, “Temporal Binding and the Neural Correlates of Sensory Awareness,” Trends in Co- gnitive Sciences, No. 5, No. 1, 2001, pp. 16-25. [46] K. Jakubs, A. Nanobashvili, S. Bonde, C. T. Ekdahl, Z. Kokaia, M. Kokaia and O. Lindvall, “Environment Mat- Ters: Synaptic Properties of Neurons Born in the Epilep- tic Adult Brain Develop to Reduce Excitability,” Neuron, Vol. 52, No. 6, 2006, pp. 1047-1059. doi:10.1016/j.neuron.2006.11.004 [47] L. S. Ove rstreet-Wa diche, D. A. Bromberg, A. L. Bensen and G. L. Westbrook, “Seizures Accelerate Functional In- Tegration of Adult-Generated Granule Cells,” The Jour- nal of Neuroscience, Vol. 26, No. 15, 2006, pp. 4095- 4103. doi:10.1523/JNEUROSCI.5508-05.2006 [48] S. Jessberger, C. Zhao, N. Toni, G. D. Clemenson, Y. Li, and F. H. Gage, “Seizure-Associated, Aberrant Neuro- genesis in Adult Rats Characterized with Retrovirus-Me- diated Cell Labelling,” The Journal of Neuroscience, Vol. 29, No. 35, 2007, pp. 9400-9407. [49] B. Steiner, S. Zurborg, H. Hörster, K. Fabel and G. Kem- permann, “Differential 24 h Responsiveness of Prox1-Ex- pressing Precursor Cells in Adult Hippocampal Neuro- genesis to Physical Activity, Environmental Enrichment, Copyright © 2011 SciRes. JBBS  S. HOLST ET AL. Copyright © 2011 SciRes. JBBS 228 and Kainic Acid-Induced Seizures,” Neuroscience, Vol. 154, No. 2, 2008, pp. 521-529. doi:10.1016/j.neuroscience.2008.04.023 [50] J. M. Koolhaas, S. F. de Boer, B. Buwalda and K. van Re- enen, “Individual Variation in Coping with Stress: A Multi-Dimensional Approach of Ultimate and Proximate Mechanisms,” Brain, Behavior and Evolution, Vol. 70, No. 4, 2007, pp. 218-226. doi:10.1159/000105485 [51] I. Gröticke, K. Hoffmann and W. Löscher, “Behavioral Alterations in the Pilocarpine Model of Temporal Lobe Epilepsy in Mice,” Experimental Neurology, Vol. 207, No. 2, 2007, pp. 329-349. doi:10.1016/j.expneurol.2007.06.021 [52] B. M. Spruijt, J. A. van Hooff and W. H. Gispen, ”Ethol- ogy and Neurobiology of Grooming Behaviour,” Physio- logical Reviews, Vol. 72, No. 3, 1992, pp. 825-852.
|