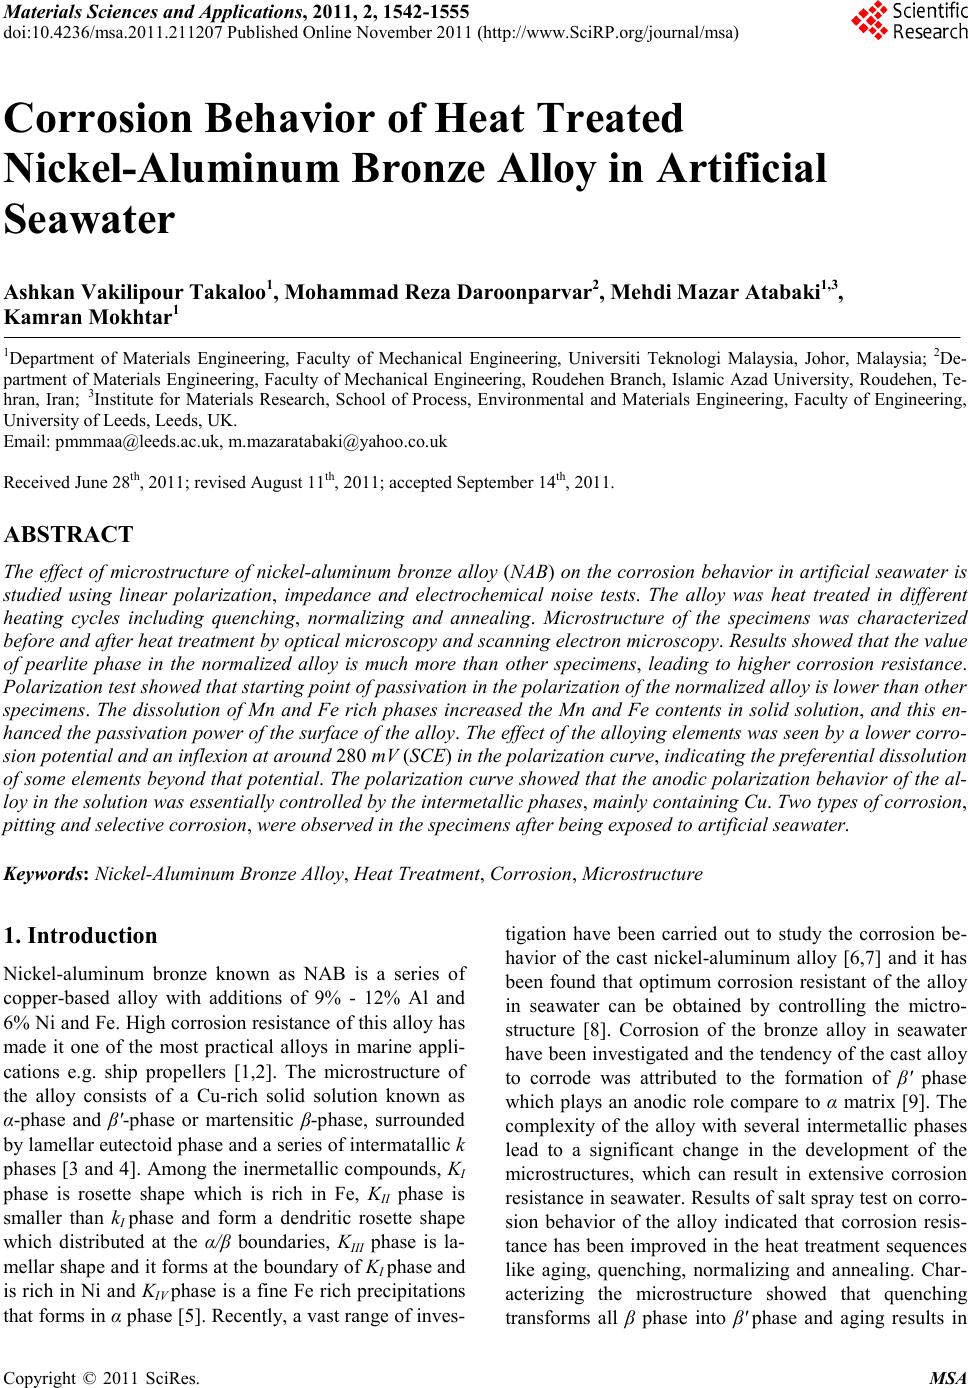
 Materials Science s a nd Applications, 2011, 2, 1542-1555 doi:10.4236/msa.2011.211207 Published Online November 2011 (http://www.SciRP.org/journal/msa) Copyright © 2011 SciRes. MSA Corrosion Behavior of Heat Treated Nickel-Aluminum Bronze Alloy in Artificial Seawater Ashkan Vakilipour Takaloo1, Mohammad Reza Daroonparvar2, Mehdi Mazar Atabaki1,3, Kamran Mokhtar1 1Department of Materials Engineering, Faculty of Mechanical Engineering, Universiti Teknologi Malaysia, Johor, Malaysia; 2De- partment of Materials Engineering, Faculty of Mechanical Engineering, Roudehen Branch, Islamic Azad University, Roudehen, Te- hran, Iran; 3Institute for Materials Research, School of Process, Environmental and Materials Engineering, Faculty of Engineering, University of Leeds, Leeds, UK. Email: pmmmaa@leeds.ac.uk, m.mazaratabaki@yahoo.co.uk Received June 28th, 2011; revised August 11th, 2011; accepted September 14th, 2011. ABSTRACT The effect of microstructure of nickel-aluminum bronze alloy (NAB) on the corrosion behavior in artificial seawater is studied using linear polarization, impedance and electrochemical noise tests. The alloy was heat treated in different heating cycles including quenching, normalizing and annealing. Microstructure of the specimens was characterized before and after heat treatment by optical microscopy and scanning electron microscopy. Results showed that the value of pearlite phase in the normalized alloy is much more than other specimens, leading to higher corrosion resistance. Polarization test showed that starting point of passivation in the polarization of the normalized alloy is lower than other specimens. The dissolution of Mn and Fe rich phases increased the Mn and Fe contents in solid solution, and this en- hanced the passivation power of the surface of the alloy. The effect of the alloying elements was seen by a lower corro- sion potential and an inflexion at around 280 mV (SCE) in the polarization curve, indicating the preferential dissolution of some elements beyond that potential. The polarization curve showed that the anodic polarization behavior of the al- loy in the solution was essentially controlled by the intermetallic phases, mainly containing Cu. Two types of corrosion, pitting and selective corrosion, were observed in the specimens after being exposed to artificial seawater. Keywords: Nickel-Aluminum Bronze Alloy, Heat Treatment, Corrosion, Microstructure 1. Introduction Nickel-aluminum bronze known as NAB is a series of copper-based alloy with additions of 9% - 12% Al and 6% Ni and Fe. High corrosion resistance of this alloy has made it one of the most practical alloys in marine appli- cations e.g. ship propellers [1,2]. The microstructure of the alloy consists of a Cu-rich solid solution known as α-phase and β′-phase or martensitic β-phase, surrounded by lamellar eutectoid phase and a series of intermatallic k phases [3 and 4]. Among the inermetallic compounds, KI phase is rosette shape which is rich in Fe, KII phase is smaller than kI phase and form a dendritic rosette shape which distributed at the α/β boundaries, KIII phase is la- mellar shape and it forms at the boundary of KI phase and is rich in Ni and KIV phase is a fine Fe rich precipitations that forms in α phase [5]. Recently, a vast range of inves- tigation have been carried out to study the corrosion be- havior of the cast nickel-aluminum alloy [6,7] and it has been found that optimum corrosion resistant of the alloy in seawater can be obtained by controlling the mictro- structure [8]. Corrosion of the bronze alloy in seawater have been investigated and the tendency of the cast alloy to corrode was attributed to the formation of β′ phase which plays an anodic role compare to α matrix [9]. The complexity of the alloy with several intermetallic phases lead to a significant change in the development of the microstructures, which can result in extensive corrosion resistance in seawater. Results of salt spray test on corro- sion behavior of the alloy indicated that corrosion resis- tance has been improved in the heat treatment sequences like aging, quenching, normalizing and annealing. Char- acterizing the microstructure showed that quenching transforms all β phase into β′ phase and aging results in  Corrosion Behavior of Heat Treated Nickel-Aluminum Bronze Alloy in Artificial Seawater1543 precipitation of fine k phases. On the other hand, anneal- ing has lead to the transformation of β′ martensite into α and k phases [10]. Microstructure of the bronze alloy suffered from cavitation corrosion in seawater showed that the alloy was corroded by selective corrosion at the interface between α phase and intermetallic K precipi- tates, however, K precipitate-free zones were not consid- erably corroded. Crevice corrosion of the copper-based alloy was often associated with the formation of a Cu-ion concentration cell and an accelerated attack at the ex- posed area adjacent to the crevice [11]. Meigh et al. [12] declared crevice corrosion occurs in the nickel-aluminum bronze when it is not cathodically protected. It has been reported that the rate of crevice corrosion of the alloy in seawater is about 0.7 - 1.0 mm y-1 [13,14]. The corro- sion resistance of the alloy is owned to a protective layer containing both Al and Cu oxides, with 900 to 1000 nm thickness [15,16]. The Al-rich oxide layer usually forms in the vicinity of the alloy and the Cu-rich forms in the external regions. Oxides of Ni and Fe, and a little Cu salts and Cu hydroxychlorides (Cu2(OH)3Cl and Cu (OH)Cl) exist on the surface of the alloy after exposing for long time to seawater. These oxide layers provide corrosion protection by mutually lessening the anodic dissolution reaction, stopping the ionic transport across the oxide layers, and a decrease in the rate of the ca- thodic reaction on the oxide layers. On the contrary to the many studies of the corrosion in seawater for the alloy, there has been small number of investigations to study the effect of heat treatment processes on the electro- chemical kinetics at the surface of the alloy when it is exposed to seawater environment [17]. For example, Schüssler and Exner [11] conducted a research on the dissolution of a cast nickel-aluminum bronze alloy in seawater with considering a fixed velocity of electrolyte without a considerable contribution on the effect of mi- crostructure on the corrosion. Kear et al. showed that both cathodic [16] and anodic [17] polarization can occur during the corrosion of the alloy in an aqueous solution. The anodic dissolution of the alloy showed significant dissolution of Cu with forming dichlorocuprous anion and the cathodic reaction showed four electron reduction of dissolved oxygen on the surface. However, at a mixed potential, the anodic kinetics are controlled by mass transfer and charge transport. As a result, the rate and mechanism of the corrosion are very susceptible to prior heat treatment processes. The protective nature of the alloy was attributed to the formation of a Cu2O layer due to the history of its heat treatment. The reduction of the corrosion rate during the layer formation process was explained by means of the concurrent decrease both of the anodic reaction inside the growing Cu2O layer, and the cathodic reaction on its surface. Aluminum in pas- sivation was incorporated in the Cu2O lattice, reducing the rate of oxygen reduction on the Cu2O surface when the alloy exposed to a corrosive environment [17]. From another stand point, electronic tools like linear polarization have some drawbacks for the measurement of electrochemical properties. One of the main problems is the invasive character of the devices to the electro- chemical systems of the metallic electrodes in aqueous solutions [18]. In this regard, the corrosion current den- sity of metallic electrodes, corresponding to the open- circuit potential of the electrodes in the aqueous solution can be measured with zero resistance ammeter and linear polarization methods [19]. In zero resistance ammeter the corrosion current can be estimated with measuring cur- rent density of two similar metallic electrodes at the open-circuit potential of the electrodes in seawater with- out any external voltage on the electrodes. This process owned to the existence of electronic noise and loss of the electrical resistance across the interface between two electrodes and seawater. However, in the linear polariza- tion method, the corrosion current density of electrode at the open-circuit potential of the electrode in artificial seawater can be measured with an external voltage. In this process, polarization resistance expands across the interface between the solid electrode and seawater. As one part of the present study concentrates on the results of electrochemical noise technique, the fluctuations of the current and potential were generated at the same time during the corrosion process. The most effective part of this test was the elimination of disturbing signals and the ability to avoid the artificial disturbances during the measurement. It was shown that the sensitivity of elec- trochemical noise measurement is considerably higher than other conventional methods in the case of localized corrosion process [20]. In this method, at different times the intensity of corrosion can be monitored and the noise resistance, the ratio of the standard deviations of the po- tential and current noise can be easily measured. The mechanism of the process is a competition course be- tween breakdown and repassivation of the passive film with developing a pitting and an active corrosion process. In this state, forming unstable pits depends on the time and repassivation is the consequence of the shape and life of the unstable pits. For estimating power spectral den- sity by the maximum entropy method, it is essential to choose the maximum order of the autoregressive acci- dental variable. If the order is small, the spectrum can be approximately flat and if the spectrum emerges noisier it shows the order is large [21]. In the statistical calculation of the noises, the highest noises called shot-noise were analyzed and the individual occurrences in the corrosion process were considered. In the present study, the influence of different pre-heat Copyright © 2011 SciRes. MSA  Corrosion Behavior of Heat Treated Nickel-Aluminum Bronze Alloy in Artificial Seawater Copyright © 2011 SciRes. MSA 1544 treatments on the passivation behavior of nickel-alumi- num bronze alloy is studied using linear polarization, impedance and electrochemical noise tests. The effect of heat treatment processes during corrosion of the alloy was evaluated by optical microscopic, scanning electron microscopy and X-ray diffraction analysis. It was found that normalizing of the alloy has a considerable effect in preventing the corrosion in artificial seawater. 2. Experimental Details The nickel-aluminum bronze alloy (C95520) was cast according to ASTM B 148 standard and then cut into small pieces of dimensions 6 mm × 6 mm × 3.5 mm. The composition of the alloy was determined by X-ray fluo- rescence spectrometry (XRF) and it is shown in Table 1. Tensile strength and hardness of the substrate esti- mated experimentally shown the alloy has tensile strength of about 630 MPa and hardness of 162 HV. The phase composition has been checked at high exposure times by X-ray diffractometry (XRD) in the Bragg- Brentano geometry, using Cu = Kα radiation (k = 0.15404 nm). The specimens were mechanically cleaned, degreased, immersed in an aqueous solution of 20% HNO3 and then dried and maintained for 24 h in a desic- cator in excess of silica gel and in the last part of the cleaning process the alloy weighed. For preparing the aqueous solution, artificial seawater was made according to ASTM D 1141-98 standard. The combination of the compounds in the artificial seawater is given in Table 2. The artificial seawater with pH of 8.26, dissolved oxygen concentration of around 7.0 ppm and conductiv- ity of 59.8 mS m–1 was held at ambient temperature of 27˚C during the test. Before accomplishing any corrosion test, the specimens were heat treated in different cycles. The applied heat treatment procedures for altering the microstructure of the alloy are given in Table 3. The specimens were mechanically polished with 0.2 μm α-alumina slurry and etched with the solution of 5 g FeC13 + 25 mL HC1 + 50 mL H20. X-ray diffraction test was performed to realize the intermetallic compounds in the heat treated specimens before and after corrosion tests. To perform the polarization test, the specimens were grounded, polished and degreased with acetone. To prevent other areas from exposing to seawater an area with a dimension of 1 mm × 1 mm was chosen and other areas were protected with a polymeric adhesive. The ad- hesive prepared by combining cure polyamide and rein- forcement shielded with BissWax in order to minimize the localized corrosion. General corrosion behavior e.g. oscillation in corrosion potential of the alloy was esti- mated using linear polarization with EG & G, model 237A corrosion system. The data recorded from this test was analyzed by MATLAB V7.0.0 software. The poten- tial scanning rate was 0.5 mVs–1 and when the potential reached to 800 mV, the scan was discontinued. In this test, Ag/AgCl and Pt reference electrodes were used in a potential between –700 and 800 mV setting in maximum value for 0.6 second. The platinum counter electrode enabled controlling the potentiostatic during the test. The recorded values of corrosion rate correspond to the aver- age value from the specimens per exposure time. The passivation resistance layer was estimated with imped- ance test according to ASTM G 106-89 standard. In the test, potansiostat EG & G, model 273A device was em- ployed and M398 V.1.30 software was used for re- cording impedance data and drawing Bode curve during the test. To record the data from Nyquist test, Z view-V3.0c software was employed. After linear polari- zation and impedance test, scanning electron microscope (SEM) was used for characterizing the microstructural changes. In electrochemical noise measurements, 22 small containers with a capacity of 400 cc were prepared. The specimens were kept in 1cm distance from each other in the container with protecting the environment from any vibration or pulsation. The anode to cathode area ratio was 1:1. The specimens were connected via electrical leads, with a gap of 1 cm and were mounted in a planar orientation on two non-metallic boards. The boards were immersed in artificial seawater. The current and potential were measured using a zero resistance am- meter, model SNAWA. Formation and destruction of passive film on the surface of specimens, initiated by pitting corrosion, was recorded by InstLinkPC software. The reference electrode was located in a free space be- tween two of the specimens with the same applied pre-heat treatment process. Specimens held in artificial seawater for periods of 11, 20, 40, 50 and 75 days were tested in electrochemical noise examination (ZRA) for 1400, 2500, 4000, 4500 and 6000 second. Figure 1 shows how specimens were located in the container for corrosion tests. Table 1. Chemical composition of nickel-aluminum bronze alloy (wt%) after casting. Element Composition (wt%) Material Cu Al Fe Ni Si Pb Zn Sn Mn Nickel-aluminum bronze alloy (NAB) Bal. 11.54 4.47 4.60 0.030 0.017 0.002 0.005 0.001  Corrosion Behavior of Heat Treated Nickel-Aluminum Bronze Alloy in Artificial Seawater1545 Table 2. Chemical composition of artificial seawater based on ASTM D 1141-98 standard. Component Quality Unit NaHCO3 0.201 g/L CaCl2 1.158 g/L MgCl2.6H2O 11.112 g/L SrCl2.6(H2O) 0.042 g/L NaCl 25.534 g/L Na2SO4 4.094 g/L KCl 0.695 g/L KBr 0.201 g/L H3BO3 0.201 g/L NaF 0.201 g/L Table 3. Applied heat treatment cycles to nickel-aluminum bronze alloy. Hear treatment Group name Time (min) Specimen code Temperature (°C) 1 475 9 675 Quenching in water, 27°C A 15 17 825 3 475 11 675 19 825 Quenching in water, 27°C B 30 25 900 5 475 13 675 Quenching in water, 27°C C 45 21 825 7 475 15 675 Quenching in water, 27°C D 60 23 825 2 475 10 675 Normalizing in air E 15 18 825 4 475 12 675 20 825 Normalizing in air F 30 26 900 6 475 14 675 Normalizing in air G 45 22 825 8 475 16 675 Normalizing in air H 60 24 825 Figure 1. Schematic of the location of the alloy and elec- trodes in the container filled with artificial seawater. 3. Results and Discussion The microstructure is characterized by metallographic techniques and is found to consist of α-phase, retained β-phase and numerous K-phases. The microstructures of the specimens before and after heat treatment are shown in Figures 2 and 3, respectively. In the cast alloy, β phase transforms to α phase together with some lamellar KIII at grain boundaries and globular star shape KII pre- cipitates. KIII is Ni based (usually AlNi) and KII and KIV are a combination of Fe and Al was always emerging as Fe3Al compound in the microstructure (see Figure 2). Normalizing at a lower temperature causes formation of fine Fe rich KIV within the grains. However, if the cooling was not slow enough, some of the high tempera- ture β was retained as a martensitic structure. The mart- ensite was then transformed into a very fine mixture of α and K phases, with NiAl precipitates, referred to as tem- pered martensite (see Figure 3). XRD analysis was performed in one of the specimens normalized at 900˚C showing Cu-rich α phase was formed along with KIII or KIV in the matrix (Figure 4). It was observed that with increasing the normalizing tem- perature β phase increased dramatically and eutectoid transformation products together with K phases were decreased. This may in turn affect the reaction products with the corrosive environment. Figure 5 shows the mi- crostructure of the alloy after normalizing at 900˚C which KIII and KIV phases were formed in the matrix as well as presenting retained β phase. However, the quenched alloy contained Widmanstat- ten and α phase in a matrix of martensite. When the specimens were cooled in air more Widmanstatten and α have formed in the matrix. Additionally, the specimen held in longer time at the heat treatment temperature and quenched in water contained martensite and bainite plus fine eutectoid surrounding the Widmanstatten and α. For Copyright © 2011 SciRes. MSA 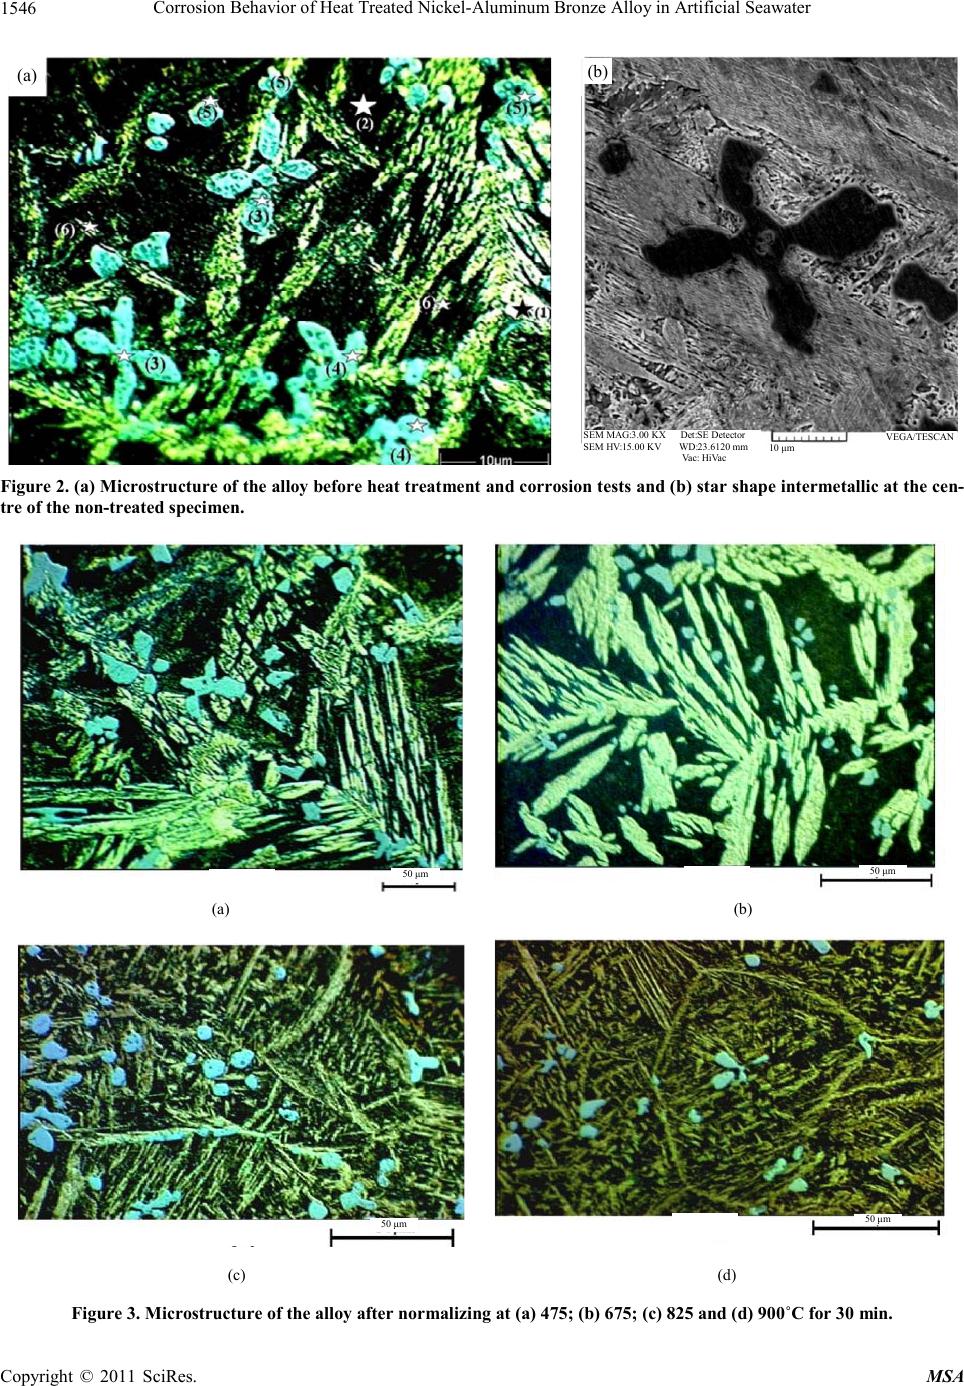 Corrosion Behavior of Heat Treated Nickel-Aluminum Bronze Alloy in Artificial Seawater 1546 (a) (b) SEM MAG:3.00 KX Det:SE Detector SEM HV:15.00 KV WD:23.6120 mm Vac: HiVac VEGA/TESCAN 10 μm Figure 2. (a) Microstructure of the alloy before heat treatment and corrosion tests and (b) star shape intermetallic at the cen- tre of the non-treated specimen. 50 μm 50 μm (a) (b) 50 μm 50 μm (c) (d) Figure 3. Microstructure of the alloy after normalizing at (a) 475; (b) 675; (c) 825 and (d) 900˚C for 30 min. Copyright © 2011 SciRes. MSA 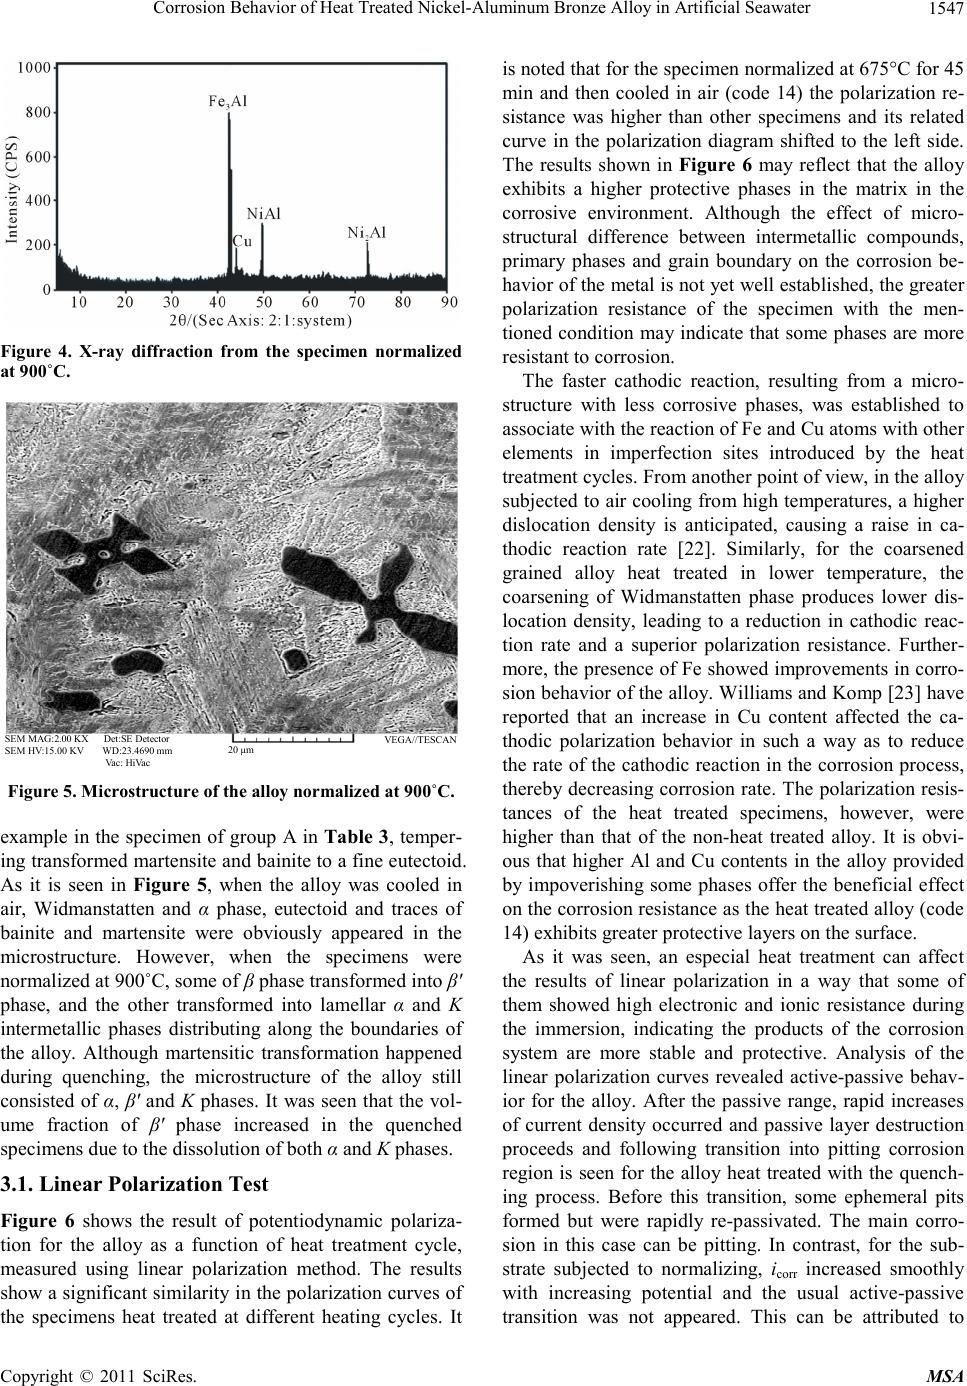 Corrosion Behavior of Heat Treated Nickel-Aluminum Bronze Alloy in Artificial Seawater Copyright © 2011 SciRes. MSA 1547 Figure 4. X-ray diffraction from the specimen normalized at 900˚C. SEM MAG:2.00 KX Det:SE Detector SEM HV:15.00 KV WD:23.4690 mm Vac: HiVac VEGA//TE SCAN 20 μm Figure 5. Microstructure of the alloy normalized at 900˚C. example in the specimen of group A in Table 3, temper- ing transformed martensite and bainite to a fine eutectoid. As it is seen in Figure 5, when the alloy was cooled in air, Widmanstatten and α phase, eutectoid and traces of bainite and martensite were obviously appeared in the microstructure. However, when the specimens were normalized at 900˚C, some of β phase transformed into β′ phase, and the other transformed into lamellar α and K intermetallic phases distributing along the boundaries of the alloy. Although martensitic transformation happened during quenching, the microstructure of the alloy still consisted of α, β′ and K phases. It was seen that the vol- ume fraction of β′ phase increased in the quenched specimens due to the dissolution of both α and K phases. 3.1. Linear Polarization Test Figure 6 shows the result of potentiodynamic polariza- tion for the alloy as a function of heat treatment cycle, measured using linear polarization method. The results show a significant similarity in the polarization curves of the specimens heat treated at different heating cycles. It is noted that for the specimen normalized at 675°C for 45 min and then cooled in air (code 14) the polarization re- sistance was higher than other specimens and its related curve in the polarization diagram shifted to the left side. The results shown in Figure 6 may reflect that the alloy exhibits a higher protective phases in the matrix in the corrosive environment. Although the effect of micro- structural difference between intermetallic compounds, primary phases and grain boundary on the corrosion be- havior of the metal is not yet well established, the greater polarization resistance of the specimen with the men- tioned condition may indicate that some phases are more resistant to corrosion. The faster cathodic reaction, resulting from a micro- structure with less corrosive phases, was established to associate with the reaction of Fe and Cu atoms with other elements in imperfection sites introduced by the heat treatment cycles. From another point of view, in the alloy subjected to air cooling from high temperatures, a higher dislocation density is anticipated, causing a raise in ca- thodic reaction rate [22]. Similarly, for the coarsened grained alloy heat treated in lower temperature, the coarsening of Widmanstatten phase produces lower dis- location density, leading to a reduction in cathodic reac- tion rate and a superior polarization resistance. Further- more, the presence of Fe showed improvements in corro- sion behavior of the alloy. Williams and Komp [23] have reported that an increase in Cu content affected the ca- thodic polarization behavior in such a way as to reduce the rate of the cathodic reaction in the corrosion process, thereby decreasing corrosion rate. The polarization resis- tances of the heat treated specimens, however, were higher than that of the non-heat treated alloy. It is obvi- ous that higher Al and Cu contents in the alloy provided by impoverishing some phases offer the beneficial effect on the corrosion resistance as the heat treated alloy (code 14) exhibits greater protective layers on the surface. As it was seen, an especial heat treatment can affect the results of linear polarization in a way that some of them showed high electronic and ionic resistance during the immersion, indicating the products of the corrosion system are more stable and protective. Analysis of the linear polarization curves revealed active-passive behav- ior for the alloy. After the passive range, rapid increases of current density occurred and passive layer destruction proceeds and following transition into pitting corrosion region is seen for the alloy heat treated with the quench- ing process. Before this transition, some ephemeral pits formed but were rapidly re-passivated. The main corro- sion in this case can be pitting. In contrast, for the sub- strate subjected to normalizing, icorr increased smoothly with increasing potential and the usual active-passive transition was not appeared. This can be attributed to 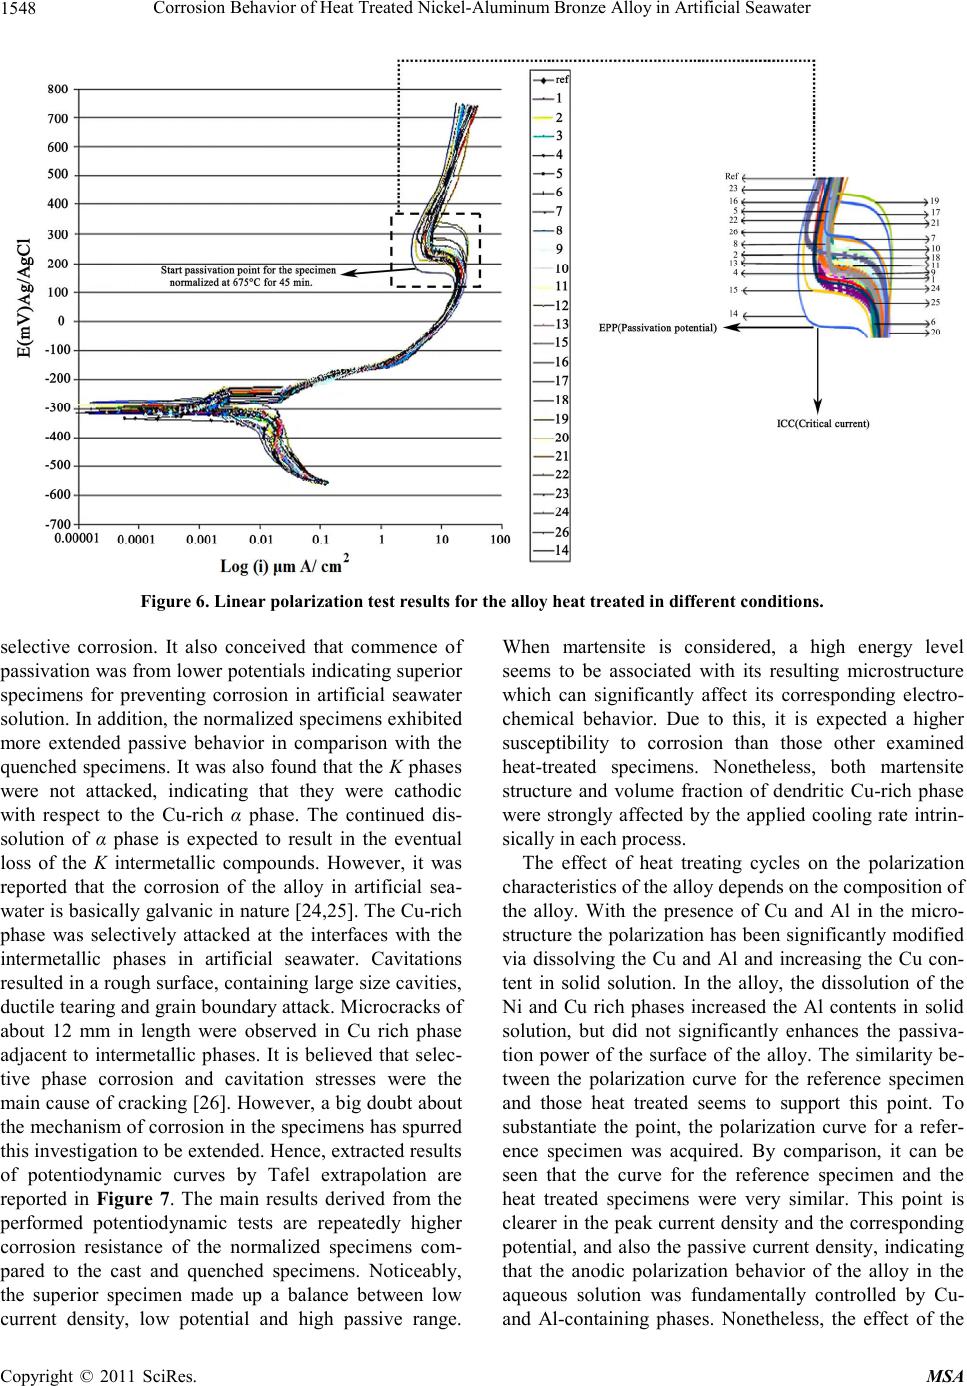 Corrosion Behavior of Heat Treated Nickel-Aluminum Bronze Alloy in Artificial Seawater 1548 Figure 6. Linear polarization test results for the alloy heat treated in different conditions. selective corrosion. It also conceived that commence of passivation was from lower potentials indicating superior specimens for preventing corrosion in artificial seawater solution. In addition, the normalized specimens exhibited more extended passive behavior in comparison with the quenched specimens. It was also found that the K phases were not attacked, indicating that they were cathodic with respect to the Cu-rich α phase. The continued dis- solution of α phase is expected to result in the eventual loss of the K intermetallic compounds. However, it was reported that the corrosion of the alloy in artificial sea- water is basically galvanic in nature [24,25]. The Cu-rich phase was selectively attacked at the interfaces with the intermetallic phases in artificial seawater. Cavitations resulted in a rough surface, containing large size cavities, ductile tearing and grain boundary attack. Microcracks of about 12 mm in length were observed in Cu rich phase adjacent to intermetallic phases. It is believed that selec- tive phase corrosion and cavitation stresses were the main cause of cracking [26]. However, a big doubt about the mechanism of corrosion in the specimens has spurred this investigation to be extended. Hence, extracted results of potentiodynamic curves by Tafel extrapolation are reported in Figure 7. The main results derived from the performed potentiodynamic tests are repeatedly higher corrosion resistance of the normalized specimens com- pared to the cast and quenched specimens. Noticeably, the superior specimen made up a balance between low current density, low potential and high passive range. When martensite is considered, a high energy level seems to be associated with its resulting microstructure which can significantly affect its corresponding electro- chemical behavior. Due to this, it is expected a higher susceptibility to corrosion than those other examined heat-treated specimens. Nonetheless, both martensite structure and volume fraction of dendritic Cu-rich phase were strongly affected by the applied cooling rate intrin- sically in each process. The effect of heat treating cycles on the polarization characteristics of the alloy depends on the composition of the alloy. With the presence of Cu and Al in the micro- structure the polarization has been significantly modified via dissolving the Cu and Al and increasing the Cu con- tent in solid solution. In the alloy, the dissolution of the Ni and Cu rich phases increased the Al contents in solid solution, but did not significantly enhances the passiva- tion power of the surface of the alloy. The similarity be- tween the polarization curve for the reference specimen and those heat treated seems to support this point. To substantiate the point, the polarization curve for a refer- ence specimen was acquired. By comparison, it can be seen that the curve for the reference specimen and the heat treated specimens were very similar. This point is clearer in the peak current density and the corresponding potential, and also the passive current density, indicating that the anodic polarization behavior of the alloy in the aqueous solution was fundamentally controlled by Cu- and Al-containing phases. Nonetheless, the effect of the Copyright © 2011 SciRes. MSA 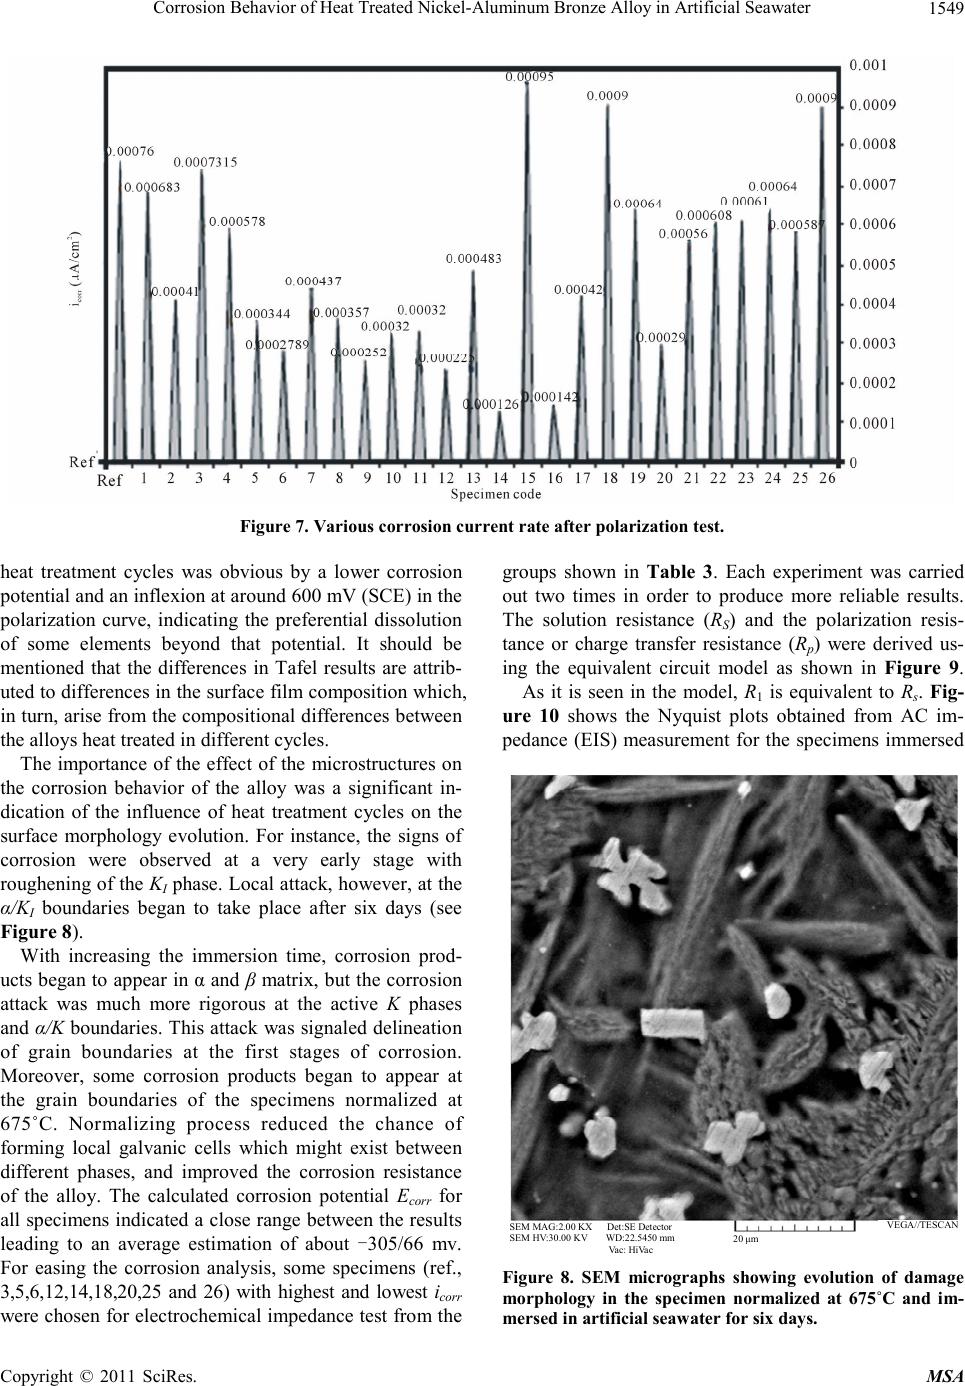 Corrosion Behavior of Heat Treated Nickel-Aluminum Bronze Alloy in Artificial Seawater1549 Figure 7. Various corrosion current rate after polarization test. heat treatment cycles was obvious by a lower corrosion potential and an inflexion at around 600 mV (SCE) in the polarization curve, indicating the preferential dissolution of some elements beyond that potential. It should be mentioned that the differences in Tafel results are attrib- uted to differences in the surface film composition which, in turn, arise from the compositional differences between the alloys heat treated in different cycles. The importance of the effect of the microstructures on the corrosion behavior of the alloy was a significant in- dication of the influence of heat treatment cycles on the surface morphology evolution. For instance, the signs of corrosion were observed at a very early stage with roughening of the KI phase. Local attack, however, at the α/KI boundaries began to take place after six days (see Figure 8). With increasing the immersion time, corrosion prod- ucts began to appear in α and β matrix, but the corrosion attack was much more rigorous at the active K phases and α/K boundaries. This attack was signaled delineation of grain boundaries at the first stages of corrosion. Moreover, some corrosion products began to appear at the grain boundaries of the specimens normalized at 675˚C. Normalizing process reduced the chance of forming local galvanic cells which might exist between different phases, and improved the corrosion resistance of the alloy. The calculated corrosion potential Ecorr for all specimens indicated a close range between the results leading to an average estimation of about -305/66 mv. For easing the corrosion analysis, some specimens (ref., 3,5,6,12,14,18,20,25 and 26) with highest and lowest icorr were chosen for electrochemical impedance test from the groups shown in Table 3. Each experiment was carried out two times in order to produce more reliable results. The solution resistance (RS) and the polarization resis- tance or charge transfer resistance (Rp) were derived us- ing the equivalent circuit model as shown in Figure 9. As it is seen in the model, R1 is equivalent to Rs. Fig- ure 10 shows the Nyquist plots obtained from AC im- pedance (EIS) measurement for the specimens immersed SEM MAG:2.00 KX Det:SE Detector SEM HV:30.00 KV WD:22.5450 mm Vac: HiVac VEGA//TESCA 20 μm Figure 8. SEM micrographs showing evolution of damage morphology in the specimen normalized at 675˚C and im- mersed in artificial seawater for six days. Copyright © 2011 SciRes. MSA 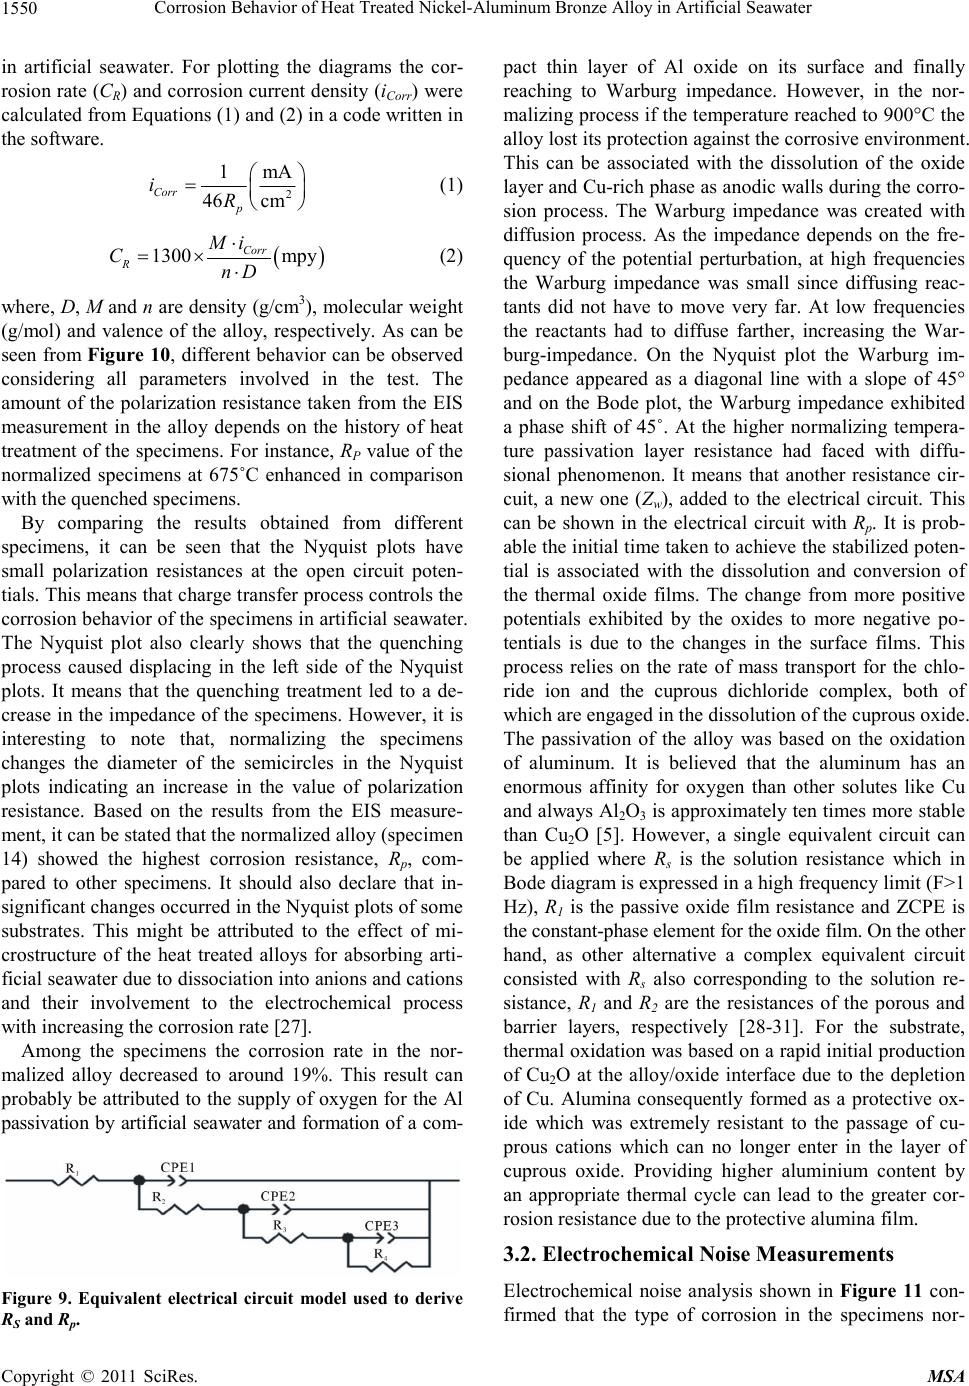 Corrosion Behavior of Heat Treated Nickel-Aluminum Bronze Alloy in Artificial Seawater 1550 in artificial seawater. For plotting the diagrams the cor- rosion rate (CR) and corrosion current density (iCorr) were calculated from Equations (1) and (2) in a code written in the software. 2 1mA 46 cm Corr p iR (1) 1300 mpy Corr R Mi CnD (2) where, D, M and n are density (g/cm3), molecular weight (g/mol) and valence of the alloy, respectively. As can be seen from Figure 10, different behavior can be observed considering all parameters involved in the test. The amount of the polarization resistance taken from the EIS measurement in the alloy depends on the history of heat treatment of the specimens. For instance, RP value of the normalized specimens at 675˚C enhanced in comparison with the quenched specimens. By comparing the results obtained from different specimens, it can be seen that the Nyquist plots have small polarization resistances at the open circuit poten- tials. This means that charge transfer process controls the corrosion behavior of the specimens in artificial seawater. The Nyquist plot also clearly shows that the quenching process caused displacing in the left side of the Nyquist plots. It means that the quenching treatment led to a de- crease in the impedance of the specimens. However, it is interesting to note that, normalizing the specimens changes the diameter of the semicircles in the Nyquist plots indicating an increase in the value of polarization resistance. Based on the results from the EIS measure- ment, it can be stated that the normalized alloy (specimen 14) showed the highest corrosion resistance, Rp, com- pared to other specimens. It should also declare that in- significant changes occurred in the Nyquist plots of some substrates. This might be attributed to the effect of mi- crostructure of the heat treated alloys for absorbing arti- ficial seawater due to dissociation into anions and cations and their involvement to the electrochemical process with increasing the corrosion rate [27]. Among the specimens the corrosion rate in the nor- malized alloy decreased to around 19%. This result can probably be attributed to the supply of oxygen for the Al passivation by artificial seawater and formation of a com- Figure 9. Equivalent electrical circuit model used to derive RS and Rp. pact thin layer of Al oxide on its surface and finally reaching to Warburg impedance. However, in the nor- malizing process if the temperature reached to 900°C the alloy lost its protection against the corrosive environment. This can be associated with the dissolution of the oxide layer and Cu-rich phase as anodic walls during the corro- sion process. The Warburg impedance was created with diffusion process. As the impedance depends on the fre- quency of the potential perturbation, at high frequencies the Warburg impedance was small since diffusing reac- tants did not have to move very far. At low frequencies the reactants had to diffuse farther, increasing the War- burg-impedance. On the Nyquist plot the Warburg im- pedance appeared as a diagonal line with a slope of 45° and on the Bode plot, the Warburg impedance exhibited a phase shift of 45˚. At the higher normalizing tempera- ture passivation layer resistance had faced with diffu- sional phenomenon. It means that another resistance cir- cuit, a new one (Zw), added to the electrical circuit. This can be shown in the electrical circuit with Rp. It is prob- able the initial time taken to achieve the stabilized poten- tial is associated with the dissolution and conversion of the thermal oxide films. The change from more positive potentials exhibited by the oxides to more negative po- tentials is due to the changes in the surface films. This process relies on the rate of mass transport for the chlo- ride ion and the cuprous dichloride complex, both of which are engaged in the dissolution of the cuprous oxide. The passivation of the alloy was based on the oxidation of aluminum. It is believed that the aluminum has an enormous affinity for oxygen than other solutes like Cu and always Al2O3 is approximately ten times more stable than Cu2O [5]. However, a single equivalent circuit can be applied where Rs is the solution resistance which in Bode diagram is expressed in a high frequency limit (F>1 Hz), R1 is the passive oxide film resistance and ZCPE is the constant-phase element for the oxide film. On the other hand, as other alternative a complex equivalent circuit consisted with Rs also corresponding to the solution re- sistance, R1 and R2 are the resistances of the porous and barrier layers, respectively [28-31]. For the substrate, thermal oxidation was based on a rapid initial production of Cu2O at the alloy/oxide interface due to the depletion of Cu. Alumina consequently formed as a protective ox- ide which was extremely resistant to the passage of cu- prous cations which can no longer enter in the layer of cuprous oxide. Providing higher aluminium content by an appropriate thermal cycle can lead to the greater cor- rosion resistance due to the protective alumina film. 3.2. Electrochemical Noise Measurements Electrochemical noise analysis shown in Figure 11 con- irmed that the type of corrosion in the specimens nor- f Copyright © 2011 SciRes. MSA 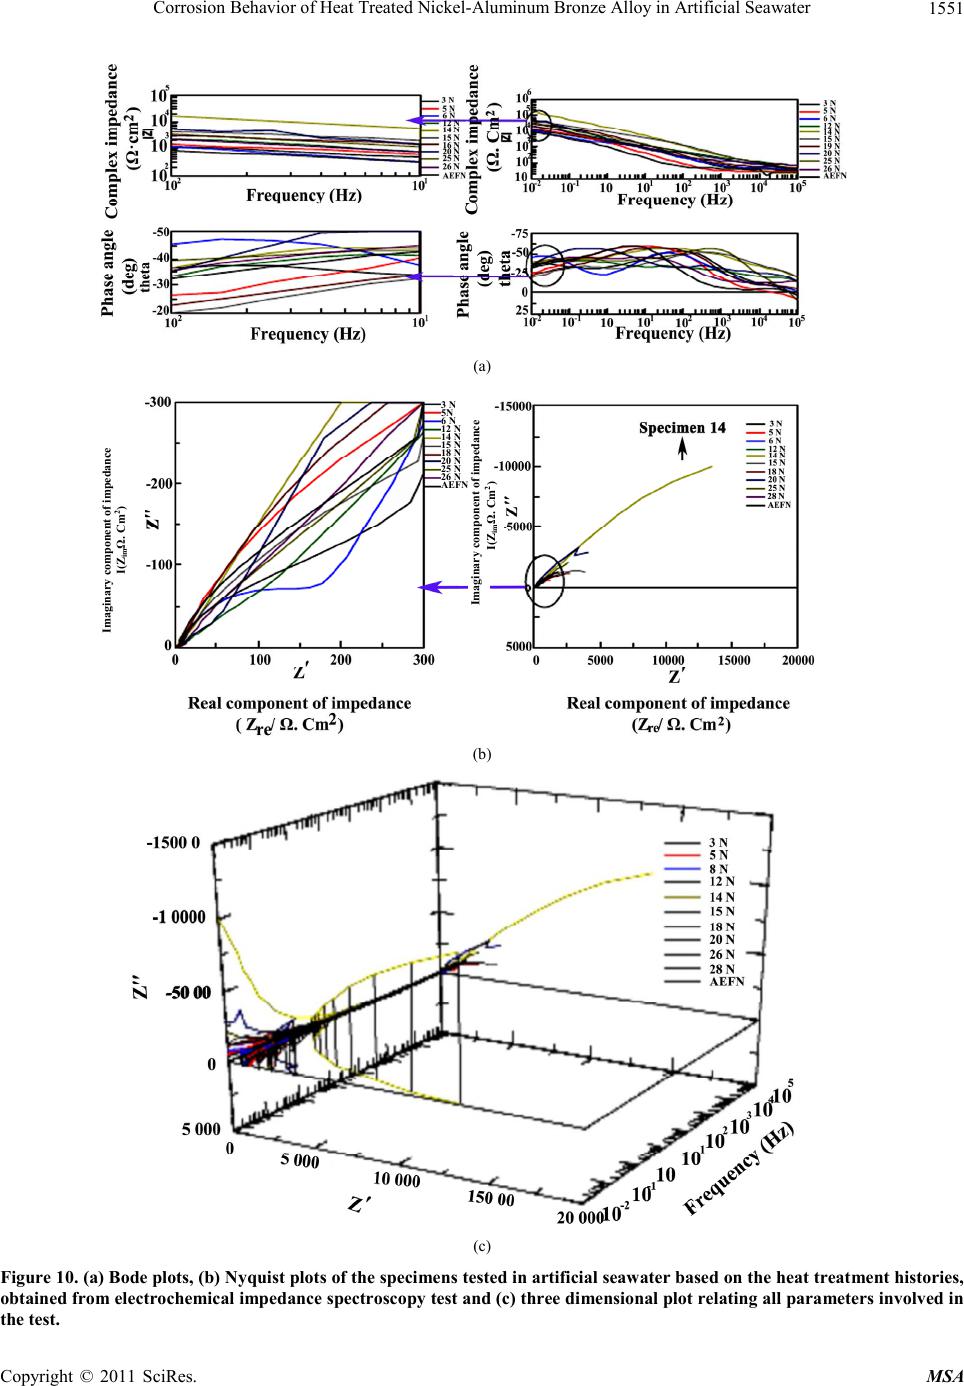 Corrosion Behavior of Heat Treated Nickel-Aluminum Bronze Alloy in Artificial Seawater Copyright © 2011 SciRes. MSA 1551 (a) 3 N 5N 6 N 12 N 14 N 15 N 18 N 20 N 25 N 26 N AEFN (b) (c) Figure 10. (a) Bode plots, (b) Nyquist plots of the specimens tested in artificial seawater based on the heat treatment histories, obtained from electrochemical impedance spectroscopy test and (c) three dimensional plot relating all parameters involved in the test. Imaginary component of impedance I(ZimΩ. Cm2) Imaginary component of impedance 2) I(ZimΩ. Cm Imaginary component of impedance I(Z Ω. Cm2) im 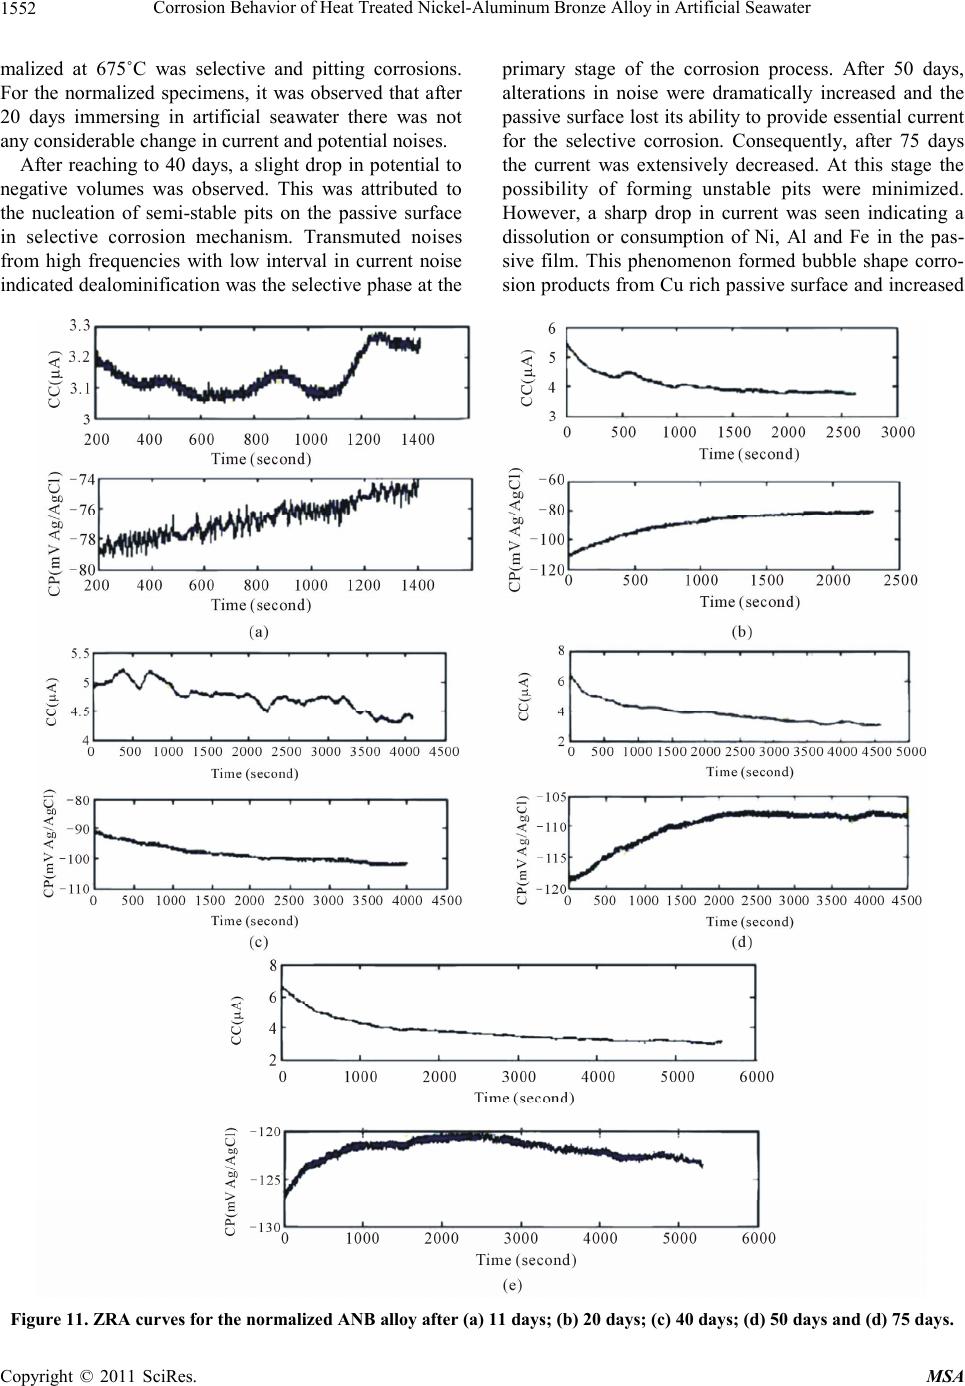 Corrosion Behavior of Heat Treated Nickel-Aluminum Bronze Alloy in Artificial Seawater 1552 malized at 675˚C was selective and pitting corrosions. For the normalized specimens, it was observed that after 20 days immersing in artificial seawater there was not any considerable change in current and potential noises. After reaching to 40 days, a slight drop in potential to negative volumes was observed. This was attributed to the nucleation of semi-stable pits on the passive surface in selective corrosion mechanism. Transmuted noises from high frequencies with low interval in current noise indicated dealominification was the selective phase at the primary stage of the corrosion process. After 50 days, alterations in noise were dramatically increased and the passive surface lost its ability to provide essential current for the selective corrosion. Consequently, after 75 days the current was extensively decreased. At this stage the possibility of forming unstable pits were minimized. However, a sharp drop in current was seen indicating a dissolution or consumption of Ni, Al and Fe in the pas- sive film. This phenomenon formed bubble shape corro- sion products from Cu rich passive surface and increased Figure 11. ZRA curves for the normalized ANB alloy after (a) 11 days; (b) 20 days; (c) 40 days; (d) 50 days and (d) 75 days. Copyright © 2011 SciRes. MSA 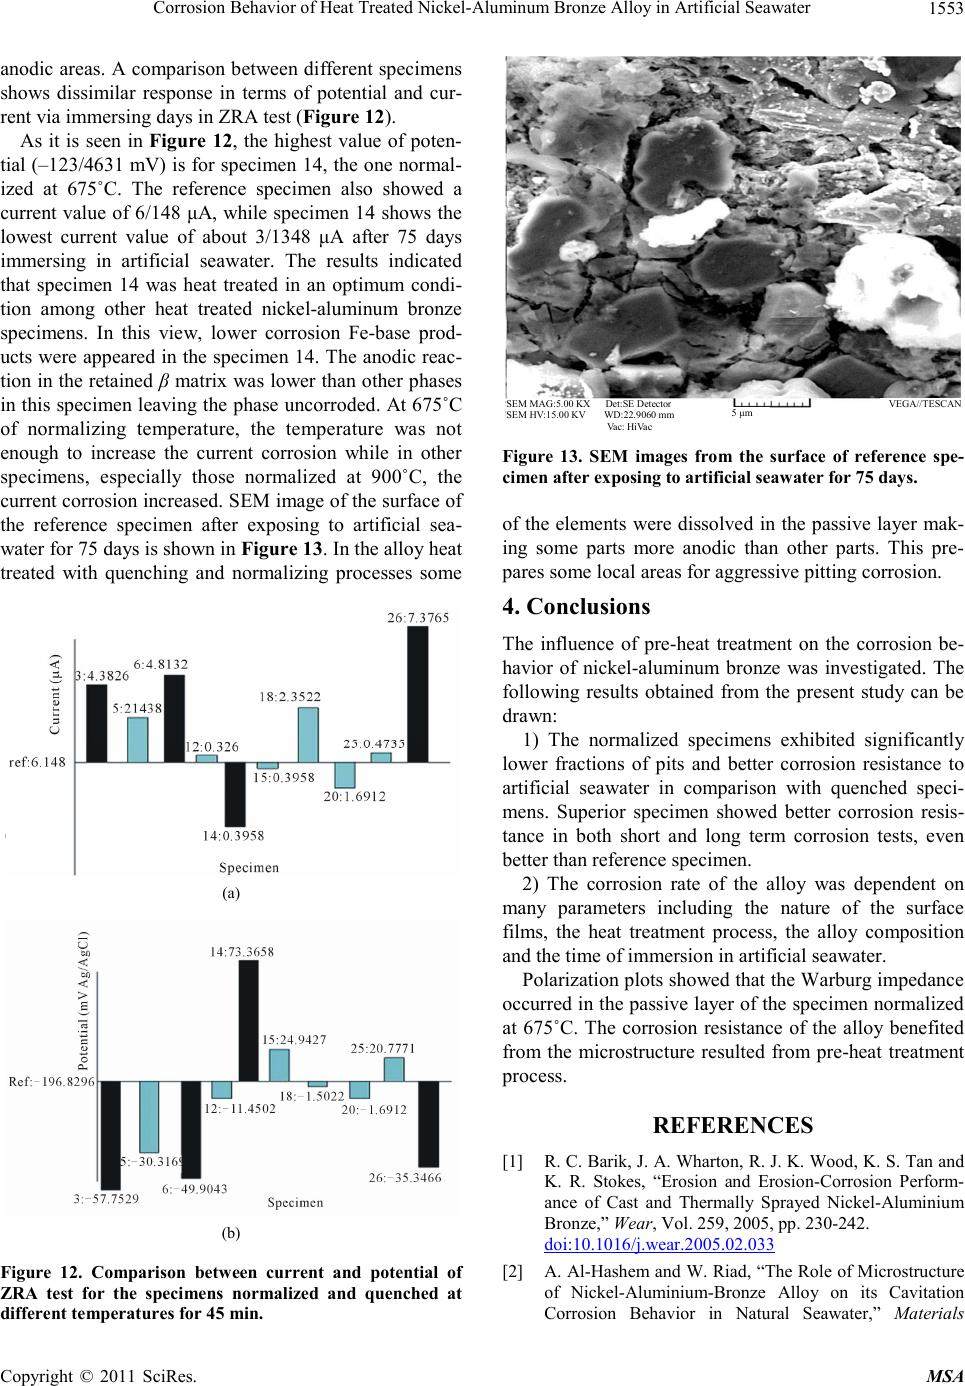 Corrosion Behavior of Heat Treated Nickel-Aluminum Bronze Alloy in Artificial Seawater1553 anodic areas. A comparison between different specimens shows dissimilar response in terms of potential and cur- rent via immersing days in ZRA test (Figure 12). As it is seen in Figure 12, the highest value of poten- tial (–123/4631 mV) is for specimen 14, the one normal- ized at 675˚C. The reference specimen also showed a current value of 6/148 μA, while specimen 14 shows the lowest current value of about 3/1348 μA after 75 days immersing in artificial seawater. The results indicated that specimen 14 was heat treated in an optimum condi- tion among other heat treated nickel-aluminum bronze specimens. In this view, lower corrosion Fe-base prod- ucts were appeared in the specimen 14. The anodic reac- tion in the retained β matrix was lower than other phases in this specimen leaving the phase uncorroded. At 675˚C of normalizing temperature, the temperature was not enough to increase the current corrosion while in other specimens, especially those normalized at 900˚C, the current corrosion increased. SEM image of the surface of the reference specimen after exposing to artificial sea- water for 75 days is shown in Figure 13. In the alloy heat treated with quenching and normalizing processes some (a) (b) Figure 12. Comparison between current and potential of ZRA test for the specimens normalized and quenched at different temperatures for 45 min. SEM MAG:5.00 KX Det:SE Detector SEM HV:15.00 KV WD:22.9060 mm Vac: HiVac VEGA// T ESC A 5 μm Figure 13. SEM images from the surface of reference spe- cimen after exposing to artificial seawater for 75 days. of the elements were dissolved in the passive layer mak- ing some parts more anodic than other parts. This pre- pares some local areas for aggressive pitting corrosion. 4. Conclusions The influence of pre-heat treatment on the corrosion be- havior of nickel-aluminum bronze was investigated. The following results obtained from the present study can be drawn: 1) The normalized specimens exhibited significantly lower fractions of pits and better corrosion resistance to artificial seawater in comparison with quenched speci- mens. Superior specimen showed better corrosion resis- tance in both short and long term corrosion tests, even better than reference specimen. 2) The corrosion rate of the alloy was dependent on many parameters including the nature of the surface films, the heat treatment process, the alloy composition and the time of immersion in artificial seawater. Polarization plots showed that the Warburg impedance occurred in the passive layer of the specimen normalized at 675˚C. The corrosion resistance of the alloy benefited from the microstructure resulted from pre-heat treatment process. REFERENCES [1] R. C. Barik, J. A. Wharton, R. J. K. Wood, K. S. Tan and K. R. Stokes, “Erosion and Erosion-Corrosion Perform- ance of Cast and Thermally Sprayed Nickel-Aluminium Bronze,” Wear, Vol. 259, 2005, pp. 230-242. do i:1 0. 10 16 / j. wear. 2 0 05 .02 .033 [2] A. Al-Hashem and W. Riad, “The Role of Microstructure of Nickel-Aluminium-Bronze Alloy on its Cavitation Corrosion Behavior in Natural Seawater,” Materials Copyright © 2011 SciRes. MSA  Corrosion Behavior of Heat Treated Nickel-Aluminum Bronze Alloy in Artificial Seawater 1554 Characterization, Vol. 48, 2002, pp. 37-41. doi:10.1016/S1044-5803(02)00196-1 [3] F. Hasan, J. Iqbal and N. Ridley, “Microstructure of As- cast Aluminum Bronze Containing Iron,” Materials Sci- ence Technology, Vol. 1, 1985, p. 312. [4] F. Hasan, A. Jahanafrooz, G. W. Lorimer and N. Ridley, “The Morphology, Crystallography, and Chemistry of Phases in As-cast Nickel-Aluminum-Bronze,” Metallur- gical Transactions A, Vol. 13A, 1982, p. 1337. doi:10.1007/BF02642870 [5] J. A. Wharton, R. C. Brik, G. Kear, R. J. K. Wood, K. R. Stokes and F. C. Walsh, “The Corrosion of Nickel-Alu- minum Bronze in Seawater,” Corrosion Science, Vol. 47, 2005, pp. 3336-3367. do i:1 0. 10 16 / j. co rs ci.2 00 5. 05 . 05 3 [6] J. A. Wharton and K. R. Stokes, “The Influence of Nickel-Aluminum Bronze Microstructure and Crevice Solution on the Initiation of Crevice Corrosion,” Elec- trochimica Acta, Vol. 53, 2008, pp. 2463-2473. doi:10.1016/j.electacta.2007.10.047 [7] M. D. Fuller, S. Swaminathan, A. P. Zhilyaev and T. R. Mcnelley, “Microstructural Transformations and Me- chanical Properties of Cast NiAl Bronze: Effects of Fu- sion Welding and Friction Stir Processing,” Materials Science and Engineering A, Vol. 463, 2007, pp. 128-137. doi:10.1016/j.msea.2006.07.157 [8] H. S. Campbell, “Aluminium Bronze Corrosion Resis- tance Guide,” Publication 80, Copper Development As- sociation, UK, July 1981, pp. 1-27. [9] Z. Charlws and J. Ferrara Robert, “Sea Water Corrosion of Nickel-Aluminum Bronze,” Transactions of the American Foundrymen’s Society, Vol. 82, 1974, pp. 71-78. [10] R.-P. Chen, Z.-Q. Liang, W. W. Zhang, D.-T. Zhang, Z.-Q. Luo and Y.-Y. Li, “Effect of Heat Treatment on Microstructure and Properties of Hot-Extruded Nic- kel-Aluminum Bronze,” Transactions of Nonferrous Metals Society of China, Vol. 17, 2007, pp. 1254-1258. doi:10.1016/S1003-6326(07)60258-1 [11] A. Schussler and H. E. Exner, “The Corrosion of Nickel-Aluminium Bronzes in Seawater-I. Protective Layer Formation and the Passivation Mechanism,” Cor- rosion Science, Vol. 34, 1993, p. 1793. doi:10.1016/0010-938X(93)90017-B [12] H. Meigh, “Cast and Wrought Aluminium Bronzes-Prop- erties,” Processes and Structure, 1st Edition, IOM Com- munications, 2000. [13] F. L. LaQue, “Marine Corrosion,” Wiley, New York, 1975. [14] J. C. Rowlands, “Studies of the Preferential Phase Corro- sion of Cast Nickel Aluminium Bronze in Seawater,” Proceeding of 8th International Congress of Metallic Corrosion , 1981, p. 1346. [15] G. Kear, B. D. Barker, K. R. Stokes and F. C. Walsh, “Electrochemical Corrosion of Unalloyed Copper in Chloride Media—A Critical Review,” Corrosion Science, Vol. 47, 2004, p. 1694. doi:10.1016/j.corsci.2004.08.013 [16] G. Kear, B. D. Barker, K. R. Stokes and F. C. Walsh, “Electrochemical Corrosion Behaviour of 90-10Cu-Ni Alloy in Chloride-Based Electrolytes,” Journal of Applied Electroch emist ry, Vol. 34, 2004, p. 659. doi:10.1023/B:JACH.0000031164.32520.58 [17] G. Kear, B. D. Barker and F. C. Walsh, “Electrochemistry of Non-Aged 90-10 Copper-Nickel Alloy (UNS C70610) as a Function of Fluid Flow Part 1: Cathodic and Anodic Characteristics,” Electrochimica Acta, Vol. 52, No. 5, 2007, pp. 1889-1898. doi:10.1016/j.electacta.2006.07.054 [18] K. Habib, “Measurement of the a.c. Impedance of Alu- minum Samples by Holographic Interferometry,” Optics and Lasers in Engineering, Vol. 28, 1997, pp. 37-46. doi:10.1016/S0143-8166(96)00058-9 [19] K. Habib, “Zero Resistance Ammeter of Metallic Alloys in Aqueous Solutions,” Optik-International Journal for Light and Electron Optics, Vol. 118, No. 6, 2007, pp. 296-301. doi:10.1016/j.ijleo.2006.03.023 [20] B. Zhao, J.-H. Li, R.-G. Hu, R.-G. Du and C.-J. Lin, “Study on the Corrosion Behavior of Reinforcing Steel in Cement Mortar by Electrochemical Noise Measure- ments,” Electrochimica Acta, 2007, Vol. 52, pp. 3976-3984. doi:10.1016/j.electacta.2006.11.015 [21] R. A. Cottis, “Interpretation of Electrochemical Noise Data,” NACE International Corrosion, Vol. 57, No. 3, 2009, pp. 65-23. [22] H.-H. Huang, W.-T. Tsai and J.-T. Lee, “The Influences of Microstructure and Composition on the Electrochemi- cal Behavior of a516 Steel Weldment,” Corrosion Sci- ence, Vol. 36, No. 6, 1994, pp. 1027-1038. doi:10.1016/0010-938X(94)90201-1 [23] F. T. Cheng, K. H. Lo and H. C. Man, “An Electro- chemical Study of the Crevice Corrosion Resistance of NiTi in Hanks’ Solution,” Journal of Alloys and Com- pounds, Vol. 437, 2007, pp. 322-328. doi:10.1016/j.jallcom.2006.07.127 [24] E. A. Culpan and R. Rose, “Corrosion Behaviour of Cast Nickel Aluminum Bronze in Sea Water,” British Corro- sion Journal, Vol. 14, No. 3, 1979, p. 160. [25] G. W. Loriner, F. Hasan, J. Iqbal and N. Ridley, “Obser- vation of Microstructure and Corrosion Behaviour of Some Aluminum Bronzes,” British Corrosion Journal, Vol. 21, 1986, No. 4, pp. 244-247. [26] A. Al-Hashem and W. Riad, “The Role of Microstructure of Nickel-Aluminium-Bronze Alloy on its Cavitation Corrosion Behavior in Natural Seawater,” Materials Characterization, Vol. 48, No. 1, 2002, pp. 37-41. doi:10.1016/S1044-5803(02)00196-1 [27] H. Jafari, M. Hasbullah Idris, A. Ourdjini, H. Rahimi and B. Ghobadian, “EIS Study of Corrosion Behavior of Me- tallic Materials in Ethanol Blended Gasoline Containing Water as a Contaminant,” Fuel, Vol. 90, No. 3, 2011, pp. 1181-1187. doi:10.1016/j.fuel.2010.12.010 [28] W. R. Osório, L. C. Peixoto, M. V. Canté and A. Garcia, “Electrochemical Corrosion Characterization of Al-Ni Alloys in a Dilute Sodium Chloride Solution,” Electro- Copyright © 2011 SciRes. MSA  Corrosion Behavior of Heat Treated Nickel-Aluminum Bronze Alloy in Artificial Seawater Copyright © 2011 SciRes. MSA 1555 chim Acta, Vol. 55, No. 13, 2010, pp. 4078-4085. doi:10.1016/j.electacta.2010.02.029 [29] W. R. Osório, L. C. Peixo, D. J. Moutinho, L. G. Gomes, I. L. Ferreira and A. Garcia, “Corrosion Resistance of Directionally Solidified Al-6Cu-1Si and Al-8Cu-3Si Al- loys Castings,” Materials and Design, Vol. 32, No. 7, 2011, pp. 3832-3837. [30] W. R. Osório, L. C. Peixoto, M. V. Canté and A. Garcia, “Microstructure Features Affecting Mechanical Properties and Corrosion Behavior of a Hypoeutectic Al-Ni Alloy,” Materials and Design, Vol. 31, No. 9, 2010, pp. 4485-4489. doi:10.1016/j.matdes.2010.04.045 [31] W. R. Osório, D. M. Rosa, L. C. Peixoto and A. Garcia, “Cell/Dendrite Transition and Electrochemical Corrosion of Pb-Sb Alloys for Lead-Acid Battery Applications,” Journal of Power Sources, Vol. 196, No. 15, 2011, pp. 6567-6572. doi:10.1016/j.jpowsour.2011.03.050
|