Journal of Geoscience and Environment Protection
Vol.06 No.05(2018), Article ID:84649,17 pages
10.4236/gep.2018.65009
Vapour and Solution Uptake Properties of Starch and Cellulose Biopolymers
Leila Dehabadi1, Mohsen Shakouri2, Carey J. Simonson2, Mohammad Arjmand3, Uttandaraman Sundararaj3, Lee D. Wilson1*
1Department of Chemistry, University of Saskatchewan, 110 Science Place, Saskatoon, SK, Canada
2Department of Mechanical Engineering, University of Saskatchewan, 57 Campus Drive, Saskatoon, Saskatchewan, Canada
3Department of Chemical and Petroleum Engineering, University of Calgary 2500 University Drive NW, Calgary, AB, Canada


Received: May 4, 2018; Accepted: May 20, 2018; Published: May 23, 2018
ABSTRACT
This study was aimed at gaining further insight on the role of hydration in adsorption processes of biopolymer/adsorbate systems using complementary methods (electromagnetic interference (EMI) shielding, calorimetry, and solvent/vapour adsorption isotherms). Cellulose and starch-based materials were used as the adsorbents, whereas water (liquid and vapour), ethanol and p-nitrophenol (PNP) in aqueous solution were the adsorbate systems. The biopolymer/water systems had higher uptake capacity overall, where starch materials showed higher uptake capacity than cellulose among the various solvents. The secondary and tertiary structure of the biopolymers was a key factor affecting their uptake capacity, as evidenced by the enhanced adsorption properties of starch over cellulose, along with higher uptake of amylose (AM) versus amylopectin (AP) in starch biopolymers. EMI results also confirmed that AM starch had higher adsorption toward water than ethanol. The textural properties and surface chemistry of the biopolymers were probed using dye adsorption (PNP at pH 8.5) in aqueous solution that showed parallel trends with water vapour adsorption isotherms. Isothermal Titration Calorimetry (ITC) revealed that the heat of adsorption in AP differed from that of AM since the biopolymer tertiary structure governs the accessibility of biopolymer adsorption sites. The role of branching in AP and amorphous domains in AM/AP composites are inferred to play a key role in hydration-driven allosterism known for such biopolymer/water vapour adsorption processes.
Keywords:
Biopolymers, Water Vapour Adsorption, Electromagnetic Interference (EMI), Textural Properties, P-Nitrophenol (PNP), Isothermal Titration Calorimetry (ITC)

1. Introduction
Starch is one of the most abundant and renewable polymers in Nature. The low toxicity, low cost, and synthetic versatility of starch lend to its use as a platform for the design of modified biopolymer sorbents [1] [2]. Biopolymers such as starch have gained interest in the field of nanotechnology due to their potential as carriers for advanced drug delivery systems, biomedical devices, tissue engineering scaffolds, wastewater treatment technologies and feedstocks for bio-refineries [3] [4]. Starch is a key energy source for plants and animals, where it is found in different natural forms such as granules (small compact form) that contain linear (amylose) and branch (amylopectin) biopolymers [5]. Amylose (AM) is comprised of α-1, 4-linked glucose units, while amylopectin (AP) polymer is comprised of both α-1, 4- and α-1, 6-linkages (cf. Figure 1). Starch is a biopolymer that consists of D-glucose units with helical structure [6], while AP is highly branched and water soluble with the highest content in the starch granule (70% - 80%) [7]. The structural analysis of granules reveals a repeating structure with amorphous and crystalline domains [8] [9], containing amylopectin and amylose, respectively [10] [11].
In addition, the association of amylose and amylopectin alter the properties of the resulting biopolymer complex due to the unique structure and morphology of the composite. The presence of amylopectin in the structure of mixed starch components alters the solubility and flexibility due to its branched form. The association of amylose and amylopectin may result in amorphous domains which lowers its density, as evidenced by more rapid hydrolysis. By contrast,

Figure 1. Structures of (A) amylose and (B) amylopectin starch biopolymers.
amylopectin contains crystalline domains that possess linear or helical morphology with high density, as evidenced by slower hydrolysis and reduced water solubility. The variable solubility of starch lends to its utility in industrial applications as an alternative adsorbent material. However, the structural complexity of starch has led to challenges in the predictive relationship between its structure and functional properties. The nonlinear relation between the physicochemical properties of starch and the amylose/amylopectin content requires further study to establish more reliable structure activity relationships (SARs). In part, SARs exist for mechanical and thermal stability properties, as shown for starch systems with greater high amylose content according to their higher viscosity, mechanical strength, and thermal stability over starch systems with low amylose content [12] [13].
The cell walls of plants contain significant levels of cellulose (Figure 2) [14], where its fibril structure possesses both amorphous and crystalline domains with a variable crystallinity index (40% to 60%). The degree of crystallinity of cellulose affects the overall accessibility of the hydroxyl groups, where the amorphous region offers more accessible hydroxyl groups compared to crystalline domains [15]. The chemical reactivity of cellulose relates to its amorphous character, as reported by Inimfon et al. [16]. The formation of stable intermolecular hydrogen bonds between adjacent cellulose strands contribute to its variable chemical reactivity and its polymorphic forms [17].
In this study, we investigate the sorption properties of cellulose (CE) and several starch biopolymers containing variable amylose (AM) and amylopectin (AP) content. The solvent swelling of the biopolymers in water and ethanol, and the sorption properties with water vapour and p-nitrophenol (PNP) in aqueous solution were studied, respectively. This study outlines: i) a systematic study of the structure and solvation properties of biopolymer sorbents using various complementary methods (adsorption isotherms and isothermal titration calorimetry), and ii) provides a greater understanding of biopolymer structure-function that relates to sorption properties.
2. Experimental
2.1. Materials
Cellulose (CE) and starch biopolymers from various sources (corn or maize)
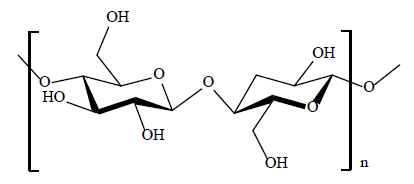
Figure 2. The repeat disaccharide unit of a biopolymer strand of cellulose where n denotes the degree of polymerization.
containing variable amylose and amylopectin content were chosen for the study (cf. Table 1). The biopolymers and ethanol (reagent grade, Commercial Alcohols Inc. Brampton, ON, Canada) were purchased from Sigma Aldrich (Oakville, ON, Canada) and used as received. Deionized and distilled water was used for the preparation of all aqueous solutions.
2.2. Water Vapour Adsorption Isotherms
The adsorption isotherms were obtained using the Intelligent Gravimetric Analyzer system IGA-002 (Hiden Isochema, UK). 40 mg of the adsorbent sample was placed in a stainless steel chamber attached to the microbalance. The sample container was housed ina thermostat reactor that allowed for ultra-high vacuum conditions. The desired temperature inside the reactor was controlled by a water bath. Samples were dried at 70˚C in vacuo (≈10−8 mbar) for 6 h. Then, the sample temperature was held at 25˚C prior to sample analysis. The IGA system controls the input and output valves to achieve the desired partial pressure in the chamber. After reaching equilibrium of the sample mass at one partial pressure (mbar), the IGA system advanced to the next partial pressure for the isotherm at 25˚C for a range of pressures (5 mbar increments; 0 to 30 mbar).
2.3. Particle Size Distribution and Zeta-Potential
The particle size distribution for starch granules (Table 2) and zeta potential (x) was measured using a Malvern Zetasizer Nano ZS (Malvern Instruments Ltd, Worcestershire, UK). The size distribution of the samples was obtained by measurement of light scattered (θ = 173˚) by particles (dynamic light scattering, DLS) illuminated with a laser beam. The CONTIN algorithm was used to analyze the decay rates that are a function of the translational diffusion coefficients of the particles, D. Size distribution values were derived from triplicate measurements, each consisted of a minimum of ten individual runs. x-values were estimated based on the laser Doppler electrophoresis and phase analysis light scattering [20]. The initial pH of the starch suspensions (40 mg sample in 7 mL)

Table 1.Selected physicochemical properties of starch and cellulose samples
Table 2. Particle size of variable types of starch granules
of adsorbent (starches and cellulose) in water was adjusted over a pH range (3 to 12) using either HCl (0.01 M) or NaOH (0.01 M). After reaching an equilibrium pH, aliquots of the suspension were taken for estimation of the x-values, where the reported results are the average of triplicate measurements from a minimum of ten individual runs.
2.4. Dye Adsorption Isotherms
The biopolymer adsorption properties in aqueous media were studied by evaluating their uptake properties using an organic dye adsorbate (PNP) at pH 8.5, and is above its pKa value (7.1) [21]. An aqueous solution of PNP was prepared using NaHCO3 buffer solution (1.0 M) at pH 8.5. 10 mg of each powdered sample were added to 4 dram glass vials followed by the addition of dye solution (7 ml) at different concentration (0.1 - 50 mM). The vials were sealed with parafilm and allowed to equilibrate with shaking at 180 rpm on a horizontal mechanical shaker (Poly Science, Dual Action Shaker) for 24 h. The samples were left at 295 K for 48 h and centrifuged (Precision Micro-Semi Micro Centricone, Precision Scientific Co.) at 1600 rpm for 1 h. The upper region of the solution was gently removed to a clean vial using a pipette. The UV-vis absorbance of PNP in the supernatant was measured from 200 to 650 nm. The absorption values were obtained using a Varian CARY 100 double beam spectrophotometer at 295 ± 0.5 K. Each measurement was obtained in duplicate by measuring absorbance at 405 nm, along with a calibration curve using standard solutions of PNP at variable concentration. The molar absorptivity of PNP (ε = 1174 M−1 cm−1) was determined by the Beer-Lambert relation. The equilibrium concentration (Ce, mM) of PNP was determined and the polymer uptake (Qe, mg/g) was obtained by Equation (1).
(1)
V is the volume of the solution (ml); C0 is the initial stock concentration (mM); and m is the polymer weight (mg). The isotherms were obtained by plotting Qe versus Ce.
2.5. Electromagnetic Interference (EMI) Shielding
EMI shielding measurements were performed using an E5071C Network Analyser (ENA series 300 kHz - 20 GHz) in the X-band frequency range of 8.2 to 12.4 GHz. Each sample was sandwiched between two waveguides of the network analyser. The network analyser transmits a signal down the waveguide incident to the sample. The scattering parameters (S-parameters) of each sample were recorded and used to measure the EMI Shielding Effectiveness (EMI SE). The EMI shielding measurements were performed using equilibrium solvent-swelled samples after imbibing in water, ethanol and a 50% w/w water-ethanol mixture for 6 h. Figure 3 shows a schematic diagram of the network analyser for measurement of EMI SE. Further information and experimental details on the

Figure 3. Schematic diagram of network analyzer for measurement of electromagnetic interference shielding effectiveness. MUT stands for the material under the test. Reproduced from [23] with permission.
EMI shielding setup is provided elsewhere [22] [23].
2.6. Isothermal Titration Calorimetry (ITC)
ITC measurements were obtained using a Calorimetry Sciences Corp. (CSC) isothermally at 25˚C. The enthalpy of adsorption was derived for the binding interactions between the biopolymers and water vapour. The heat of adsorption was measured by passing the water vapour through a heat exchanger coil connected to a water bath at 70˚C into a stainless steel sample cell (1.430 mL) containing the sample (ca. 10 mg). The experimental data obtained from the ITC titration were analyzed using CSC commercial Bind Works 3.1 software. Also, deionized water was used as a standard sample. A single binding model with an independent set of multiple binding sites was used for the nonlinear regression. The surface area under the peak shows the enthalpy of adsorption (ΔHads) that was estimated using the Origin software.
3. Results and Discussion
3.1. Water Vapour Adsorption Isotherms
Figure 4 shows the water vapour adsorption isotherms for the samples at 25˚C. The results reveal that the adsorption and desorption of water vapour for the samples follow a Type II isotherm profile [24]. In addition, the water vapour sorption process in cellulose and starch bear similarities that relate to the structural similarity of these biopolymers and the key role of -OH adsorption sites. In addition, the completion of the monolayer saturation profile takes place at a low relative partial pressure (p/p0) near 0.2, while much of the vapour adsorption occurs at p/p0 > 0.8. Parallel trends were observed for N2 adsorption isotherms for the same materials. However, lower levels of N2uptake were observed [25] relative to the water vapour uptake herein. The water uptake (w/w %) for the biopolymers is given in parentheses; AM (28.8), AP (29.4), CE (16.4) and AM50 (37.7), where the starch materials exceed the uptake capacity of CE. This may relate to the greater surface accessibility of -OH surface groups of starch over CE and the amorphous nature of the biopolymer. It is noted that the water uptake of AM50 exceeds that of AM and AP and is in agreement with the role of adsorption sites in the amorphous domains for this mixed starch system. The BET surface area (SA) of the biopolymers was calculated from water vapour isotherms using Equation (2) and the results are summarized in Table 3.

Figure 4. Water vapor adsorption isotherms for starch materials (AM, AP, AM50) and cellulose (CE).
Table 3. BET adsorption isotherm parameters for biopolymers with water vapour at 298 K.
(2)
The terms KBET and Cs are the equilibrium adsorption constant and saturated concentration of the adsorbate, respectively.
The estimated SA of the starch biopolymers exceed that of cellulose, in agreement with the uptake capacity, however; the BET SA estimates obtained from N2 isotherms are systematically lower (100 to 101 m2/g) [25]. The offset in uptake values by these two different gas systems may relate to the role of dipolar versus van der Waals interactions for water vapour and nitrogen gas. The key role of dipolar interactions contributes to the structural changes known for biopolymer-water systems based on the swelling and dye adsorption results reported elsewhere [25] [26]. In addition, since diameter of water (0.20 nm) is less than the diameter of N2 (0.43 nm). It can be inferred that water molecules can access micropore sites with sizes smaller than 0.43 nm, while N2 has greater restrictions due to steric effects and weaker surface interactions. Thus, the sorption analysis provide complementary characterization of the material textural properties and surface adsorption sites, according to the nature of the adsorptive probe.
To provide a comparison of the surface area (SA) of different starch and cellulose biopolymers, selected examples of materials from the literature are listed in Table 4.
3.2. Zeta-Potential Values
The pH value at the point of zero charge (pHzpc) provides a means for understanding the electrostatic interactions between surfaces of the adsorbent and charged adsorbate species. Figure 5 shows pHzpc values versus pH using both acidic and basic conditions for AM, AM50, AP and CE. All samples were observed to possess a positive charge (ZPC > 0) in an acidic environment with different pHzpc values. As an example, the surface of cellulose has a negative x-value due to the abundant electron density of the polar groups and the role surface ionization effects of hydroxyl groups, especially when pH > pHzpc. In turn, the cellulose biopolymer surface has excess positive charge at pH < pHzpc, due to the adsorption of H+ ions at the Lewis base sites with high electron density.
Table 4. BET SA estimates of biopolymers from water vapour adsorption isotherms.

Figure 5. Point of zero charge (pzc) of the biopolymers using aqueous solutions at variable pH.
3.3. Adsorption of PNP
The absorbance of PNP was used to estimate the uptake properties of each system, where greater decolorization of the supernatant relates to higher uptake of PNP at pH 8.5. The adsorption isotherms (cf. Figure 6) for the three types of starch provided estimates of the uptake capacity (Qm) that adopted the following order: AM (9.82 mg/g) > AP (6.52 mg/g) > AM50 (3.82 mg/g). The relative ordering of the uptake for PNP differs from the water vapour results and can be related to the anion form of PNP and the role of biopolymer zeta-potential in aqueous media. The corresponding surface area (SA) of the adsorbent materials was estimated by use of the Qm value and Equation (3).
(3)
Qm is the monolayer adsorption capacity at equilibrium (mol/g), N is Avogadro’s number (6.02214 × 10²³ mol−1), δ is the cross-sectional molecular area of the adsorbate (m2), and Y is the coverage factor (Y = 1 for PNP). The molecular area (δ) is 52.5 Å2 for PNP when adsorbed in a co-planar orientation and 25.0 Å2 when adsorbed in an orthogonal arrangement relative to a planar surface. The corresponding SA values (m2/g) for AM (17.2), AP (11.4), and AM50 (5.62) compare favourably with the SA of cellulose (9.83 m2/g) by Udoetok et al. [31] based on dye adsorption isotherm results with PNP. This trend in SA for high amylose starch and other biopolymers are related to the relative accessibility surface chemical groups of the materials. While the accessibility of the surface O-H groups of AM is higher, it is noted that the SA estimates are lower in comparison with values obtained by water vapour adsorption (Table 3). It is important to note that the adsorbate-adsorbent interactions relate to the cohesive interactions in the medium, as evidenced by the different trends in uptake of gas phase versus liquid adsorbates. The reduced SA estimates by dye adsorption is consistent with the reduced uptake (lower Qm values) at these conditions due to

Figure 6. Sorptive uptake of PNP with (A) High Amylopectin (AP), (B) High Amylose (AM), and (C) Soluble starch (AM 50) at pH 8.5 and 295 K.
the role of hydration and electrostatic effects for the anion form of PNP and the negative x-value of the biopolymers.
3.4. Electromagnetic Interference (EMI) Shielding
The EMI shielding test was employed as a complementary technique to verify the level of sorbed polar solvent (W and/or E) onto the biopolymer materials. The trend in the EMI results (Figure 7) are in accordance with the swelling results reported elsewhere [25].
The EMI shielding technique was used previously [32] to characterize the amount of sorbed water in magnetic mesoporous photonic cellulose films. Water and ethanol have the ability to interact with the electromagnetic (EM) waves due to their dipolar nature. EMI SE, which is expressed in decibel (dB) units is defined by the logarithm of the ratio of the incident EM wave to the transmitted EM wave or log (incident EM wave/transmitted EM wave). EMI shielding in non-magnetic materials originates from the ohmic and polarization losses. The former arises from the dissipation of energy by free charge carriers/ions via conduction, hopping, and tunneling mechanisms, while the latter

Figure 7. Network analyzer results for the various biopolymers in the presence of neat solvents and a 50:50 water/ethanol mixture.
arises from the energy derived from the momentum required to reorient electric dipoles in each half cycle of an alternating field [33] [34]. If one assumes that the key difference among the polymers relates to the ohmic losses, it can be inferred that closely bound water constitutes a minor fraction of the overall fraction of bound water. As such, these two mechanisms can be employed to obtain crude estimates of the amount of sorbed water and/or ethanol by the sorbents. It follows that higher water and ethanol sorption denotes more ohmic and polarization losses, and thus higher EMI SE values as reported herein.
3.5. Isothermal Titration Calorimetry
Isothermal titration calorimetry (ITC) is useful for the direct determination of thermodynamic parameters (enthalpy, entropy, and stoichiometry) in macromolecular systems, especially for processes that undergo measureable changes between initial and final states that involve aggregation, absorption, and adsorption processes. In the case of adsorption processes that involve substantive changes in adsorbate-adsorbent interactions, ITC can aide in establishing structure-property relationships, especially for biopolymer hydration phenomena by analysis of the thermodynamic parameters. In this study, the thermal response of water vapour sorption for various biopolymers was estimated from the results in Figure 8. The use of ITC was surmised to provide further insight on the differences in sorption capacity of AM, AP, AM50, and CE.
The calculated values for the duration of the thermal response was estimated from the full-width-half-maximum (fwhm) of the exotherm events shown in the ITC profiles in Figure 8(A). The results are considered semi-quantitative due to a number of uncontrolled variables such as the sensitivity of the thermal response for such solid-vapour interactions. The trend in fwhm adopts the following order: AP > AM > AM50 > CE. The results generally follow the trends in solvent swelling and accessibility of the biopolymer -OH groups. However, the fwhm response also relate to the kinetics of heat and mass transfer during the water


Figure 8. (A) Isothermal titration calorimetry spectra, and (B) estimated heat of adsorption of the biopolymers.
vapour adsorption process, and should therefore not be over interpreted.
The area under the curve for each system can be related to the thermal behaviour of biopolymer-vapour adsorption process; however, the dosage level of vapour is unknown due to the continuous flow arrangement used herein. Notwithstanding, the conformational flexibility of the biopolymer backbone and presence of surface accessible biopolymer hydroxyl groups play a role. CE and AM50 show almost similar polar solvent interactions even though CE has fewer accessible surface -OH groups. The limited -OH group accessibility of CE is a consequence of its fibril structure and extensive inter/intra molecular hydrogen bonding [16]. Furthermore, the interaction of AM and AP starches with water vapour are influenced by tertiary structure (branching, conformation, and folding), since such factors govern the surface accessibility of the active adsorption sites.
The heat of adsorption was estimated from the area under the curve of the thermal profile under the curve. Some uncertainty regarding the biopolymer-water stoichiometry exists due to the nature of the experimental configuration for monitoring the thermal response of vapour adsorption among the samples. The comparable ITC response for AP and AM suggest that these biopolymers have similar hydrophilic nature due to their surface accessible -OH groups [35] [36]. The lower heat of adsorption for AM50 sample relates to the presence of linear and branched starch components which may reduce the accessibility of the adsorption sites and the water vapour adsorption properties. The exotherm response in Figure 8(B) indicates the release of heat (absolute values shown) upon water vapour adsorption for these materials. The heat of adsorption does not reach the value anticipated for the enthalpy of condensation at the saturation pressure of water vapour (−44 kJ/mol) [37]. Thus, the calorimetric response should be treated semi-quantitatively. The trend in ITC results provides complementary insight of the complex role of hydration for biopolymers with variable structure. However, a detailed analysis is precluded by the use of a continuum model for the analysis of the calorimetric response and the limited quantitative understanding of the biopolymer-water stoichiometry for the adsorption process. A detailed calorimetric investigation is underway to further characterize the thermodynamics of adsorption for such types of solid-vapour systems.
4. Conclusions
In this research, the adsorption properties of native biopolymers in water and ethanol solvents were studied in an effort to develop further insight on the complex relationship between biopolymer structure and adsorption properties. A study of the dye uptake properties using p-nitrophenol (PNP) was used to estimate the textural properties at equilibrium conditions and calculation of the biopolymer SA (m2/g), as follows: AM(17.23), AP(11.44), and AM50 (5.62). The monolayer adsorption capacity (Qm; mg/g) for the biopolymers at saturation conditions indicate that AM has the highest uptake of PNP among the system studied and confirm that the biopolymers possess variable textural and sorption properties according to the nature of the biopolymer-dye interactions. The water uptake results for starch and cellulose materials confirm starch has markedly greater uptake compared to cellulose, in accordance with the greater biopolymer textural properties and abundant surface -OH groups. It is noted that the biopolymer water vapour uptake is ca. two orders of magnitude higher (cf. Table 3) than that of either PNP or gaseous N2 [25] in agreement with the lower binding affinity expected for such adsorbates. The EMI shielding and ITC results provided complementary support for the role of favourable water adsorption for starch over cellulose in accordance with the calorimetric response to water vapour adsorption and trends in EMI shielding of the various biopolymer-solvent systems. The EMI results confirm that high amylose (AM) has the highest uptake of water compared to other biopolymers such as cellulose, in accordance with the relative accessibility of donor-acceptor site of the biopolymer.
This study provides insight on the adsorption properties of biopolymers through development of a greater understanding of the structure-function relationship among a diverse class of biopolymer systems. This study demonstrates that cellulose and starches have differing adsorption properties with model adsorbates in the condensed phase and the vapour state, in accordance with the role of solute-solvent, solute-solute, and solvent-solvent interactions. We anticipate that such complementary methods reported herein will add to a greater understanding of sorbent materials for advanced applications of biopolymer adsorbents in chemical separations, food chemistry, renewable fuels production, and environmental remediation.
Acknowledgements
The Natural Sciences and Engineering Research Council of Canada (NSERC) in the form of a Discovery Grant (Grant Number: RGPIN 2016-06197) and the Government of Saskatchewan (Ministry of Agriculture) through the Agriculture Development Fund (Project#: 20160266) are acknowledged for their support of this research.
Cite this paper
Dehabadi, L., Shakouri, M., Simonson, C.J., Arjmand, M., Sundararaj, U. and Wilson, L.D. (2018) Vapour and Solution Uptake Properties of Starch and Cellulose Biopolymers. Journal of Geoscience and Environment Protection, 6, 101-117. https://doi.org/10.4236/gep.2018.65009
References
- 1. Kraak, A. (1992) Industrial Applications of Potato Starch Products. Industrial Crops and Products, 1, 107-112. https://doi.org/10.1016/0926-6690(92)90007-I
- 2. Alcazar-Alay, S.C. and Meireles, M.A.A. (2015) Physicochemical Properties, Modifications and Applications of Starches from Different Botanical Sources. Food Science and Technology, 35, 215-236. https://doi.org/10.1590/1678-457X.6749
- 3. Laya, C.-H., Kuo, S.-Y., Sen, B., Chen, C.-C., Chang, J.-Sh. and Lin, C.-Y. (2012) Fermentative Biohydrogen Production from Starch-Containing Textile Wastewater. International Journal of Hydrogen Energy, 37, 2050-2057. https://doi.org/10.1016/j.ijhydene.2011.08.003
- 4. Singh, S., Gamlath, S. and Wakeling, L. (2007) Nutritional Aspects of Food Extrusion A Review. International Journal of Food Science and Technology, 42, 916-929. https://doi.org/10.1111/j.1365-2621.2006.01309.x
- 5. Singh, N., Singh, J., Kaur, L., Sodhi, N.S. and Gill, B.S. (2003) Morphological, Thermal and Rheological Properties of Starches from Different Botanical Sources. Food Chemistry, 81, 219-231. https://doi.org/10.1016/S0308-8146(02)00416-8
- 6. Yoshimoto, Y., Tashiro, J., Takenouchi, T. and Takeda, Y. (2000) Molecular Structure and Some Physicochemical Properties of High-Amylose Barley Starches. Cereal Chemistry, 77, 279-285. https://doi.org/10.1094/CCHEM.2000.77.3.279
- 7. Hizukuri, S. (1986) Polymodal Distribution of the Chain Length of Amylopectin and Its Significance. Carbohydrate Research, 141, 295-305. https://doi.org/10.1016/S0008-6215(00)90461-0
- 8. Pérez, S. and Bertoft, E. (2010) The Molecular Structures of Starch Components and Their Contribution to the Architecture of Starch Granules: A Comprehensive Review. Starch/Staerke, 62, 389-420. https://doi.org/10.1002/star.201000013
- 9. Imberty, A. and Perez, S. (1988) A Revisit to the Three-Dimensional Structure of B-Type Starch. Biopolymers, 27, 1205-1221. https://doi.org/10.1002/bip.360270803
- 10. Hoover, R. (2001) Composition, Molecular Structure, and Physicochemical Properties of Tuber and Root Starches: A Review. Carbohydrate Polymers, 45, 253-267. https://doi.org/10.1016/S0144-8617(00)00260-5
- 11. Tester, R.F., Debon, S.J.J. and Sommerville, M.D. (2000) Annealing of Maize Starch. Carbohydrate Polymers, 42, 287-299. https://doi.org/10.1016/S0144-8617(99)00170-8
- 12. Copeland, L., Blazek, J., Salman, H. and Tang, M.Ch. (2009) Form and Functionality of Starch. Food Hydrocolloids, 23, 1527-1534. https://doi.org/10.1016/j.foodhyd.2008.09.016
- 13. Xie, F., Yu, L., Su, B. and Chen, L. (2009) Rheological Properties of Starches with Different Amylose/Amylopectin Ratios. Journal of Cereal Science, 49, 371-377. https://doi.org/10.1016/j.jcs.2009.01.002
- 14. Somerville, C., Bauer, S., Brininstool, G., Facette, M., Hamann, T., Milne, J., Osborne, E., Paredez, A., Persson, S., Raab, T., Vorwerk, S. and Youngs, H. (2004) Toward a Systems Approach to Understanding Plant Cell Walls. Science, 306, 2206-2211. https://doi.org/10.1126/science.1102765
- 15. Prestwich, G.D., Marecak, D.M., Marecek, J.F., Vercruysse, K.P. and Ziebell, M.R. (1998) Controlled Chemical Modification of Hyaluronic Acid: Synthesis, Applications, and Biodegradation of Hydrazide Derivatives. Journal of Controlled Release, 53, 93-103. https://doi.org/10.1016/S0168-3659(97)00242-3
- 16. Udoetok, I.A., Wilson, L.D. and Headley, J.V. (2018) “Pillaring Effects” in Cross-Linked Cellulose Biopolymers: A Study of Structure and Properties. International Journal of Polymer Science, under review, and references cited therein.
- 17. Kocherbitov, V., Ulvenlund, S., Kober, M., Jarring, K. and Arnebrant, T. (2008) Hydration of Microcrystalline Cellulose and Milled Cellulose Studied by Sorption Calorimetry. Journal of Physical Chemistry B, 112, 3728-3734. https://doi.org/10.1021/jp711554c
- 18. Immergut, E.H., Ranby, B.G. and Mark, H.F. (1953) Recent Work on Molecular Weights of Cellulose. Journal of Industrial & Engineering Chemistry, 45, 2483-2490. https://doi.org/10.1021/ie50527a036
- 19. Guo, C., Zhou, L. and Lv, J. (2013) Effects of Expandable Graphite and Modified Ammonium Polyphosphate on the Flame-Retardant and Mechanical Properties of Wood Flour-Polypropylene Composites. Polymers & Polymer Composites, 21, 449-456.
- 20. Kirby, B.J. and Hasselbrink Jr., E.F. (2004) Zeta Potential of Microfluidic Substrates: 1. Theory, Experimental Techniques, and Effects on Separations. Electrophoresis, 25, 187-202. https://doi.org/10.1002/elps.200305754
- 21. Pratt, D.Y., Wilson, L.D. and Kozinski, J.A.J. (2013) Preparation and Sorption Studies of Glutaraldehyde Cross-Linked Chitosan Copolymers. Journal of Colloid and Interface Science, 395, 205-211. https://doi.org/10.1016/j.jcis.2012.12.044
- 22. Arjmand, M., Mahmoodi, M., Gelves, G.A., Park, S. and Sundararaj, U. (2011) Electrical and Electromagnetic Interference Shielding Properties of Flow-Induced Oriented Carbon Nanotubes in Polycarbonate. Carbon, 49, 3430-3440. https://doi.org/10.1016/j.carbon.2011.04.039
- 23. Note A. ,et al. (2007)Meas. Tech 2005, 1-32.
- 24. Kumar, P., Kim, K.-H., Kwon, E.E. and Szulejko, J.E. (2016) Metal-Organic Frameworks for the Control and Management of Air Quality: Advances and Future Direction. Journal of Materials Chemistry A, 4, 345-361. https://doi.org/10.1039/C5TA07068F
- 25. Dehabadi, L. and Wilson, L.D. (2014) Polysaccharide-Based Materials and Their Adsorption Properties in Aqueous Solution. Carbohydrate Polymers, 113, 471-479. https://doi.org/10.1016/j.carbpol.2014.06.083
- 26. Mohamed, M.H., Wilson, L.D., Headley, J.V. and Peru, K.M. (2011) Investigation of the Sorption Properties of β-Cyclodextrin-Based Polyurethanes with Phenolic Dyes and Naphthenates. Journal of Colloid and Interface Science, 356, 217-226. https://doi.org/10.1016/j.jcis.2010.11.002
- 27. Czepirski, L., Komorowska-Czepirska, E. and Szymońska, J. (2002) Fitting of Different Models for Water Vapour Sorption on Potato Starch Granules. Applied Surface Science, 196, 150-153. https://doi.org/10.1016/S0169-4332(02)00050-8
- 28. Zografi, G., Kontny, M.J., Yang, A.Y.S. and Brenner, G.S. (1984) Surface Area and Water Vapor Sorption of Microcrystalline Cellulose. International Journal of Pharmaceutics, 18, 99-116. https://doi.org/10.1016/0378-5173(84)90111-X
- 29. Hellman, N.N. and Melvin, E.H. (1950) Surface Area of Starch and Its Role in Water Sorption. Journal of the American Chemical Society, 72, 5186-5188. https://doi.org/10.1021/ja01167a110
- 30. Rowen, J.W. and Blaine, R.L. (1947) Sorption of Nitrogen and Water Vapor on Textile Fibers. Industrial & Engineering Chemistry, 39, 1659-1663. https://doi.org/10.1021/ie50456a029
- 31. Udoetok, I.A., Dimmick, R.M., Wilson, L.D. and Headley, J.V. (2016) Adsorption Properties of Cross-Linked Cellulose-Epichlorohydrin Polymers in Aqueous Solution. Carbohydrate Polymers, 136, 329-340. https://doi.org/10.1016/j.carbpol.2015.09.032
- 32. Giese, M., Blusch, L.K., Schlesinger, M., Meseck, G.R., Hamad, W.Y., Arjmand, M., Sundararaj, U. and MacLachlan, M.J. (2016) Magnetic Mesoporous Photonic Cellulose Films. Langmuir, 32, 9329-9334. https://doi.org/10.1021/acs.langmuir.6b02974
- 33. Paul, C.R. (2006) Intoduction to Electromagnetic Compatibility. John Wiley & Sons Inc., New Jersey.
- 34. Arjmand, M. and Sundararaj, U. (2015) Electromagnetic Interference Shielding of Nitrogen-Doped and Undoped Carbon Nanotube/Polyvinylidene Fluoride Nanocomposites: A Comparative Study. Composites Science and Technology, 118, 257-263. https://doi.org/10.1016/j.compscitech.2015.09.012
- 35. Van Den Berg, C., Kaper, F.S., Weldring, J.A.G. and Wolters, I. (1975) Water Binding by Potato Starch. International Journal of Food Science & Technology, 10, 589-602. https://doi.org/10.1111/j.1365-2621.1975.tb00067.x
- 36. Kulik, A.S. and Haverkamp, J. (1997) Molecular Mobility of Polysaccharide Chains in Starch Investigated by Two-Dimensional Solid-State NMR Spectroscopy. Carbohydrate Polymers, 34, 49-54. https://doi.org/10.1016/S0144-8617(97)00087-8
- 37. Drazin, J.W. and Castro, R.H.R. (2014) Water Adsorption Microcalorimetry Model: Deciphering Surface Energies of Water Chemical Potentials of Nanocrystalline Oxides. J. Phys. Chem. C, 118, 10131-10142. https://doi.org/10.1021/jp5016356