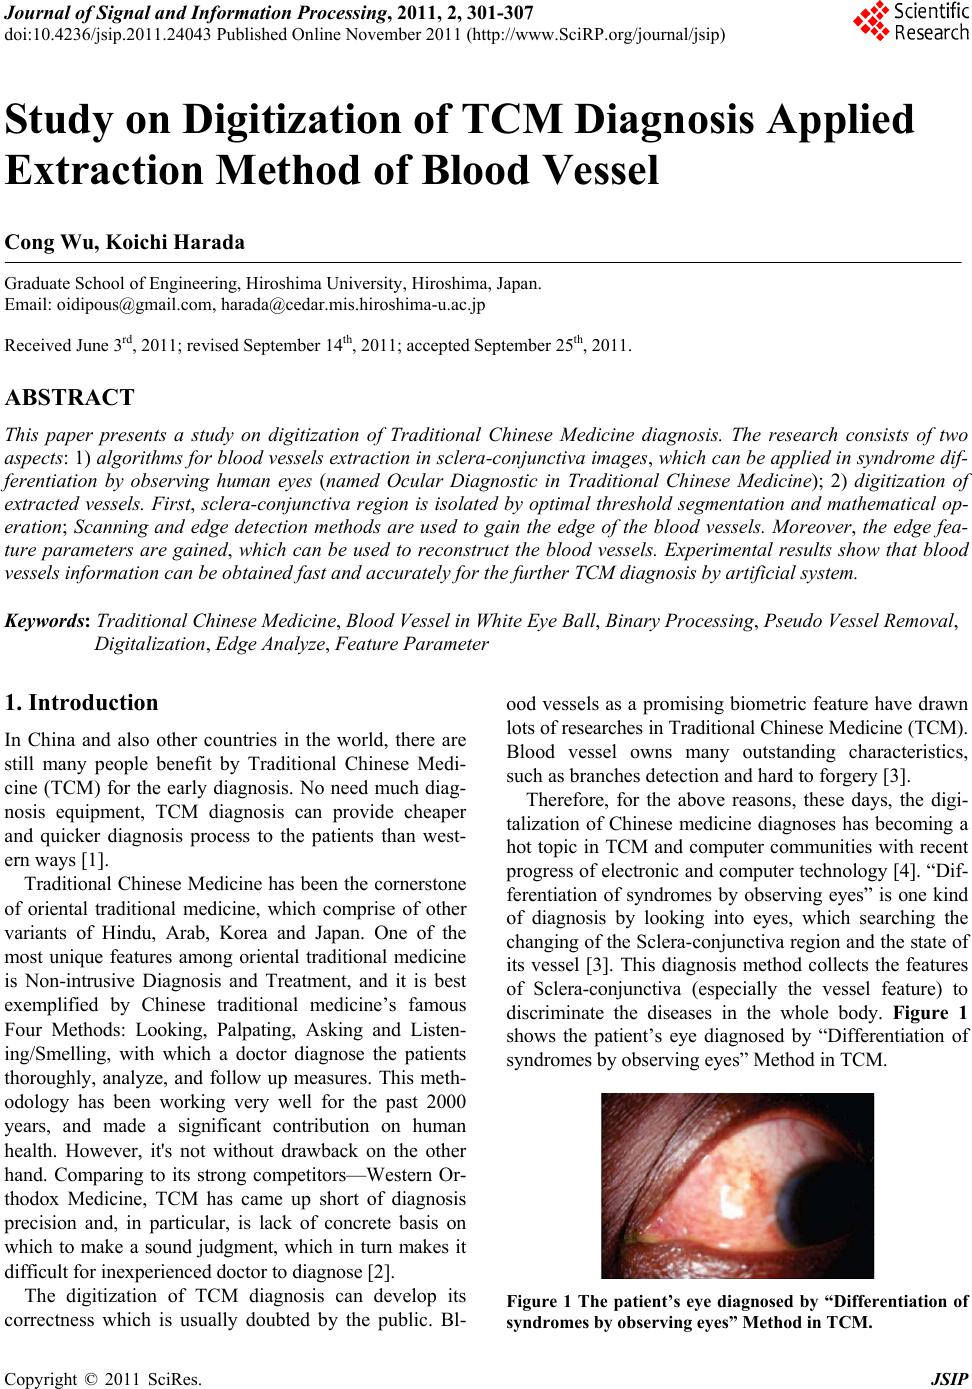
 Journal of Signal and Information Processing, 2011, 2, 301-307 doi:10.4236/jsip.2011.24043 Published Online November 2011 (http://www.SciRP.org/journal/jsip) Copyright © 2011 SciRes. JSIP 1 Study on Digitization of TCM Diagnosis Applied Extraction Method of Blood Vessel Cong Wu, Koichi Harada Graduate School of Engineering, Hiroshima University, Hiroshima, Japan. Email: oidipous@gmail.com, harada@cedar.mis.hiroshima-u.ac.jp Received June 3rd, 2011; revised September 14th, 2011; accepted S ept emb er 25 th, 2011. ABSTRACT This paper presents a study on digitization of Traditional Chinese Medicine diagnosis. The research consists of two aspects: 1) algorithms for blood vessels extraction in sclera-conjunctiva images, which can be applied in syndrome dif- ferentiation by observing human eyes (named Ocular Diagnostic in Traditional Chinese Medicine); 2) digitization of extracted vessels. First, sclera-conjunctiva region is isolated by optimal threshold segmentation and mathematical op- eration; Scanning and edge detection methods are used to gain the edge of the blood vessels. Moreover, the edge fea- ture parameters are gained, which can be used to reconstruct the blood vessels. Experimental results show that blood vessels information can be obtained fast and accurately for the further TCM diagnosis by artificial system. Keywords: Traditional Chinese Medicine, Blood Vessel in White Eye Ball, Binary Processing, Pseudo Vessel Removal, Digitalization, Edge Analyze, Feature Parameter 1. Introduction In China and also other countries in the world, there are still many people benefit by Traditional Chinese Medi- cine (TCM) for the early diagnosis. No need much diag- nosis equipment, TCM diagnosis can provide cheaper and quicker diagnosis process to the patients than west- ern ways [1]. Traditional Chinese Medicine has been the cornerstone of oriental traditional medicine, which comprise of other variants of Hindu, Arab, Korea and Japan. One of the most unique features among oriental traditional medicine is Non-intrusive Diagnosis and Treatment, and it is best exemplified by Chinese traditional medicine’s famous Four Methods: Looking, Palpating, Asking and Listen- ing/Smelling, with which a doctor diagnose the patients thoroughly, analyze, and follow up measures. This meth- odology has been working very well for the past 2000 years, and made a significant contribution on human health. However, it's not without drawback on the other hand. Comparing to its strong competitors—Western Or- thodox Medicine, TCM has came up short of diagnosis precision and, in particular, is lack of concrete basis on which to make a sound judgment, which in turn makes it difficult for inexperienced doctor to diag nose [2]. The digitization of TCM diagnosis can develop its correctness which is usually doubted by the public. Bl- ood vessels as a promising biometric feature have drawn lot s of research es in Traditio n al Chin es e Me d icine (TC M). Blood vessel owns many outstanding characteristics, such as branches detection and hard to forgery [3]. Therefore, for the above reasons, these days, the digi- talization of Chinese medicine diagnoses has becoming a hot topic in TCM and computer communities with recent progress of electronic and computer technology [4]. “Dif- ferentiation of syndromes by observing eyes” is one kind of diagnosis by looking into eyes, which searching the changing of the Sclera-conjunctiva region and the state of its vessel [3]. This diagnosis method collects the features of Sclera-conjunctiva (especially the vessel feature) to discriminate the diseases in the whole body. Figure 1 shows the patient’s eye diagnosed by “Differentiation of syndromes by obser vi ng ey es” Method in T C M. Figure 1 The patient’s eye diagnosed by “Differentiation of syndromes by observing eyes” Method in TCM. 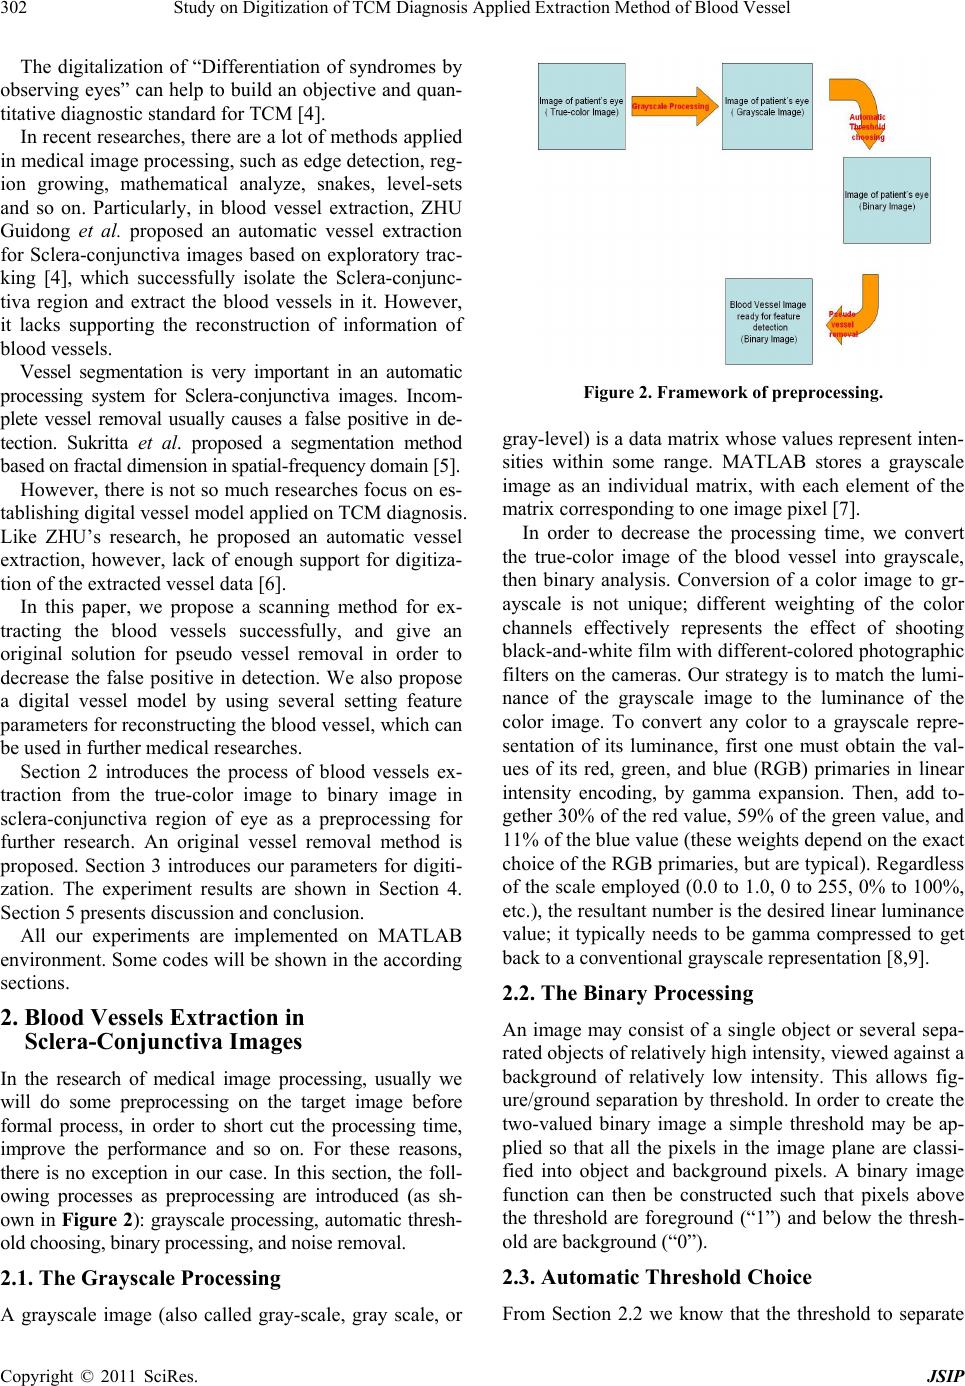 Study on Digitization of TCM Diagnosis Applied Extraction Method of Blood Vessel 302 The digitalization of “Differentiation of syndromes by observing eyes” can help to build an objective and quan- titative diagnostic stan dard for TCM [4]. In recent researches, there are a lot of methods app lied in medical image processing, such as edge detection, reg- ion growing, mathematical analyze, snakes, level-sets and so on. Particularly, in blood vessel extraction, ZHU Guidong et al. proposed an automatic vessel extraction for Sclera-conjunctiva images based on exploratory trac- king [4], which successfully isolate the Sclera-conjunc- tiva region and extract the blood vessels in it. However, it lacks supporting the reconstruction of information of blood vessels. Vessel segmentation is very important in an automatic processing system for Sclera-conjunctiva images. Incom- plete vessel removal usually causes a false positive in de- tection. Sukritta et al. proposed a segmentation method based on fractal dimension in spatial-frequency dom ain [5]. However, there is not so much researches focus on es- tablishing digital vessel model applied on TCM diagnosis. Like ZHU’s research, he proposed an automatic vessel extraction, however, lack of enough support for digitiza- tion of the extracted vessel data [6]. In this paper, we propose a scanning method for ex- tracting the blood vessels successfully, and give an original solution for pseudo vessel removal in order to decrease the false positive in detection. We also propose a digital vessel model by using several setting feature parameters for reconstructing the blood vessel, which can be used in further medical researches. Section 2 introduces the process of blood vessels ex- traction from the true-color image to binary image in sclera-conjunctiva region of eye as a preprocessing for further research. An original vessel removal method is proposed. Section 3 introduces our parameters for digiti- zation. The experiment results are shown in Section 4. Section 5 presents di scussion and conclusi o n . All our experiments are implemented on MATLAB environment. Some codes will be shown in the according sections. 2. Blood Vessels Extraction in Sclera-Conjunctiva Images In the research of medical image processing, usually we will do some preprocessing on the target image before formal process, in order to short cut the processing time, improve the performance and so on. For these reasons, there is no exception in our case. In this section, the foll- owing processes as preprocessing are introduced (as sh- own in Figure 2): grayscale processing, automatic thresh- old choosing, binary processi ng, and noise removal . 2.1. The Grayscale Processing A grayscale image (also called gray-scale, gray scale, or Figure 2. Framework of preprocessing. gray-level) is a data matrix whose values repr esent inten- sities within some range. MATLAB stores a grayscale image as an individual matrix, with each element of the matrix corresponding to one image pixel [7]. In order to decrease the processing time, we convert the true-color image of the blood vessel into grayscale, then binary analysis. Conversion of a color image to gr- ayscale is not unique; different weighting of the color channels effectively represents the effect of shooting black-and-white film with different-colored photographic filters on the cameras. Our strategy is to match the lumi- nance of the grayscale image to the luminance of the color image. To convert any color to a grayscale repre- sentation of its luminance, first one must obtain the val- ues of its red, green, and blue (RGB) primaries in linear intensity encoding, by gamma expansion. Then, add to- gether 30 % of the red va lue, 59% of th e green valu e, and 11% of the blue value (these weights depend on the exact choice of the RGB primaries, but are typical). Regardless of the scale employed (0.0 to 1.0, 0 to 255, 0% to 100%, etc.), the resultant number is the desired linear luminance value; it typically needs to be gamma compressed to get back to a convention a l grayscale representation [8,9]. 2.2. The Binary Processing An image may consist of a single object or several sepa- rated objects of relatively high intensity, viewed against a background of relatively low intensity. This allows fig- ure/ground separation by threshold. In order to create the two-valued binary image a simple threshold may be ap- plied so that all the pixels in the image plane are classi- fied into object and background pixels. A binary image function can then be constructed such that pixels above the threshold are foreground (“1”) and below the thresh- old are background (“0”). 2.3. Automatic Threshold Choice From Section 2.2 we know that the threshold to separate Copyright © 2011 SciRes. JSIP 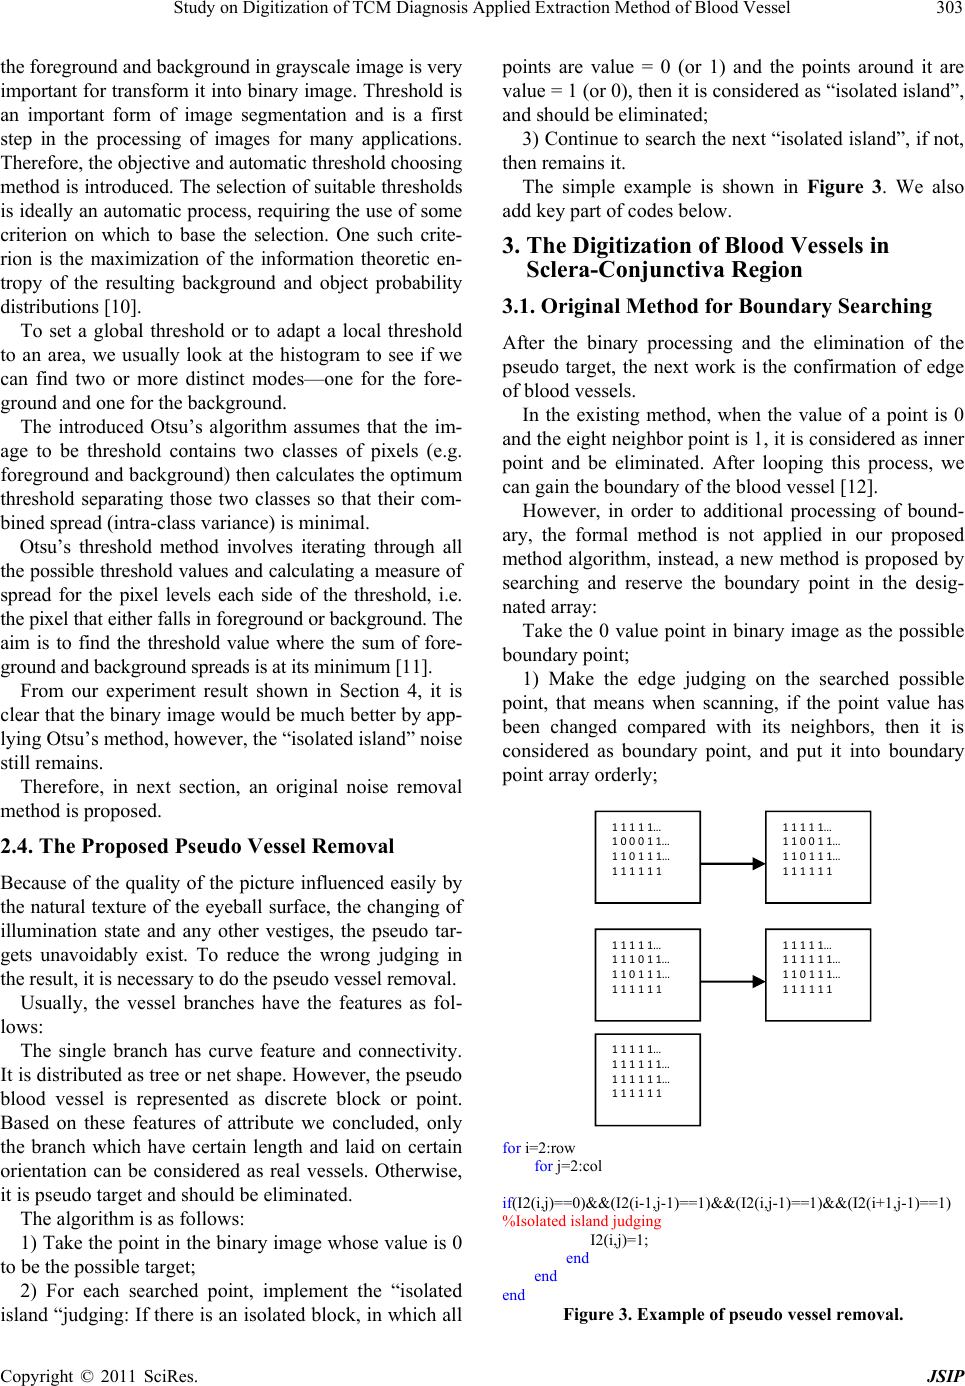 Study on Digitization of TCM Diagnosis Applied Extraction Method of Blood Vessel303 the foreground and background in grayscale image is very important for transform it into binary image. Threshold is an important form of image segmentation and is a first step in the processing of images for many applications. Therefore, the objective and automatic thresho ld ch oosing method is introduced. The selection of suitable thresholds is ideally an automatic process, requiring the use of some criterion on which to base the selection. One such crite- rion is the maximization of the information theoretic en- tropy of the resulting background and object probability distributi ons [1 0] . To set a global threshold or to adapt a local threshold to an area, we usually look at the histogram to see if we can find two or more distinct modes—one for the fore- ground and one for the backgr ound. The introduced Otsu’s algorithm assumes that the im- age to be threshold contains two classes of pixels (e.g. foreground and background ) then calculates th e optimum threshold separating those two classes so that their com- bined spread (intra-class variance) is minimal. Otsu’s threshold method involves iterating through all the possible threshold values and calculating a measure of spread for the pixel levels each side of the threshold, i.e. the pixel that either falls in foreground or background. The aim is to find the threshold value where the sum of fore- ground and background spreads i s at it s minim um [11]. From our experiment result shown in Section 4, it is clear that the binary image would be much better by app- lying Otsu’s method , however, the “isolated island” noise still remains. Therefore, in next section, an original noise removal method is proposed. 2.4. The Proposed Pseudo Vessel Removal Because of the quality of the picture influenced easily by the natural texture of the eyeball surface, the changing of illumination state and any other vestiges, the pseudo tar- gets unavoidably exist. To reduce the wrong judging in the result, it is necessary to do the pseudo vessel removal. Usually, the vessel branches have the features as fol- lows: The single branch has curve feature and connectivity. It is distributed as tree or net shape. However, the pseudo blood vessel is represented as discrete block or point. Based on these features of attribute we concluded, only the branch which have certain length and laid on certain orientation can be considered as real vessels. Otherwise, it is pseudo target and should be eliminated. The algorithm is as follows: 1) Take the point in the binary image whose value is 0 to be the possible target; 2) For each searched point, implement the “isolated island “judging: If there is an isolated block, in which all points are value = 0 (or 1) and the points around it are value = 1 (or 0), then it is considered as “isolated island”, and should be eliminated; 3) Continue to search the next “isolated island”, if not, then remains it. The simple example is shown in Figure 3. We also add key part of codes below. 3. The Digitization of Blood Vessels in Sclera-Conjunctiva Region 3.1. Original Method for Boundary Searching After the binary processing and the elimination of the pseudo target, the next work is the confirmation of edge of blood vessels. In the existing method, when the value of a point is 0 and the eight neighbor point is 1 , it is considered as inn er point and be eliminated. After looping this process, we can gain the boundary of the blood vessel [12]. However, in order to additional processing of bound- ary, the formal method is not applied in our proposed method algorithm, instead, a new method is proposed by searching and reserve the boundary point in the desig- nated array: Take the 0 value point in binary image as the possible boundary point; 1) Make the edge judging on the searched possible point, that means when scanning, if the point value has been changed compared with its neighbors, then it is considered as boundary point, and put it into boundary point array orderly; 11111… 100011… 110111… 111111 11111… 110011… 110111… 111111 11111… 111011… 110111… 111111 11111… 111111… 110111… 111111 11111… 111111… 111111… 111111 for i=2:row for j=2:col if(I2(i,j)==0)&&(I2(i-1,j-1)==1)&&(I2(i,j-1)==1)&&(I2(i+1,j-1)==1) %Isolated island judging I2(i,j)=1; end end end Figure 3. Example of pseudo vessel removal. Copyright © 2011 SciRes. JSIP 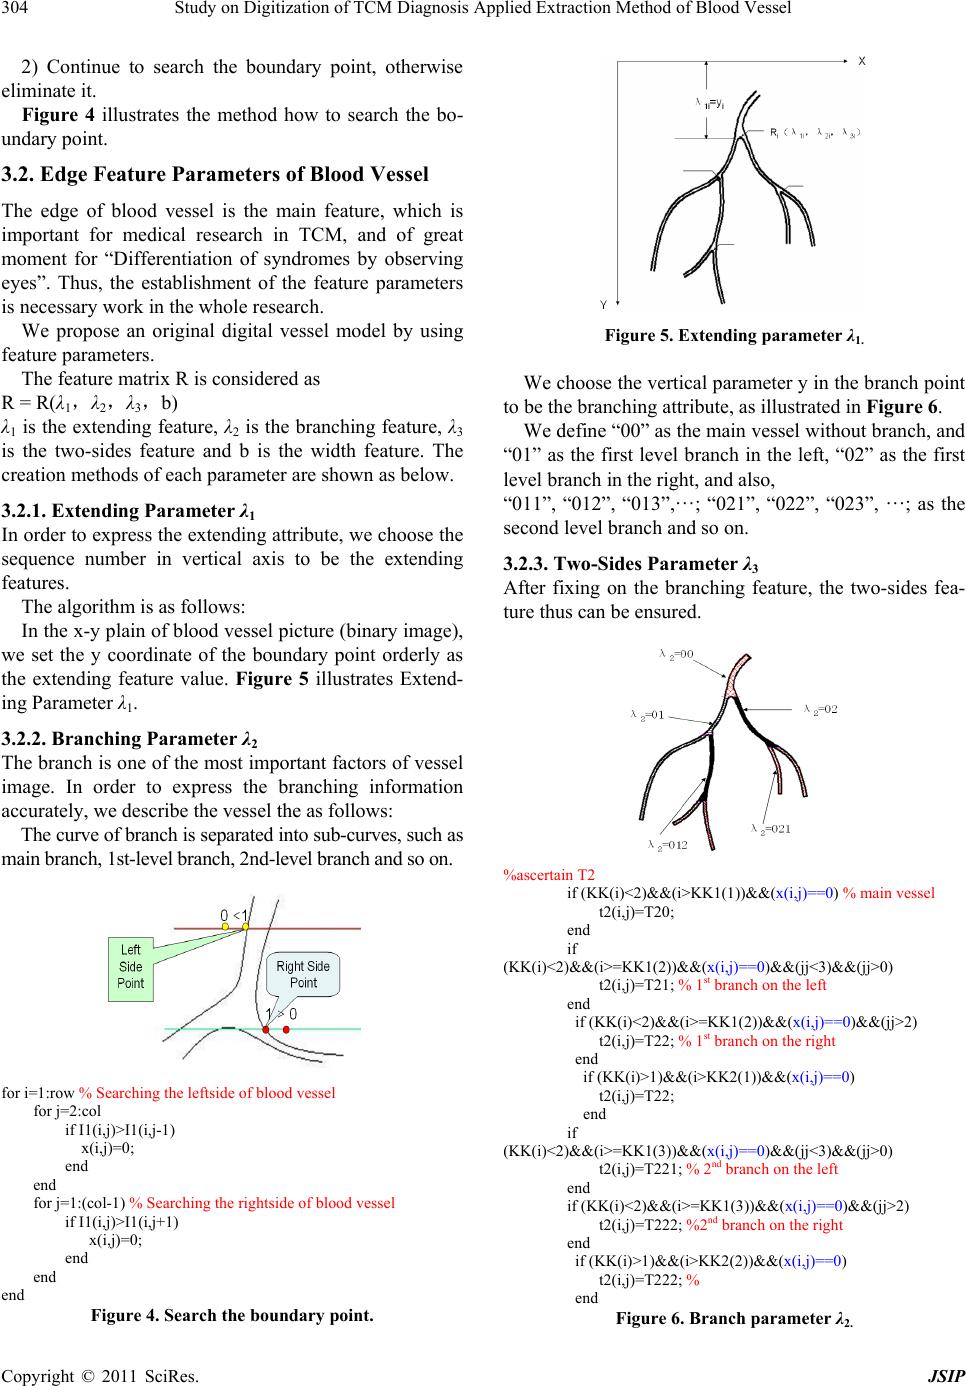 Study on Digitization of TCM Diagnosis Applied Extraction Method of Blood Vessel 304 2) Continue to search the boundary point, otherwise eliminate it. Figure 4 illustrates the method how to search the bo- undary point. 3.2. Edge Feature Parameters of Blood Vessel The edge of blood vessel is the main feature, which is important for medical research in TCM, and of great moment for “Differentiation of syndromes by observing eyes”. Thus, the establishment of the feature parameters is necessary work in the whole research. We propose an original digital vessel model by using feature parameters. The feature matrix R is considered as R = R(λ1,λ2,λ3,b) λ1 is the extending feature, λ2 is the branching feature, λ3 is the two-sides feature and b is the width feature. The creation methods of each parameter are shown as below. 3.2.1. Extending Parameter λ1 In order to express the extending attribute, we choose the sequence number in vertical axis to be the extending features. The algorithm is as follows: In the x-y plain of blood vessel picture (binary image), we set the y coordinate of the boundary point orderly as the extending feature value. Figure 5 illustrates Extend- ing Parameter λ1. 3.2.2. Branching Parameter λ2 The branch is one of the most important factors of vessel image. In order to express the branching information accurately, we describe the vessel the as follows: The curve of branch is separated into sub-curves, such as main branch, 1st-level branch, 2nd-level branch and so on. for i=1:row % Searching the leftside of blood vessel for j=2:col if I1(i,j)>I1(i,j-1) x(i,j)=0; end end for j=1:(col-1) % Searching the rightside of blood vessel if I1(i,j)>I1(i,j+1) x(i,j)=0; end end end Figure 4. Search the boundary point. Figure 5. Extending parameter λ1. We choose the vertical parameter y in the branch point to be the branching attribute, as illustrated in Figure 6. We define “00” as the main vessel w ithout bran ch, and “01” as the first level branch in the left, “02” as the first level branch in the right, and also, “011”, “012”, “013”,…; “021”, “022”, “023”, …; as the second level branch and so on. 3.2.3. Two-Sides Parameter λ3 After fixing on the branching feature, the two-sides fea- ture thus can be ensured. %ascertain T2 if (KK(i)<2)&&(i>KK1(1))&&(x(i,j)==0) % main vessel t2(i,j)=T20; end if (KK(i)<2)&&(i>=KK1(2))&&(x(i,j)==0)&&(jj<3)&&(jj>0) t2(i,j)=T21; % 1st branch on the left end if (KK(i)<2)&&(i>=KK1(2))&&(x(i,j)==0)&&(jj>2) t2(i,j)=T22; % 1st branch on the right end if (KK(i)>1)&&(i>KK2(1))&&(x(i,j)==0) t2(i,j)=T22; end if (KK(i)<2)&&(i>=KK1(3))&&(x(i,j)==0)&&(jj<3)&&(jj>0) t2(i,j)=T221; % 2nd branch on the left end if (KK(i)<2)&&(i>=KK1(3))&&(x(i,j)==0)&&(jj>2) t2(i,j)=T222; %2nd branch on the right end if (KK(i)>1)&&(i>KK2(2))&&(x(i,j)==0) t2(i,j)=T222; % end Figure 6. Branch parameter λ2. Copyright © 2011 SciRes. JSIP 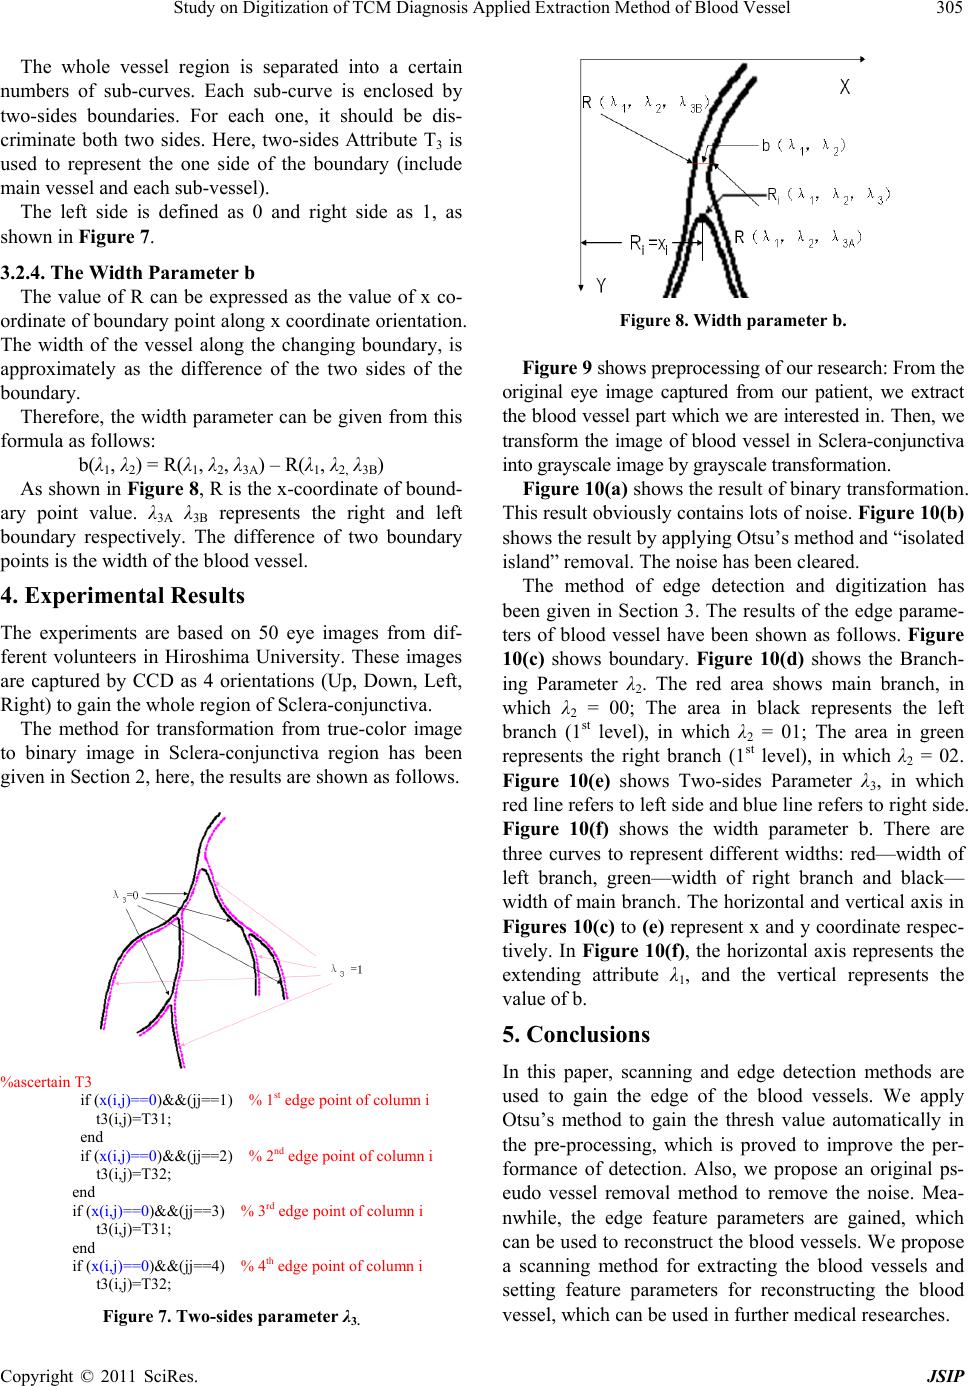 Study on Digitization of TCM Diagnosis Applied Extraction Method of Blood Vessel305 The whole vessel region is separated into a certain numbers of sub-curves. Each sub-curve is enclosed by two-sides boundaries. For each one, it should be dis- criminate both two sides. Here, two-sides Attribute T3 is used to represent the one side of the boundary (include main vessel and each sub-vessel). The left side is defined as 0 and right side as 1, as shown in Figure 7. 3.2.4. The Width Parameter b The value of R can be expressed as the value of x co- ordinate of boundary point along x coordinate orientation. The width of the vessel along the changing boundary, is approximately as the difference of the two sides of the boundary. Therefore, the width parameter can be given from this formula as follows: b(λ1, λ2) = R(λ1, λ2, λ3A) – R(λ1, λ2, λ3B) As shown in Figure 8, R is the x-coordinate of bound- ary point value. λ3A λ3B represents the right and left boundary respectively. The difference of two boundary points is the width of the blood vessel. 4. Experimental Results The experiments are based on 50 eye images from dif- ferent volunteers in Hiroshima University. These images are captured by CCD as 4 orientations (Up, Down, Left, Right) to gain the wh ol e region of Sclera-co n ju ncti va. The method for transformation from true-color image to binary image in Sclera-conjunctiva region has been given in Section 2, here, the results are shown as follows. %ascertain T3 if (x(i,j)==0)&&(jj==1) % 1st edge point of column i t3(i,j)=T31; end if (x(i,j)==0)&&(jj==2) % 2nd edge point of column i t3(i,j)=T32; end if (x(i,j)==0)&&(jj==3) % 3 rd edge point of column i t3(i,j)=T31; end if (x(i,j)==0)&&(jj==4) % 4 th edge point of column i t3(i,j)=T32; Figure 7. Two-sides parameter λ3. Figure 8. Width parameter b. Figure 9 shows preprocessing of our research: From the original eye image captured from our patient, we extract the blood vessel part which we are interested in. Then, we transform the image of blood vessel in Sclera-conjunctiva into grayscale image by grayscale transformation. Figure 10(a) shows the result of bin ary tran sformati on. This result obviously contain s lots of noise. Figure 10(b) shows the result by applying Otsu’s method and “isolated island” removal. The noise has been cleared. The method of edge detection and digitization has been given in Section 3. The results of the edge parame- ters of blood vessel have been shown as follows. Figure 10(c) shows boundary. Figure 10(d) shows the Branch- ing Parameter λ2. The red area shows main branch, in which λ2 = 00; The area in black represents the left branch (1st level), in which λ2 = 01; The area in green represents the right branch (1st level), in which λ2 = 02. Figure 10(e) shows Two-sides Parameter λ3, in which red line refers to left side and blue line refers to right side. Figure 10(f) shows the width parameter b. There are three curves to represent different widths: red—width of left branch, green—width of right branch and black— width of main branch. Th e horizontal and vertical axis in Figures 10(c) to (e) represent x and y coordinate r espec- tively. In Figure 10(f), the horizontal axis represents the extending attribute λ1, and the vertical represents the value of b. 5. Conclusions In this paper, scanning and edge detection methods are used to gain the edge of the blood vessels. We apply Otsu’s method to gain the thresh value automatically in the pre-processing, which is proved to improve the per- formance of detection. Also, we propose an original ps- eudo vessel removal method to remove the noise. Mea- nwhile, the edge feature parameters are gained, which can be used to reconstruct the blood vessels. We propose a scanning method for extracting the blood vessels and setting feature parameters for reconstructing the blood vessel, which can be used in further medical researches. Copyright © 2011 SciRes. JSIP  Study on Digitization of TCM Diagnosis Applied Extraction Method of Blood Vessel Copyright © 2011 SciRes. JSIP 306 Figure 9. Preprocessing. (a) (b) (c) (d) (e) (f) Figure 10. Experimental results in MATLAB. (a) Binary image with noise; (b) Binary image (after noise removal); (c) Boundary; (d) Branching parameter λ2; (e) Two-si des parameter λ3; (f) Width parameter b. Another contribution is we establish an original digital vessel model by using the attribute parameters we pro- posed, which can represent the vessel features directly. In light of the experimental results of this work, the following conclusions can be drawn. 1) When comparing the results provided in Figure 10(d) to Figure 10(e), it can be found that the method to removal the pseudo vessel is effective. 2) Digitization method of blood vessel in sclera-con- junctiva image is presented in the paper; from sclera- conjunctiva original image to profile parameters obtained, is achieved successfully. With these result, we are able to not only get an un- precedented hig h quality image of blood vessel o f patien t, but also better explain to the patients of their symptoms, store and transfer all pertaining information readily. As our future work, we will completely study on the relationship between the parameters retrieved by our extraction and the diagnostic from human beings. The objective and quantitative result is expected to be given for the further objective—computer-aided diagnosis in TCM.  Study on Digitization of TCM Diagnosis Applied Extraction Method of Blood Vessel307 6. Acknowledgements The authors would like to acknowledge all the anony- mous reviewers gratefully for their carefully considered feedback and valuable comments. The modification is due to their effort. REFERENCES [1] J. J. Wang, “The Theory of Differentiation of Syndromes by Observing Eyes in Traditional Chinese Medicine,” Chinese Journal of Basic Medicine in Traditional Chi- nese Medicine, Vol. 11, No. 5, 2005, pp. 324-325. [2] D. L. Zheng and Z. F. Zheng, “Ocular Diagnostic-Under- stand Fully at a Glance and Diagnose Patient’s Disease,” Liaoning Science and Technology Publishing House, Liaoning, 2003. [3] D. L. Zheng, “Complete Guide to Visualized Diagnostics via Eye Study,” Liaoning Science and Technology Pub- lishing House, Liaoning, 2008. [4] G. D. Zhu, “Research on the Digitalization Technology of ‘Differentiation of Syndromes by Observing Eyes’,” Doc- toral Dissertation, Graduate University of Chinese Acad- emy of Sciences, 2006. [5] S. Paripurana, W. Chiracharit, K. Chamnongthai and K. Higuchi, “Retinal Blood Vessel Segmentation Based on Fractal Dimension in Spatial-Frequency Domain”, 10th International Symposium on Communications and Infor- mation Technologies, Tokyo, 26-29 October 2010, pp. 1185- 1190. [6] G. D. Zhu, L. Shen and J. J. Wang, “Automatic Vessel Extraction for Sclera-Conjunctiva Images Based on Ex- ploratory Tracking,” Computer Engineering, Vol. 31, No. 17, 2005, pp. 6-8. [7] R. C. Gonzalez, R. E. Woods and S. L. Eddins, “Digital Image Processing Using MATLAB,” Prentice Hall, Up- per Saddle River, 2003. [8] J. Canny, “A Computational Approach for Edge Detec- tion,” IEEE Transactions on Pattern Analysis and Ma- chine Intelligence, Vol. 8, No. 6, 1986, pp.679-698. doi:10.1109/TPAMI.1986.4767851 [9] R. C. Gonzalez and R. E. Woods, “Digital Image Proc- essing,” 2nd Edition, Prentice Hall, Upper Saddle River, 2002. [10] A. D. Brinka, “Thresholding of Digital Image s Using Two- Dimen sional Entropies,” Pattern Recognition, Vol. 25, No. 8, 1992, pp. 803-808. doi:10.1016/0031-3203(92)90034-G [11] N. Otsu, “A Threshold Selection Method from Gray- Level Histograms,” IEEE Transactions on Systems, Man and Cybernetics, Vol. 9, 1979, pp. 62-66. [12] Y. Sun, “Automatic Identification of Vessel Contours in Coronary Arteriograms by an Adaptive Tracking Algo- rithm,” IEEE Transactions on Medical Imaging, Vol. 8, No. 1, 1989, pp. 78-88. Copyright © 2011 SciRes. JSIP
|