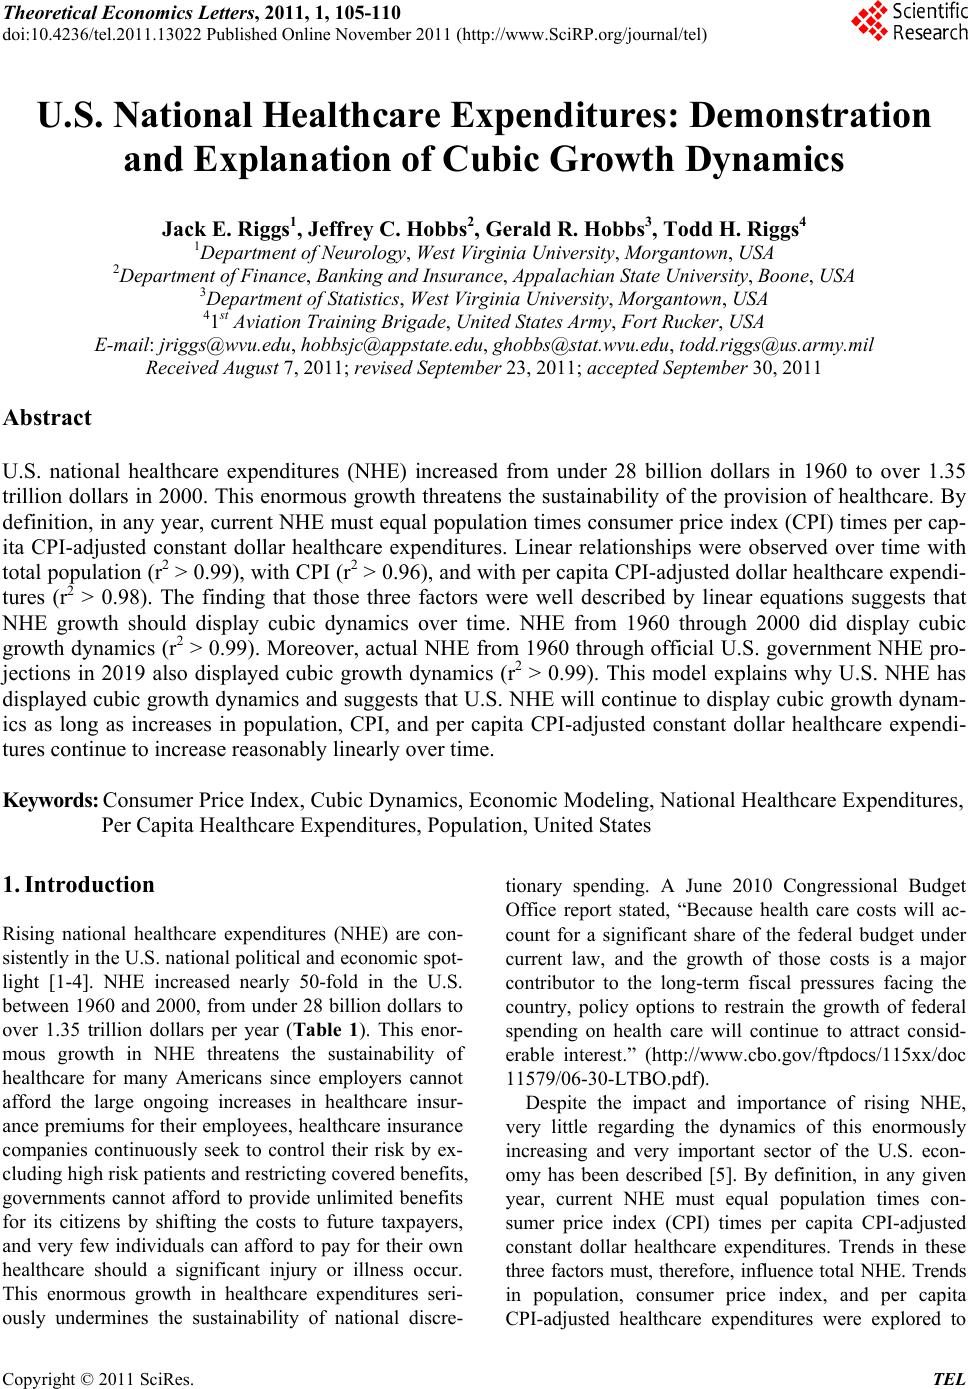
 Theoretical Economics Letters, 2011, 1, 105-110 doi:10.4236/tel.2011.13022 Published Online November 2011 (http://www.SciRP.org/journal/tel) Copyright © 2011 SciRes. TEL U.S. National Healthcare Expenditures: Demonstration and Explanation of Cubic Growth Dynamics Jack E. Riggs1, Jeffrey C. Hobbs2, Gerald R. Hobbs3, Todd H. Riggs4 1Department of Neurology, West Virginia University, Morgantown, USA 2Departme n t of Finance , Banking and Insurance, Appalachian State University, Boone, USA 3Department of Stat i s t i c s, West Virginia University, Morgantown, USA 41st Aviation Traini n g Brigade, United St at es Army, Fort Rucker, USA E-mail: jriggs@wvu.edu, hobbsjc@appstate.edu, ghobbs@stat.wvu.edu, todd.riggs@us.army.mil Received August 7, 2011; revised September 23 , 20 1 1; accepted September 30, 2011 Abstract U.S. national healthcare expenditures (NHE) increased from under 28 billion dollars in 1960 to over 1.35 trillion dollars in 2000. This enormous growth threatens the sustainability of the provision of healthcare. By definition, in any year, current NHE must equal population times consumer price index (CPI) times per cap- ita CPI-adjusted constant dollar healthcare expenditures. Linear relationships were observed over time with total population (r2 > 0.99), with CPI (r2 > 0.96), and with per capita CPI-adjusted dollar healthcare expendi- tures (r2 > 0.98). The finding that those three factors were well described by linear equations suggests that NHE growth should display cubic dynamics over time. NHE from 1960 through 2000 did display cubic growth dynamics (r2 > 0.99). Moreover, actual NHE from 1960 through official U.S. government NHE pro- jections in 2019 also displayed cubic growth dynamics (r2 > 0.99). This model explains why U.S. NHE has displayed cubic growth dynamics and suggests that U.S. NHE will continue to display cubic growth dynam- ics as long as increases in population, CPI, and per capita CPI-adjusted constant dollar healthcare expendi- tures continue to increase reasonably linearly over time. Keywords: Consumer Price Index, Cubic Dynamics, Economic Modeling, National Healthcare Expenditures, Per Capita Healthcare Expenditures, Population, United States 1. Introduction Rising national healthcare expenditures (NHE) are con- sistently in the U.S. national political and economic spot- light [1-4]. NHE increased nearly 50-fold in the U.S. between 1960 and 2000, from under 28 billion dollars to over 1.35 trillion dollars per year (Table 1). This enor- mous growth in NHE threatens the sustainability of healthcare for many Americans since employers cannot afford the large ongoing increases in healthcare insur- ance premiums for their employees, healthcare insurance companies continuously seek to control their risk by ex- cluding high risk patients and restricting covered benefits, governments cannot afford to provide unlimited benefits for its citizens by shifting the costs to future taxpayers, and very few individuals can afford to pay for their own healthcare should a significant injury or illness occur. This enormous growth in healthcare expenditures seri- ously undermines the sustainability of national discre- tionary spending. A June 2010 Congressional Budget Office report stated, “Because health care costs will ac- count for a significant share of the federal budget under current law, and the growth of those costs is a major contributor to the long-term fiscal pressures facing the country, policy options to restrain the growth of federal spending on health care will continue to attract consid- erable interest.” (http://www.cbo.gov/ftpdocs/115xx/doc 11579/06-30-LTBO.pdf). Despite the impact and importance of rising NHE, very little regarding the dynamics of this enormously increasing and very important sector of the U.S. econ- omy has been described [5]. By definition, in any given year, current NHE must equal population times con- sumer price index (CPI) times per capita CPI-adjusted constant dollar healthcare expenditures. Trends in these three factors must, therefore, influence total NHE. Trends in population, consumer price index, and per capita CPI-adjusted healthcare expenditures were explored to 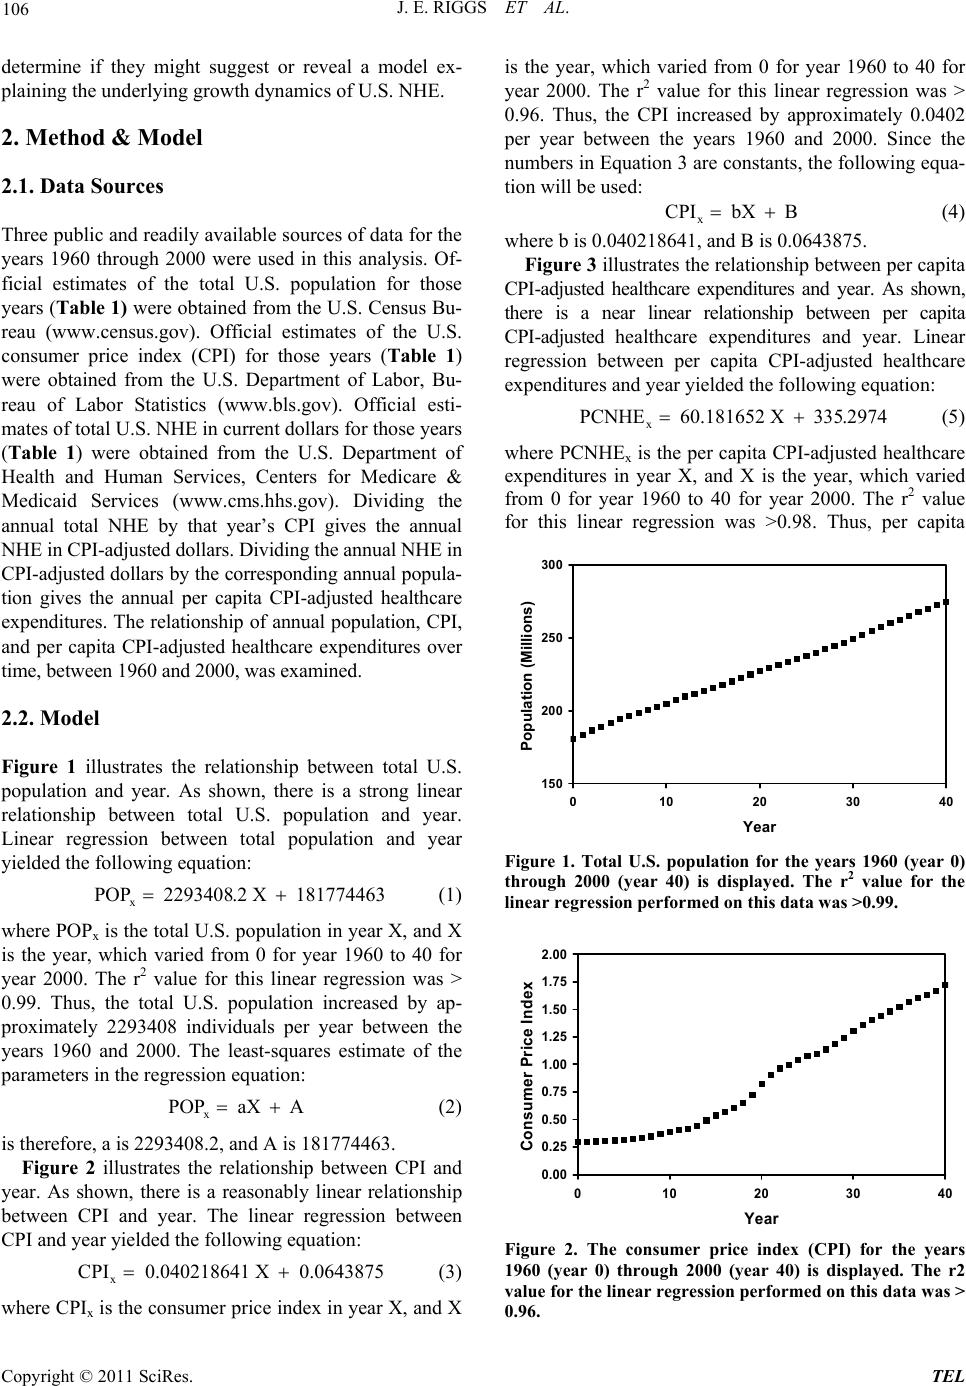 J. E. RIGGS ET AL. 106 determine if they might suggest or reveal a model ex- plainin g the underly i ng growt h d y n amics of U.S . NH E. 2. Method & Model 2.1. Data Sources Three public and readily available sources of data for the years 1960 through 2000 were used in this analysis. Of- ficial estimates of the total U.S. population for those years (Table 1) were obtained fro m the U.S. Census Bu- reau (www.census.gov). Official estimates of the U.S. consumer price index (CPI) for those years (Table 1) were obtained from the U.S. Department of Labor, Bu- reau of Labor Statistics (www.bls.gov). Official esti- mates of total U.S. NHE in current dollars fo r tho se years (Table 1) were obtained from the U.S. Department of Health and Human Services, Centers for Medicare & Medicaid Services (www.cms.hhs.gov). Dividing the annual total NHE by that year’s CPI gives the annual NHE in CPI-adjusted dollars. Dividing the annual NHE in CPI-adjusted dollars by the corresponding annual popula- tion gives the annual per capita CPI-adjusted healthcare expenditures. The relationship of annual population, CPI, and per capita CPI-adjusted healthcare expenditures over time, between 1960 a nd 20 00, was examined. 2.2. Model Figure 1 illustrates the relationship between total U.S. population and year. As shown, there is a strong linear relationship between total U.S. population and year. Linear regression between total population and year yielded the following equation: x POP 2293408.2 X 181774463 (1) where POPx is the total U.S. population in year X, and X is the year, which varied from 0 for year 1960 to 40 for year 2000. The r2 value for this linear regression was > 0.99. Thus, the total U.S. population increased by ap- proximately 2293408 individuals per year between the years 1960 and 2000. The least-squares estimate of the parameters in the regression equation: x POP aX A (2) is therefore, a is 2293408.2, and A is 181774463. Figure 2 illustrates the relationship between CPI and year. As shown, there is a reasonably linear relationship between CPI and year. The linear regression between CPI and year yielded the following equation: x CPI 0.040218641 X 0.0643875 (3) where CPIx is the consumer price index in year X, and X is the year, which varied from 0 for year 1960 to 40 for year 2000. The r2 value for this linear regression was > 0.96. Thus, the CPI increased by approximately 0.0402 per year between the years 1960 and 2000. Since the numbers in Equation 3 are constants, the following equa- tion will be used: x CPI bX B (4) where b is 0.040218641 , and B is 0.0643875. Figure 3 illustrates the relationship between per cap ita CPI-adjusted healthcare expenditures and year. As shown, there is a near linear relationship between per capita CPI-adjusted healthcare expenditures and year. Linear regression between per capita CPI-adjusted healthcare expenditures and year yielded the following equation: x PCNHE 60.181652 X 335.2974 (5) where PCNHEx is the per capita CPI-adjusted healthcare expenditures in year X, and X is the year, which varied from 0 for year 1960 to 40 for year 2000. The r2 value for this linear regression was >0.98. Thus, per capita 150 200 250 300 0 1020304 Year Population (Millions) 0 Figure 1. Total U.S. population for the years 1960 (year 0) through 2000 (year 40) is displayed. The r2 value for the linear regression performed on this data was >0.99. 0.00 0.25 0.50 0.75 1.00 1.25 1.50 1.75 2.00 0 10203040 ear Consumer Price Index Figure 2. The consumer price index (CPI) for the years 1960 (year 0) through 2000 (year 40) is displayed. The r2 value for the linear regression performed on this data was > 0.96. Copyright © 2011 SciRes. TEL 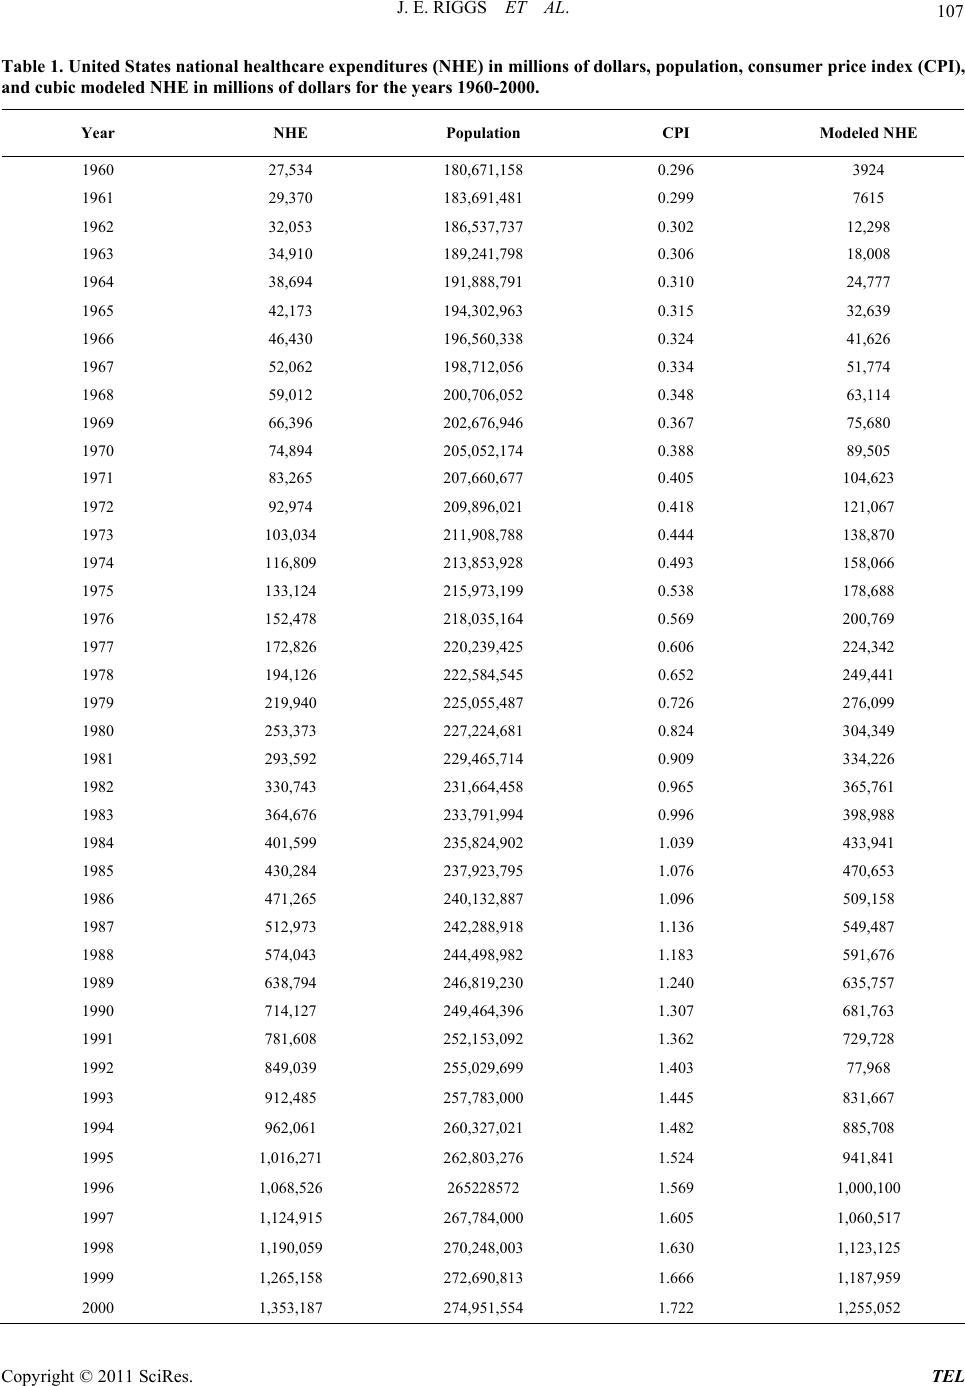 J. E. RIGGS ET AL. Copyright © 2011 SciRes. TEL 107 Table 1. United States national healthcare expenditures (NHE) in millions of dollars, population, consumer price index (CPI), and cubic modeled NHE in millions of dollars for the years 1960-2000. Year NHE Population CPI Modeled NHE 1960 27,534 180,671,158 0.296 3924 1961 29,370 183,691,481 0.299 7615 1962 32,053 186,537,737 0.302 12,298 1963 34,910 189,241,798 0.306 18,008 1964 38,694 191,888,791 0.310 24,777 1965 42,173 194,302,963 0.315 32,639 1966 46,430 196,560,338 0.324 41,626 1967 52,062 198,712,056 0.334 51,774 1968 59,012 200,706,052 0.348 63,114 1969 66,396 202,676,946 0.367 75,680 1970 74,894 205,052,174 0.388 89,505 1971 83,265 207,660,677 0.405 104,623 1972 92,974 209,896,021 0.418 121,067 1973 103,034 211,908,788 0.444 138,870 1974 116,809 213,853,928 0.493 158,066 1975 133,124 215,973,199 0.538 178,688 1976 152,478 218,035,164 0.569 200,769 1977 172,826 220,239,425 0.606 224,342 1978 194,126 222,584,545 0.652 249,441 1979 219,940 225,055,487 0.726 276,099 1980 253,373 227,224,681 0.824 304,349 1981 293,592 229,465,714 0.909 334,226 1982 330,743 231,664,458 0.965 365,761 1983 364,676 233,791,994 0.996 398,988 1984 401,599 235,824,902 1.039 433,941 1985 430,284 237,923,795 1.076 470,653 1986 471,265 240,132,887 1.096 509,158 1987 512,973 242,288,918 1.136 549,487 1988 574,043 244,498,982 1.183 591,676 1989 638,794 246,819,230 1.240 635,757 1990 714,127 249,464,396 1.307 681,763 1991 781,608 252,153,092 1.362 729,728 1992 849,039 255,029,699 1.403 77,968 1993 912,485 257,783,000 1.445 831,667 1994 962,061 260,327,021 1.482 885,708 1995 1,016,271 262,803,276 1.524 941,841 1996 1,068,526 265228572 1.569 1,000,100 1997 1,124,915 267,784,000 1.605 1,060,517 1998 1,190,059 270,248,003 1.630 1,123,125 1999 1,265,158 272,690,813 1.666 1,187,959 2000 1,353,187 274,951,554 1.722 1,255,052 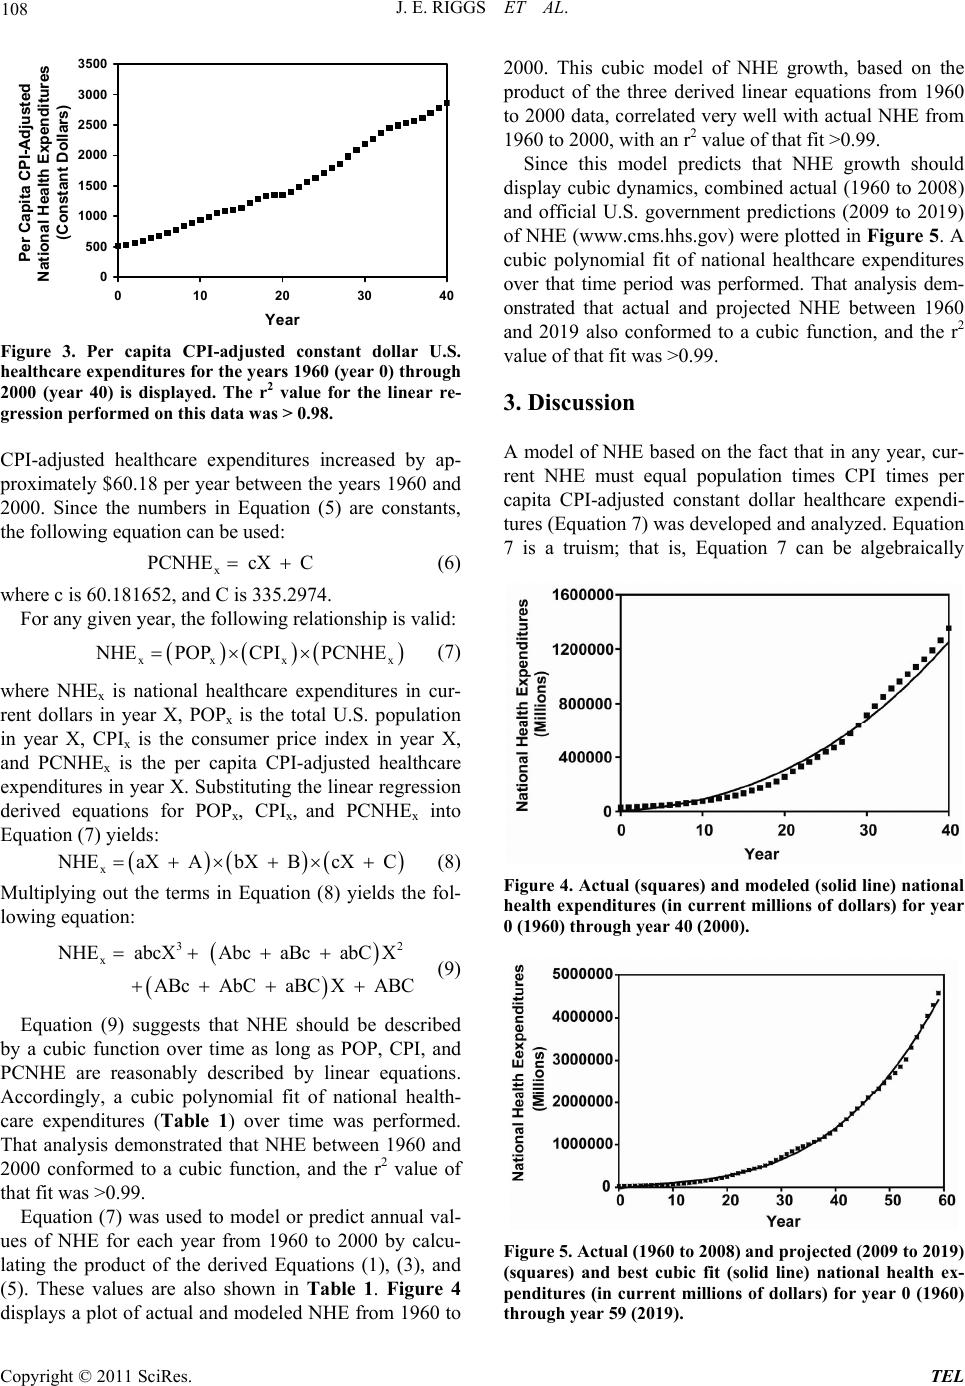 J. E. RIGGS ET AL. 108 0 500 1000 1500 2000 2500 3000 3500 0 102030 Year Per Capita CPI-Adjusted National Health Expenditures (Constant Dollars) 40 Figure 3. Per capita CPI-adjusted constant dollar U.S. healthcare expenditures for the years 1960 (year 0) through 2000 (year 40) is displayed. The r2 value for the linear re- gression performed on this data was > 0.98. CPI-adjusted healthcare expenditures increased by ap- proximately $60.18 per year between the years 1960 and 2000. Since the numbers in Equation (5) are constants, the following equation can be used: x PCNHE cX C (6) where c is 60.18 1652, and C is 335.2974. For any given year, the following relationship is valid: xxx NHE POPCPIPCNHE x (7) where NHEx is national healthcare expenditures in cur- rent dollars in year X, POPx is the total U.S. population in year X, CPIx is the consumer price index in year X, and PCNHEx is the per capita CPI-adjusted healthcare expenditures in year X. Substitutin g the linear regression derived equations for POPx, CPIx, and PCNHEx into Equation (7) yield s: x NHEaX AbX BcX C (8) Multiplying out the terms in Equation (8) yields the fol- lowing equation: 32 x HE abcX Abc aBc abCX ABc AbC aBCX ABC (9) Equation (9) suggests that NHE should be described by a cubic function over time as long as POP, CPI, and PCNHE are reasonably described by linear equations. Accordingly, a cubic polynomial fit of national health- care expenditures (Table 1) over time was performed. That analysis demonstrated that NHE between 1960 and 2000 conformed to a cubic function, and the r2 value of that fit was >0.99. Equation (7) was used to model or predict annual val- ues of NHE for each year from 1960 to 2000 by calcu- lating the product of the derived Equations (1), (3), and (5). These values are also shown in Table 1. Figure 4 displays a plot of actual and modeled NHE from 1960 to 2000. This cubic model of NHE growth, based on the product of the three derived linear equations from 1960 to 2000 data, correlated very well with actual NHE from 1960 to 2000, with an r2 v alue of that fit >0.99. Since this model predicts that NHE growth should display cubic dynamics, combined actual (1960 to 2008) and official U.S. government predictions (2009 to 2019) of NHE (www.cms.hhs.gov) were plotted in Figure 5. A cubic polynomial fit of national healthcare expenditures over that time period was performed. That analysis dem- onstrated that actual and projected NHE between 1960 and 2019 also conformed to a cubic function, and the r2 value of that fit was >0.99. 3. Discussion A model of NHE based on the fact that in any year, cur- rent NHE must equal population times CPI times per capita CPI-adjusted constant dollar healthcare expendi- tures (Equation 7) was developed and analyzed. Equation 7 is a truism; that is, Equation 7 can be algebraically Figure 4. Actual (square s) and modeled (solid line) national health expenditures (in current millions of dollars) for year 0 (1960) through year 40 (2000). Figure 5. Actual (1960 to 2008) and projected (2009 to 2019) (squares) and best cubic fit (solid line) national health ex- penditures (in current millions of dollars) for year 0 (1960) through year 59 (2019). Copyright © 2011 SciRes. TEL  109 J. E. RIGGS ET AL. simplified to state that for any given year, NHE must equal NHE. However, the point of this model was to separate NHE into three distinct components; population, CPI, and per capita CPI-adjusted constant dollar health- care expenditures. There is no a priori reason why each of these three components should increase linearly over time as was demonstrated in this analysis. Since popu- lation, CPI, and per capita CPI-adjusted constant dollar healthcare expenditures did increase reasonably linearly over time between 1960 and 2000, this model suggested that NHE growth should display cubic growth dynamics. Indeed, NHE growth did display cubic dynamics from 1960 to 2000. Moreover, actual and projected NHE growth from 1960 to 2019 also displayed cubic dynamics. This analysis also suggests that future U.S. NHE growth will remain cubic as long as increases in population, CPI, and per capita CPI-adjusted constant dollar healthcare expenditures remain reasonably linear over time. Cubic growth is important to distinguish from exponential growth. Although explaining the cubic growth of U.S. NHE, this model does not accurately predict future NHE. We performed multiple analyses to determine whether knowing that NHE increases cubically over time would allow accurate prediction of future NHE. For example, determining the cubic equation that best fit NHE’s from 1960 to 1980 does not allow an accurate prediction of NHE in 1990. The reason for this failure to accurately predict is that each new data point of population, CPI, and per capita CPI-adjusted constant dollar healthcare expenditures does alter th e corresponding linear equation slightly. The slightly altered linear equations will still accommodate all prior data points and produce a well- fitted cubic function d escribing their product of previous years’ NHE. However, when the three slightly altered linear equations are multiplied together, their product will not accurately predict future NHE due to the com- pounding of errors. This dichotomy of hypotheses or models, those that accommodate and explain past data while failing to predict future data, is well-recognized in science [6-10]. A classic example of this dichotomy is Darwin’s theory of evolution by natural selection. Dar- win’s theory explains the appearance and extinction of past species, but can not predict the future course of evolution [8]. Although unable to predict future NHE, appreciation of the cubic dynamics describing NHE may provide healthcare policy makers an improved frame- work upon which to assess and monitor the impact of healthcare policy changes. Orszag and Ellis [11] suggested that “our country’s financial health will in fact be determined by the growth rate of per capita health care costs.” In this model of U.S. NHE growth used to predict cubic dynamics, one might assume that population growth and CPI growth were relatively outside the influence of the U.S. healthcare system. The remaining factor, constant dollar per capita healthcare expenses, is consistent with the assertion made by Orszag and Ellis [11]. While inflation adjusted total per capita healthcare expenses have increased over time [12], some public sector (Medicare) per capita healthcare expenses have been claimed to have actually declined [13]. Nevertheless, the impact of escalating health care spending on the U.S. economy will continue to be debated [14-16]. 4. Conclusions Rising healthcare costs impacts all sectors of the U.S. economy and is eroding the sustainability of U.S federal discretionary spending. Indeed, increasing healthcare costs are not exclusively a U.S. economic problem; es- calating healthcare costs are a global problem. While this analysis does not attempt to show how to decrease the rate of healthcare cost growth, it does suggest that infla- tion-adjusted per capita healthcare costs is perhaps the best measure to track and monitor NHE growth. More- over, this analysis suggests that healthcare policy chan- ges that merely shift the cost of healthcare expenses will have little impact on NHE growth. 5. References [1] T. Bodenheimer, “High and Rising Health Care Costs. Part 1: Seeking an Explanation,” Annals of Internal Medi- cine, Vol. 142, 2005, pp. 847-854. [2] T. Bodenheimer, “High and Rising Health Care Costs. Part 2: Technologic Innovation,” Annals of Internal Medicine, Vol. 142, 2005, pp. 932-937. [3] T. Bodenheimer, “High and Rising Health Care Costs. Part 3: The Role of Health Care Providers,” Annals of In- ternal Medicine, Vol. 142, 2005, pp. 996-1002. [4] T. Bodenheimer, “High and Rising Health Care Costs. Part 4: Can Costs be Controlled While Preserving Qual- ity?” Annals of Internal Medicine, Vol. 143, 2005, pp. 26-31. [5] E. French and J. B. Jones, “On the Distribution and Dy- namics of Health Care Costs,” Journal of Applied Eco- nomics, Vol. 19, No. 6, 2004, pp. 705-721. doi:10.1002/jae.790 [6] C. G. Hempel and P. Oppenheim, “Studies in the Logic of Explanation,” Philosophy of Science, Vol. 15, No. 2, 1948, pp. 135-175. doi:10.1086/286983 [7] N. Rescher, “On Prediction and Explanation,” British Journal for the Philosophy of Science, Vol. 8, No. 32, 1958, pp. 281-290. doi:10.1093/bjps/VIII.32.281 [8] M. Scriven, “Explanation and Prediction in Evolutionary Theory,” Science, Vol. 130, No. 3374, 1959, pp. 477-482. Copyright © 2011 SciRes. TEL  J. E. RIGGS ET AL. Copyright © 2011 SciRes. TEL 110 doi:10.1126/science.130.3374.477 [9] J. F. Hanna, “Explanation, Prediction, Description, and Information Theory,” Synthese, Vol. 20, No. 3, 1969, pp. 308-334. doi:10.1007/BF00413732 [10] D. Dharmapala and M. McAleer, “Prediction and Accom- modation in Econometric Modeling,” Environmetrics, Vol. 6, No. 5, 1995, pp. 551-556. doi:10.1002/env.3170060522 [11] P. R. Orszag and P. Ellis, “The Challenge of Rising Health Care Costs—A View from the Congressional Budget Office,” New England Journal of Medicine, Vol. 357, No. 18, 2007, pp.1793-1795. doi:10.1056/NEJMp078190 [12] D. E. Altman and L. Levitt, “The Sad History of Health Care Cost Containment Astold in One Chart,” Health Af- fairs (Millwood), Suppl Web Exclusives W83-4, 2002. http://content.healthaffairs.org/content/early/2002/02/23/ hlthaff.w2.83.full.pdf+html [13] T. Bodenheimer, “The Not-So-Sad History of Medicare Cost Containment as Told in One Chart,” Health Affairs (Millwood), Suppl Web ExclusivesW88-90, 2002. http://content.healthaffairs.org/content/early/2002/02/23/ hlthaff.w2.88.full.pdf+html [14] S. H. Altman, C. P. Tompkins, E. Eilat and M. P. V. Gla- vin, “Escalating Health Care Spending: Is It Desirable or Inevitable?” Health Affairs (Millwood), Suppl Web Exclu- s i v e s W3 - 1 - 1 4, 2003. http://content.healthaffairs.org/content/early/2003/01/08/hlthaff. w3.1.long [15] M. V. Pauly, “Should We Be Worried about High Real Medical Spending Growth in the United States?” Health Affairs (Millwood), Supp l Web Exclus ives W3-15-2 7, 20 03. http://content.healthaffairs.org/content/early/2003/01/08/ hlthaff.w3.15.long [16] H. J. Aaron, “Should Public Policy Seek to Control the Growth of Health Carespending?” Health Affairs (Mill- wood), Suppl Web Exclusives W3-28-36, 2003. http://content.healthaffairs.org/content/early/2003/01/08/ hlthaff.w3.28.full.pdf+html
|