V. Vatsalya et al. / J. Biomedical Science and Engineering 2 (2009) 516-520
518
nent parameters evaluated initially within which all the
characteristics of each parameter undergo comparison
for in track corresponding profile similarities.
Characteristics which have not demonstrated signifi-
cant prevalence in the analysis or are not significantly
identifiable in the data search and evaluations have not
been included in the development of the analog at this
stage of the study. A follow up evaluation assessment has
been conducted for comparing this profile with the data
from new reports to evaluate the predictability th e evalu-
ations and to develop the validity of the model.
3. RESULTS
The parameters are assessed in relation to the numbers
of attempts and actual suicide incidents reported be-
tween year 2002 and 2006. The age groups 15–24 and
35–44 yrs have the maximum incidents of attempted
suicides (Figure 2).
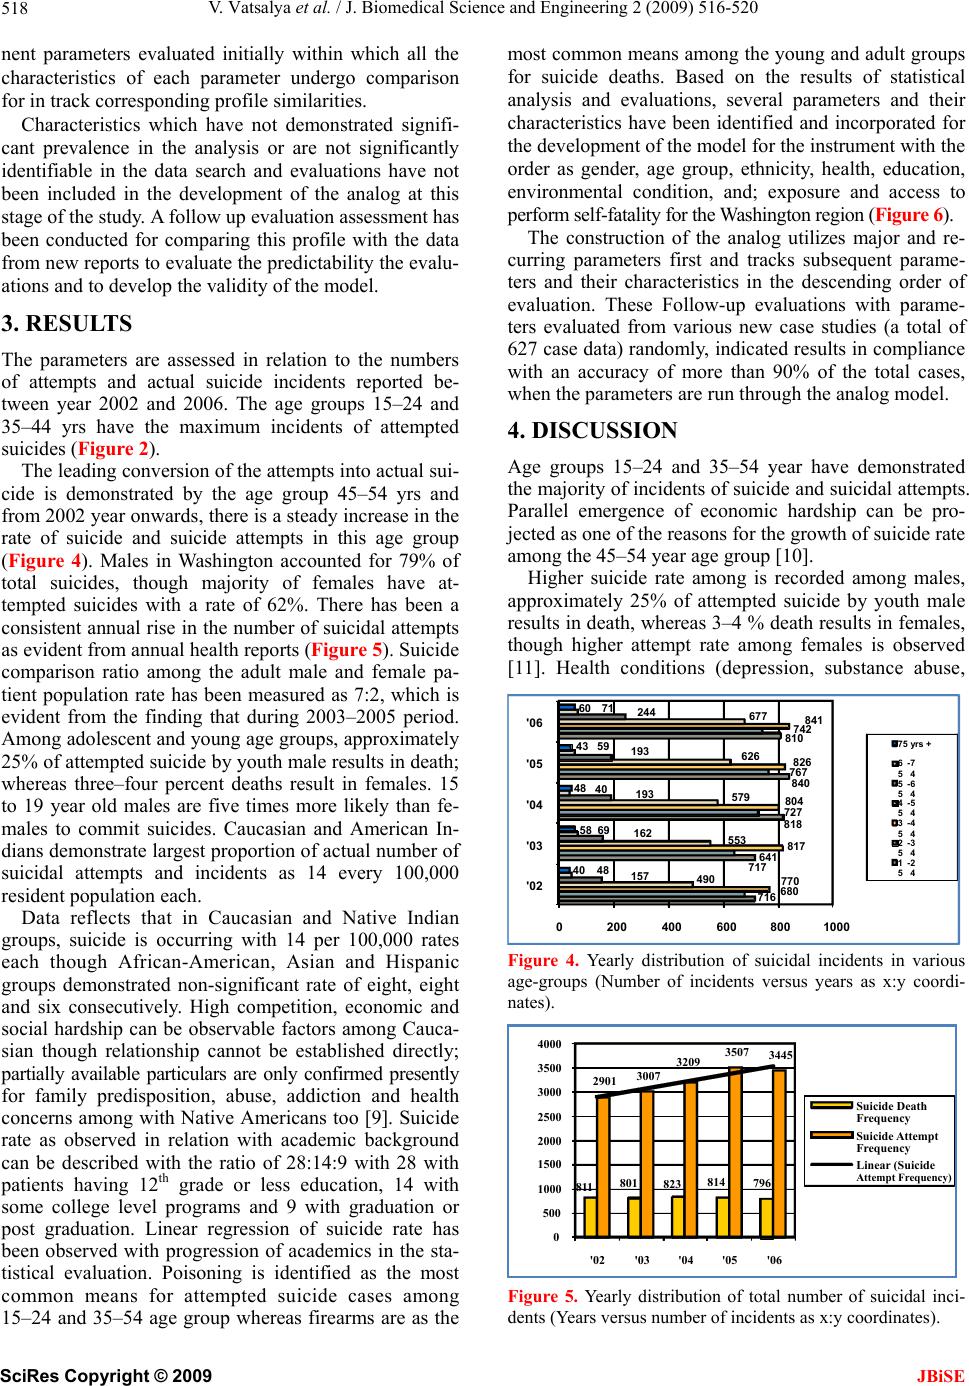
The leading conversion of the attempts into actual su i-
cide is demonstrated by the age group 45–54 yrs and
from 2002 year onwards, there is a steady increase in the
rate of suicide and suicide attempts in this age group
(Figure 4). Males in Washington accounted for 79% of
total suicides, though majority of females have at-
tempted suicides with a rate of 62%. There has been a
consistent annual rise in the number of su icidal attempts
as evident from annual health reports (Figure 5). Suicide
comparison ratio among the adult male and female pa-
tient population rate has been measured as 7:2, which is
evident from the finding that during 2003–2005 period.
Among adolescen t and young age group s, approximatel y
25% of attempted suicide by youth male results in death;
whereas three–four percent deaths result in females. 15
to 19 year old males are five times more likely than fe-
males to commit suicides. Caucasian and American In-
dians demonstrate largest proportion of actual number of
suicidal attempts and incidents as 14 every 100,000
resident population each.
Data reflects that in Caucasian and Native Indian
groups, suicide is occurring with 14 per 100,000 rates
each though African-American, Asian and Hispanic
groups demonstrated non-significant rate of eight, eight
and six consecutively. High competition, economic and
social hardship can be observable factors among Cauca-
sian though relationship cannot be established directly;
partially available particulars are only confirmed presently
for family predisposition, abuse, addiction and health
concerns among with Native Americans too [9]. Suicide
rate as observed in relation with academic background
can be described with the ratio of 28:14:9 with 28 with
patients having 12th grade or less education, 14 with
some college level programs and 9 with graduation or
post graduation. Linear regression of suicide rate has
been observed with progression of academics in the sta-
tistical evaluation. Poisoning is identified as the most
common means for attempted suicide cases among
15–24 and 35–54 age group whereas firearms are as the
most common means among the young and adu lt groups
for suicide deaths. Based on the results of statistical
analysis and evaluations, several parameters and their
characteristics have been identified and incorporated for
the development of th e mode l fo r the instrumen t with th e
order as gender, age group, ethnicity, health, education,
environmental condition, and; exposure and access to
perform self-fatality for the Washington region (Fi gure 6).
The construction of the analog utilizes major and re-
curring parameters first and tracks subsequent parame-
ters and their characteristics in the descending order of
evaluation. These Follow-up evaluations with parame-
ters evaluated from various new case studies (a total of
627 case data) rando mly, in dicated results in compliance
with an accuracy of more than 90% of the total cases,
when the parameters are run through the analog model.
4. DISCUSSION
Age groups 15–24 and 35–54 year have demonstrated
the majority of incidents of suicide and su icidal attempts.
Parallel emergence of economic hardship can be pro-
jected as one of the reasons for the growth of suicide rate
among the 45–54 year age group [10].
Higher suicide rate among is recorded among males,
approximately 25% of attempted suicide by youth male
results in death, whereas 3–4 % death results in females,
though higher attempt rate among females is observed
[11]. Health conditions (depression, substance abuse,
Figure 4. Yearly distribution of suicidal incidents in various
age-groups (Number of incidents versus years as x:y coordi-
nates).
Figure 5. Yearly distribution of total number of suicidal inci-
dents (Years versus number of incidents as x:y coordinates).
811 801 823 814 796
2901 3007 3209 3507 3445
0
500
1000
1500
2000
2500
3000
3500
4000
'02 '03 '04 '05 '06
Suicide Death
Frequency
Suicide Attem pt
Frequency
Linear (Suicide
Attempt Frequency )
716
717
818
840
810
680
641
727
767
742
841
770
817
804
826
490
553
579
626
677
157
162
193
193
244
48
69
40
59
40
58
48
43
60
0200 400 600 800 1000
'02
'04
71
'06
75 yrs +
'05 6
5-7
4
5
5-6
4
4
5-5
4
3
5-4
4
2
'03 5-3
4
1
5-2
4
SciRes
Copyright © 2009 JBiSE