Journal of Materials Science and Chemical Engineering
Vol.06 No.04(2018), Article ID:83666,13 pages
10.4236/msce.2018.64009
Structural Study of Cellulose-Iron Oxide Composite Materials
Dexu Kong1, Lee D. Wilson2*
1Saskatchewan Research Council, Saskatoon, SK, Canada
2Department of Chemistry, University of Saskatchewan, Saskatoon, SK, Canada


Received: March 28, 2018; Accepted: April 5, 2018; Published: April 12, 2018
ABSTRACT
There are limited structural studies of iron oxide coated cellulose materials despite their use as adsorbents for the removal of waterborne arsenic species. This study reports on the structural characterization of cellulose-iron oxide composites at variable iron oxide content using spectroscopy methods (Raman, solids 13C NMR, powder X-ray diffraction (pXRD)) and thermal gravimetric analysis (TGA). Iron oxide was supported onto cellulose (ca. 25 wt.%) without significant loss in the Fe coating efficiency, where the accessibility of the biopolymer -OH groups affect the coating efficiency and yield of the iron oxide-cellulose composite. Isotherm adsorption studies for cellulose, iron oxide species and the cellulose composite materials with roxarsone (3-nitro- 4-hydroxyphenylarsonic acid) were studied to characterize the surface chemical properties of these potential adsorbent materials.
Keywords:
Characterization, Iron Oxide, Cellulose, Composite, Roxarsone, Adsorption

1. Introduction
The utilization of renewable cellulose materials have received increasing attention due to their abundance, low cost, and unique properties, especially the polymer composites with surface modified forms [1]. Adsorbents containing iron oxide are widely available and may be prepared readily [2] with large surface area and suitable surface binding sites for inorganic species and organic arsenicals such as roxarsone (3-nitro-4-hydroxyphenylarsonic acid). Adsorption isotherm models are used herein to investigate the surface chemistry and textural properties of iron oxide-cellulose composites.
Cellulose is a renewable and biodegradable polymer with a unique fibril structure due to its extensive intra- and intermolecular hydrogen bonding. The amorphous and crystalline domains of cellulose influence the relative accessibility of the -OH groups [3] that can be varied by cross-linking [4] and composite formation with iron oxide. Composite formation results in modification of the surface properties of cellulose, as evidenced by improved adsorption of organic/inorganic arsenicals over native cellulose [5] [6] [7] [8]. Despite the various reports on iron oxide coated cellulose, an understanding of the structure and adsorption properties of such materials is limited. To address this knowledge gap, various characterization methods were used such as thermal gravimetric analysis (TGA), powder XRD (pXRD), transmission electron microscopy (TEM) and spectroscopic (Fourier transform infrared (FTIR), Raman spectroscopy, and solids 13C NMR) methods were used to characterize the structure of iron oxide supported onto cellulose. The iron oxide coating efficiency and leaching results are shown to provide insight regarding the composition of the iron oxide composites along with an adsorption study of cellulose and its iron oxide composites with roxarsone in aqueous solution.
2. Experimental
2.1. Sample Preparation
The iron oxide (goethite and hematite) particles and cellulose composites were prepared by precipitation of iron oxide nanoparticles (NPs) onto a cellulose fiber surface at fixed pH conditions. Roxarsone was obtained from the Haohua Industry Co. Ltd. (Jinan, China) where it was purified by recrystallization. The purification of roxarsone and the preparation of iron oxide-cellulose composite were described in a previous report [8]. The Fe content in various iron oxide coated cellulose composites is expressed as the Fe wt. (%) for each composite material.
2.2. Materials Characterization
2.2.1. Thermogravimetry Analysis (TGA)
The thermogravimetric analysis (TGA) of materials was carried out using a TA instruments (Model Q50) thermal analyzer. Nitrogen gas was used for cooling and purging of the sample compartment, where analysis was from 30˚C to 500˚C at a heating rate of 10˚C/min.
2.2.2. Raman Spectroscopy
Raman spectra were acquired with a Renishaw Invia Raman Microscope where the spectral shifts were obtained at ambient temperature with an argon ion excitation laser source at a fixed wavelength (786 nm). The Raman spectra were recorded over a spectral range (200 to 2000 cm−1) with a spectral resolution of 1.9286 cm−1. Instrument parameters involved an optimal power (1 mW) to prevent sample decomposition, 50× magnification, and 50 scans with a 10 s integration time. Raman spectra were obtained for roxarsone and adsorbents in the dry state prior to exposure to roxarsone solutions. The hydrated adsorbents after roxarsone sorption were obtained by measurement of samples mounted onto a gold coated microscope glass slide. To study the role of hydration in the adsorption process, hematite NPs and hematite-cellulose (HeCell) composites were added into the 5% D2O/H2O (w/w) mixed solvent system in the absence and presence of roxarsone at variable levels (0.38 mM, 0.75 mM, 1.5 mM).
2.2.3. 13C Solids NMR Spectroscopy
13C solids NMR spectra were obtained using a Bruker AVANCE III HD spectrometer operating at 125.77 MHz (1H frequency at 500.13 MHz) with a 4 mm DOTY CP-MAS probe. The 13C CP/TOSS (Cross Polarization with Total Suppression of Spinning Sidebands) spectra were obtained at a spinning speed of 6 kHz, with a 1H 90˚ pulse of 3.5 µs, and contact time of 0.75 ms with a ramp pulse on the 1H channel. The spectra for the samples were obtained using 5120 scans with a recycle delay of 2 s. Spectra were obtained using a 71 kHz SPINAL-64 decoupling sequence during acquisition, where chemical shifts were referenced to adamantane (δ = 38.48 ppm; low field signal).
2.2.4. Powder X-Ray Diffraction (pXRD)
Powder X-ray diffraction (pXRD) was used to monitor the product phase versus variable iron oxide composition using a diffractometer (Model: Empyrean, manufacturer: PANalytical, The Netherlands) fitted with Cu K-alpha (0.179 nm) X-ray irradiation sources. The pXRD results for the iron oxides were compared to the simulated spectra obtained from the X’pert Highscore Plus software (Ver. 3.0b (3.0.2), PANalytical, Almelo, The Netherlands).
2.2.5. Transmission Electron Microscopy (TEM)
The transmission electron microscope (TEM) images were obtained using a Hitachi HT-7700 microscope with a 100 kV voltage. Samples were prepared by dispersing into ethanol solution with a sonication bath, then a drop of sample in ethanol was deposited onto a carbon-coated copper TEM grid without staining agent. The samples were examined at variable scale; 50 nm (500 k×), 100 nm (250 k×), and 200 nm (125 k×), where magnification is in parentheses.
2.2.6. Adsorption Isotherms
Roxarsone adsorption isotherm results for cellulose, hematite and various Fe coated hematite-cellulose composites were evaluated by the Freundlich model, as described elsewhere [8].
2.2.7. Iron Coating Efficiency
Iron oxide composites were dissolved in approximately 0.1 g sample in 10 mL of HNO3 acid (conc.), where 30 mL of HCl acid (conc.) was added. After complete digestion, the mixture was allowed to cool and then added slowly to a 100 mL volumetric flask containing ca. 30 mL of Millipore water. The samples were diluted further with Millipore water to the final volume. A 100 ppm iron standard was diluted between 3 - 9 ppm to produce a calibration curve over the linear region (2.5 to 10 ppm) for analysis by atomic absorbance spectroscopy. The acid digested samples were diluted appropriately to reside within the linear calibration region to enable determination of the iron content. A Perkin Elmer Atomic Absorption Spectrometry (AAS) iCE 3300 AA with Iron Atomax hollow cathode 1.5 lamp was used for quantitative analysis.
2.2.8. Iron Leaching
To determine if iron oxide particles undergo leaching from the composite materials, 0.1 g samples were soaked in the 100 g DI water and mixed at 300 rpm for 48 h. The method of shake extraction of solid waste with water (ASTM D3987) with 18 h of extraction ensures leaching of the iron oxide particles from the samples. 2 mL aliquots of aqueous solution were sampled over 1 - 48 h period and filtered with 0.45 µm syringe disc filters prior to AAS analyses.
3. Results and Discussion
3.1. TGA Characterization of Iron Oxide-Cellulose Composites
The TGA results for hematite, cellulose, and 10% Fe coated hematite-cellulose are shown in Figure 1. Thermal events for hematite adsorbent occur at 80 and 200˚C, where the broad transition at 80˚C is related to water loss and the event at 200˚C is related to decomposition of hematite [2]. Cellulose decomposes at 340˚C as a sharp transition (Figure 1(b)), while 10% Fe coated hematite-cellulose has an elevated decomposition temperature at 360˚C (Figure 1(c)). A comparison of the TGA results (Figure 1(a)-(c)) reveal that 10% Fe coated hematite-cellulose composite was shifted to a higher temperature versus the pure hematite and cellulose, thus providing further support that the composite material was successfully formed.
3.2. Raman Spectral Characterization
In Figure 2(a), Raman spectra of hematite, cellulose and composites with various hematite-cellulose content are shown, where native cellulose has spectral bands at 373, 896, 1095, 1120, 1337, 1376 and 1462 cm−1. The weaker bands at 352 cm−1 and 373 cm−1 are related to CCC, COC, OCC, OCO skeletal bending modes along with, the CCH, COH bending and skeletal modes CC and CO groups for the pyranose ring units. The weak bands at 896 cm−1 are due to HCC, HCO bending with strong bands at 1095 cm−1 and 1120 cm−1 due to COC symmetric stretching. A weak band at 1337 cm−1 is from HCH (wagging), HCC, HOC, COH (rocking) bending. A weak band at 1376 cm−1 is due to HCH, HCC, HOC, COH bending, and a weak band at 1462 cm−1 is due to HCH scissoring and bending [9]. The hematite spectrum reveals bands at 299, 400, 495, 600 cm−1 and 1320 cm−1 [10] [11], where the 1320 cm−1 band is assigned to residual nitrate counterions bound to hematite [2]. The prominent band at 299 cm−1 is assigned to the presence of Fe-OH [12], where signatures at 400 and 600 cm−1 are due to Fe-O symmetric bending, and Fe-O symmetric stretching at 495 cm−1 [10].
A comparison of the Raman spectra at variable Fe content for hematite-cellulose composites are shown in Figure 2(a), where the bands for cellulose
 (a)
(a)
 (b)
(b)
 (c)
(c)
Figure 1. TGA of (a) hematite, (b) cellulose, and (c) 10% Fe coated hematite-cellulose.
 (a)
(a) (b)
(b)
Figure 2. Raman spectra (a). cellulose, hematite and various Fe content hematite-cellulose composites, and (b) hematite and 10% Fe coated hematite-cellulose before and after roxarsone uptake.
at 373, 896, 1095, 1120, 1337, 1376, 1462 cm−1 are gradually reduced as the Fe content increased. As the Fe content increased, greater levels of hematite NPs contribute to greater Raman scattering as seen by the increased hematite feature for the 25% Fe coated hematite-cellulose composite. Comparing the spectra for 10% Fe coated hematite-cellulose composite with that for hematite at 299 and 400 cm−1 provides further evidence that the hematite NPs are coated with cellulose. In Figure 2(b), the Raman spectra denoted in pink color for 5 mM roxarsone (ROX) has signatures at 636, 792, 809, 1232, 1344, and 1600 cm−1. The spectrum of solid ROX has a band at 636 cm−1 that is assigned to the As-C stretching, while the bands at 792 and 809 cm−1 are related to AsOx stretching [13]. The bands at 1152 and 1232 cm−1 are assigned to C-N and O-H stretching [14]. Vibrational modes corresponding to the NO2 group occur at 1344 and 1600 cm−1 that correspond to the symmetric and asymmetric modes [15]. A comparison of the Raman spectra of the hematite before (black line) and after ROX sorption (red line) reveal that the hematite after ROX sorption has an extra band at 809 cm−1 due to bound ROX species. Furthermore, the Raman spectra of hematite before and after ROX sorption show reduced spectral intensity and broadening as indicated by an amorphous arrangement of ROX bound to the hematite adsorbent. The Raman spectra of the 10% Fe coated hematite-cellulose composite before and after ROX sorption show that the peak at 809 cm−1 from ROX appears in the spectrum for 10% Fe coated hematite-cellulose composite, providing support that ROX is bound to the composite. The Raman spectra from 10% Fe coated hematite-cellulose composite before and after ROX sorption reveal spectral features of cellulose (373, 896, 1095, 1120, 1337, 1376 and 1462 cm−1) [9]. The broadened and reduced bands are observed for the 10% Fe coated hematite-cellulose composite after ROX sorption indicate a more amorphous structure of the composite after ROX uptake, providing support that the hematite cellulose composite adsorbs ROX.
3.3. 13C CP-MAS Solids NMR Spectral Characterization
In Figure 3, the lower 13C NMR spectrum of cellulose was shown with dispersion of chemical shift values: C-1 (105 ppm), C-2/C-3/C-5 (68 - 78 ppm), C-4 (88.4 and 83.3 ppm), and C-6 (57 - 67 ppm). The 13C NMR spectral lines of cellulose agree with previous reports [4] [16]. Looking at different Fe coated hematite-cellulose composites and spectral trends for cellulose signatures reveal that composites with greater Fe content have weaker 13C intensity, more band broadening and wider chemical shift variations. The composite material structure became more rigid which reduced the 13C signal intensity as more Fe was coated onto cellulose. Comparing the 25% Fe coated hematite-cellulose composite with the 13C NMR spectrum of cellulose, the C-1 and C-4 signatures undergo the least change relative to the C-2,3,5 and C-6 signatures. The resonance lines with greater changes in signal intensity may indicate the sites where the Fe particles interact with cellulose. The C-2,3,5, and C-6 sites of cellulose coincide with regions adjacent to the -OH groups that provide Lewis base sites that support the iron oxide coordination for the composite.
3.4. pXRD Characterization
In Figure 4, the XRD results for the cellulose spectra (pink color) show the XRD signatures at 17˚ that was assigned to the (1ī0) crystallographic plane, while the

Figure 3. 13C CP-MAS solids NMR spectra of the hematite and its composites.

Figure 4. pXRD of the hematite, cellulose and different Fe coated hematite-cellulose composites.
band at 19˚ was assigned to the (110) crystallographic plane. The band at 23˚ relates to the amorphous phase and the signature at 27˚ was assigned to the (200) crystallographic plane [17]. The hematite XRD spectra (green line) was indexed to a pure rhombohedral structure of α-Fe2O3 with lattice constants of a = 5.036 Å, c = 13.749 Å (JCPDS No. 33-0664). A comparison among different levels of Fe coated hematite-cellulose composites indicate that the cellulose feature in the XRD spectra was reduced as the level of Fe increased. The observation of reduced cellulose signatures upon iron doping agree with the reduced long range order for cellulose as more iron oxide NPs are coated onto the biopolymer surface [18].
The XRD spectra of the 25% Fe coated hematite-cellulose show a reduction in the cellulose feature relative to the native cellulose, while the hematite features were not observed for the 25% Fe coated composite. A comparison with previous reported pXRD spectra for a 30% Fe coated goethite-cellulose composite reveal that there are spectral features that support the formation of a Fe coated goethite-cellulose composite [8]. The observation of phase separation above a certain Fe content (30 wt.%) for the pXRD spectra does not reveal free hematite particles at 25% Fe content. The dispersion of iron oxide onto the surface of cellulose appears to be favorable below 30% Fe content. In other words, the -OH sites on the cellulose fiber are not accessible to the iron oxide NPs above 30% weight loading onto the composite material, assuming that only the -OH sites from the cellulose fiber are coordination sites for the iron oxide NPs.
3.5. TEM Characterization
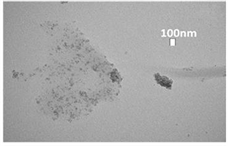
In Figure 5(a), Figure 5(b), the TEM images of hematite particles are shown at the 200 and 50 mm scale. The hematite NPs are irregular and diamond shaped with diameters between 50 - 100 nm that are consistent with the hematite NPs produced by Schwertmann’s method that involve transformation of ferrihydrite to hematite NPs [2].
Figure 5(c), Figure 5(d) are TEM images for the 10% Fe coated hematite-cellulose composites that show a fibril bundle of cellulose and an agglomeration of hematite. Some regions of the cellulose fiber are covered by more hematite particles than other regions in Figure 5(c), while some regions the cellulose fiber are devoid of hematite that indicate non-uniform dispersion.
3.6. Adsorption Properties of the Adsorbents
Adsorption isotherms describe the partitioning of adsorbate between aqueous solution and the adsorbent phase at equilibrium. Estimates of the sorption capacity and affinity of ROX with various sorbent materials can be obtained using a suitable isotherm model. Figure 6 shows the adsorption isotherm of ROX with the hematite and the hematite-cellulose composites. The adsorbed ROX species “Qe” (mmol/g) is expressed per gram of adsorbent at equilibrium, while the residual amount of ROX “Ce” (mM) is the concentration of residual ROX in aqueous solution at equilibrium. The adsorption isotherm profile shows agreement with the Freundlich isotherm model that suggests uptake occurs at heterogeneous sites on the surface of the hematite-cellulose composite adsorbent, in agreement with two or more adsorption sites [19]. Similar adsorption isotherm results between ROX and pure goethite with a previous report [8] indicate that the uptake of ROX occurs at homogeneous sites onto the hematite particles. The similar adsorption capacity for the 25% Fe coated hematite-cellulose versus the pure hematite indicate the hematite NPs are responsible
 (a)
(a)
 (b)
(b)
 (c)
(c)
 (d)
(d)
Figure 5. TEM images of hematite (a)-(b), 10% Fe coated hematite-cellulose in 200 nm scale (c), and 10% Fe coated hematite-cellulose materials at 100 nm scale (d). In Figure 5 (a)-(b), the TEM images of hematite particles are shown at the 200 and 50 mm scale. The hematite NPs are irregular and diamond shaped with about 50 - 100 nm in diameter that are consistent with the hematite NPs produced by Schwertmann’s method that involve transformation of ferrihydrite to hematite NPs [2].

Figure 6. Freundlich isotherm fitted results for the uptake of ROX onto hematite and Fe coated hematite-cellulose composites at 295 K and pH 7.
for ROX uptake, and the agglomeration of the pure hematite NPs reveal similar ROX uptake for the pure hematite and the 25% Fe coated hematite-cellulose adsorbent. The adsorption results also support the formation of the hematite-cellulose composite, and the dispersion of hematite NPs onto the surface of the cellulose fibers.
3.7. Adsorbent Coating Efficiency and Leaching Properties
The Fe coating efficiency results for different goethite-cellulose composites are listed in Table 1. The reduced levels of Fe for the loading had a greater Fe coating efficiency onto the cellulose supports. This can be understood since cellulose had a limited number of surface sites for binding Fe NPs. A low concentration of Fe NPs shows greater dispersion of NPs onto the cellulose fiber surface with improved Fe coating efficiency. The Fe coating efficiency results for various hematite-cellulose composites are listed in Table 1. Both Fe coating efficiency for the 25% Fe coated hematite-cellulose and the 30% Fe coated goethite-cellulose composite were below 80%. This large decrease in Fe coating efficiency for the 25% Fe coated hematite-cellulose composite indicated the optimum Fe content for the hematite-cellulose composite would be ca. 25%. In Table 1, the Fe content for the 25% Fe coated hematite-cellulose was very similar to the theoretical Fe content (25.7%) calculated from the proposed model structure of the cellulose supported iron oxide composite in Figure 7. The iron coating efficiency results indicated the 25% wt. Fe was the optimum Fe to cellulose ratio for coating cellulose with Fe NPs. There would be fewer accessible -OH sites from the cellulose fiber surface available for bonding with more than 25% wt. Fe NPs.
The iron leaching tests were obtained for the 10% Fe coated goethite-cellulose, 10% Fe coated hematite-cellulose, and the 30% Fe coated goethite-cellulose composite. The results in Table 2 show an increasing amount of iron leached from the composites as the iron content increased. For the 30% Fe coated goethite-cellulose composite, a greater level of iron leaching from the cellulose composite surface occurred relative to the 10% Fe coated goethite-cellulose composite. The greater iron leaching from the 30% Fe coated goethite-cellulose composite reveals that the optimum level of iron coating onto cellulose is less than 30 wt. % Fe. Thus, the iron oxide coated cellulose structure is described by a composite where one Fe species can be complexed to one glucose monomer. On the other hand, the 10% Fe coated goethite-cellulose with the same 10% Fe coated hematite-cellulose composite reveal that more iron particles are washed off from the hematite-cellulose composite material. This is due to the smaller

Table 1. Fe coating efficiency of goethite-cellulose (G-C) and hematite-cellulose (H-C) composite adsorbents with variable Fe content.
a: Fe content based on the weight ratio of Fe and cellulose in the synthetic step; b:Amount of Fe obtained from the atomic adsorption spectroscopy analysis.
Table 2. Iron leaching tests for various goethite-cellulose (G-C) and hematite-cellulose (H-C) composite materials.
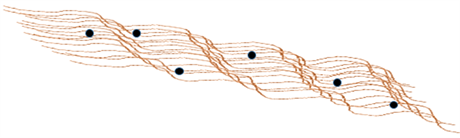
Figure 7. Proposed structure of iron oxide-cellulose composite.
size of the hematite NPs (10 nm) that are more solvent accessible than the goethite NPs (200 nm) [2]. In other words, the agglomeration of goethite particles on the cellulose surface sites resulted in a more stable iron oxide-composite. The agglomeration of iron oxide NPs was observed from the p-XRD and TEM results, where previous p-XRD results indicate phase separation of the 30% Fe coated goethite-cellulose [8]. The characterization results provide support that the iron-oxide-cellulose composite is consistent with dispersion of NPs at the accessible -OH sites of cellulose in Figure 7.
Figure 7 is an illustrative view of iron oxide particles bound onto the fibril surface of cellulose, where individual biopolymer strands are shown as brown line segments and iron oxide clusters are shown as black spheres. The proposed structure of iron oxide-cellulose composite indicate that non-uniform coverage occurs onto the surface of cellulose fiber after coating. From the iron coating efficiency and leaching test results, the overall ratio between the mole content of iron and glucose monomers, where an average mole ratio is estimated ca. 1:1.
4. Conclusion
The experimental results from the synthesis of the iron oxide composite formation and the Fe leaching experiments indicate that the composite materials had an optimum level of Fe incorporation onto the cellulose surface (ca. 25 wt.%). The p-XRD, TEM characterization results indicate that cellulose fibers can support iron oxide NPs; while the iron coating efficiency and leaching tests provided complementary support for a structural model of the cellulose composite. The mole ratio and glucose monomer units of cellulose to Fe species is 1:1, in accordance with the contribution of one OH group for each Fe species.
Acknowledgements
The authors are grateful to the Saskatchewan Research Council and the University of Saskatchewan for supporting this research.
Cite this paper
Kong, D. and Wilson, L.D. (2018) Structural Study of Cellulose-Iron Oxide Composite Materials. Journal of Materials Science and Chemical Engineering, 6, 65-77. https://doi.org/10.4236/msce.2018.64009
References
- 1. Crini, G. (2005) Recent Developments in Polysaccharide-Based Materials Used as Adsorbents in Wastewater Treatment. Progress in Polymer Science, 30, 38-70. https://doi.org/10.1016/j.progpolymsci.2004.11.002
- 2. Schwertmann, U. and Cornell, R.M. (2000) Iron Oxides in the Laboratory. Wiley, Chichester. https://doi.org/10.1002/9783527613229
- 3. Borjesson, M. and Westman, G. (2015) Crystalline Nanocellulose—Preparation, Modification, and Properties. Cellulose-Fundamental Aspects and Current Trends, INTECH, 159-191. https://doi.org/10.5772/61899
- 4. Udoetok, I.A.W. and Headley, J.V. (2018) Ultra-Sonication Assisted Cross-Linking of Cellulose Polymers. Ultrasonics-Sonochemistry, 42, 567-576. https://doi.org/10.1016/j.ultsonch.2017.12.017
- 5. Bouatay, F., Meksi, N. and Slah, F. (2014) Chemical Modification of Cellulosic Fibers Using Eco-Friendly Compounds to Improve Dyeing with Cationic Dyes. J. Textile Sci. Eng., 4, 1-8.
- 6. Yu, X., Tong, S., Ge, M., Zuo, J., Cao, C. and Song, W. (2013) One-Step Synthesis of Magnetic Composites of Cellulose-Iron Oxide Nanoparticles for Arsenic Removal. J. Mater. Chem. A, 1, 959-965. https://doi.org/10.1039/C2TA00315E
- 7. Lunge, S., Singh, S. and Sinha, A. (2014) Magnetic Iron Oxide (Fe3O4) Nanoparticles from Tea Waste for Arsenic Removal. J. Magn. Magn. Mater., 356. https://doi.org/10.1016/j.jmmm.2013.12.008
- 8. Kong, D. and Wilson, L.D. (2017) Synthesis and Characterization of Cellulose-Goethite Composites and Their Adsorption Properties with Roxarsone. Carbohydr Polym, 169, 282-294. https://doi.org/10.1016/j.carbpol.2017.04.019
- 9. Szymanska-Chargot, M., Cybulska, J. and Zdunek, A. (2011) Sensing the Structural Differences in Celluloses from Apple and Bacterial Cell Wall Materials by Raman and FT-IR. Sensors, 11, 5543-5560. https://doi.org/10.3390/s110605543
- 10. Legodi, M.A. and Wall, D.D. (2007) The Preparation of Magnetite, Goethite, Hematite and Maghemite of Pigment Quality from Mill Scale Iron Waste. Dyes and Pigments, 74, 161-168. https://doi.org/10.1016/j.dyepig.2006.01.038
- 11. Hanesch, M. (2009) Raman Spectroscopy of Iron Oxides and (Oxy)hydroxides at Low Laser Power and Possible Application in Environmental Magnetic Studies. Geophys. J. Int., 1773, 941-948. https://doi.org/10.1111/j.1365-246X.2009.04122.x
- 12. Cornell, R.M. and Schwertmann, U. (2003) The Iron Oxides: Structure, Properties, Reactions, Occurences and Uses. WILEY-VCH Verlag GmbH & Co. KGaA, Weinheim, 659. https://doi.org/10.1002/3527602097
- 13. Cowen, S., Duggal, M., Hoang, T. and Al-Abadleh, H.A. (2008) Vibrational Spectroscopic Characterization of Some Environmentally Important Organoarsenicals— A Guide for Understanding the Nature of Their Surface Complexes. Can. J. Chem., 86, 942. https://doi.org/10.1139/v08-102
- 14. Fleger, Y., Mastai, Y., Rosenbluh, M. and Dressler, D.H. (2009) SERS as a Probe for Adsorbate Orientation on Silver Nanoclusters. J. Raman Spectrosc., 40, 1572. https://doi.org/10.1002/jrs.2300
- 15. Raj, A., Raju, K., Varghese, H.T., Granadeiro, C.M., Nogueira, H.I.S. and Yohannan Panicker, C. (2009) IR, Raman and SERS Spectra of 2-(Methoxycarbonylmethyl- sulfanyl)-3,5-Dinitrobenzene Carboxylic Acid. J. Brazil. Chem. Soc., 20, 549.
- 16. Okushita, K., Komatsu, T., Chikayama, E. and Kikuchi, J. (2012) Statistical Approach for Solid-State Nmr Spectra of Cellulose Derived from a Series of Variable Parameters. Polym. J., 44, 895-900. https://doi.org/10.1038/pj.2012.82
- 17. Poletto, M., Pistor, V. and Zattera, A.J. (2013) Structural Characteristics and Thermal Properties of Native Cellulose. Cellulose-Fundamental Aspects, InTech, 45-68. https://doi.org/10.5772/50452
- 18. Roberts, A.P., Liu, Q., Rowan, C.J., Chang, L., Carvallo, C., Torrent, J. and Horng, C. (2006) Characterization of Hematite, Goethite, Greigite, and Pyrrhotite Using First-Order Reversal Curve Diagrams. J. Geophys. Res., 111, B12S35. https://doi.org/10.1029/2006JB004715
- 19. Freundlich, H. (1907) Kolloidfällung und Adsorption. Angew. Chem., 20, 749-750. https://doi.org/10.1002/ange.19070201805