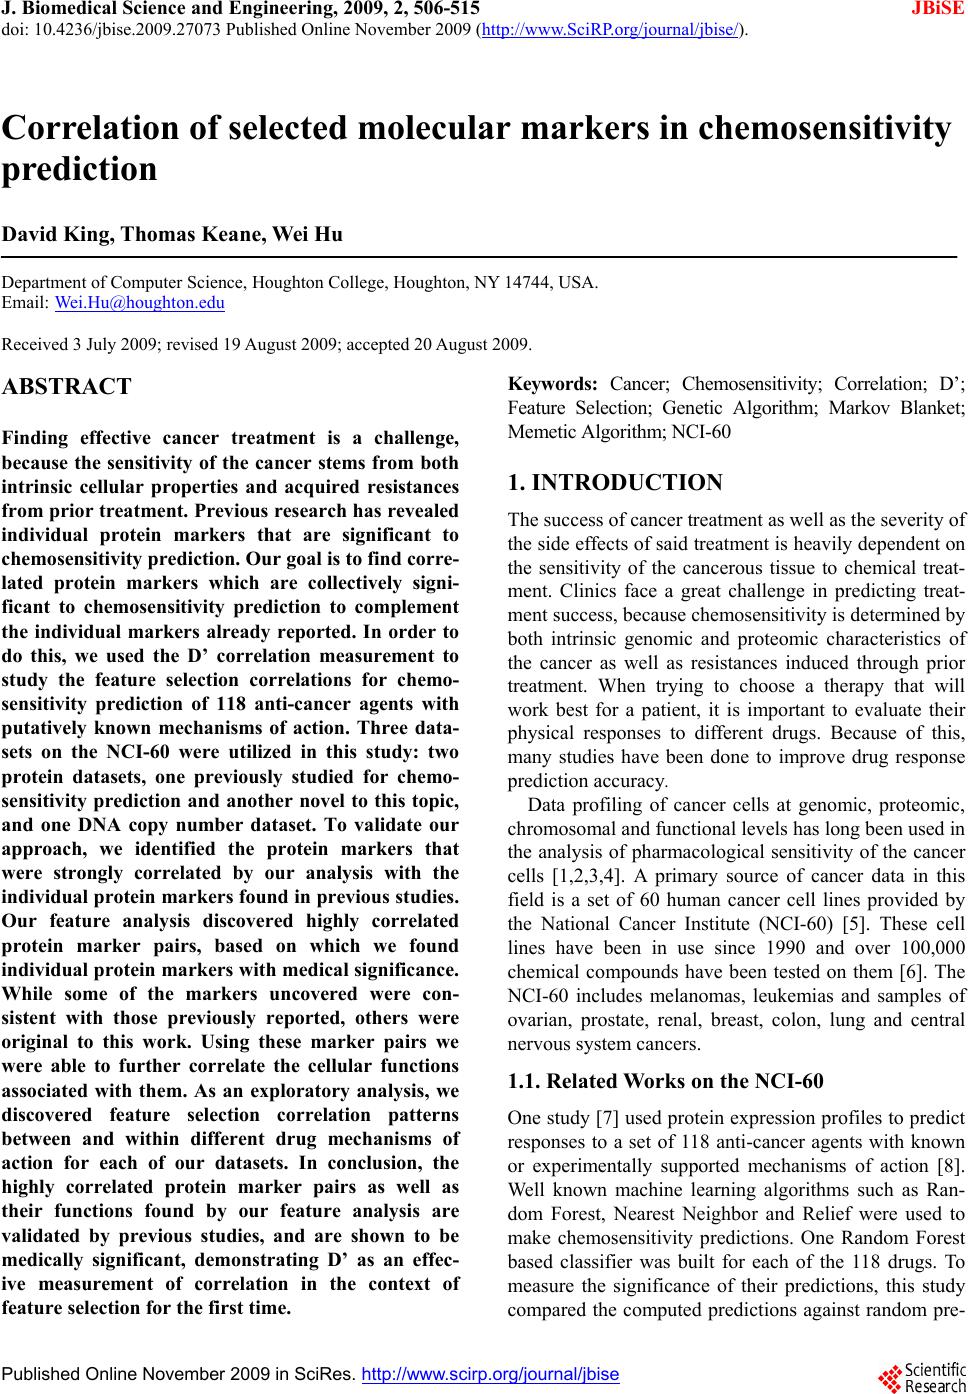
 J. Biomedical Science and Engineering, 2009, 2, 506-515 doi: 10.4236/jbise.2009.27073 Published Online November 2009 (http://www.SciRP.org/journal/jbise/ JBiSE ). Published Online November 2009 in SciRes. http://www.scirp.org/journal/jbise Correlation of selected molecular markers in chemosensitivity prediction David King, Thomas Keane, Wei Hu Department of Computer Science, Houghton College, Houghton, NY 14744, USA. Email: Wei.Hu@houghton.edu Received 3 July 2009; revised 19 August 2009; accepted 20 August 2009. ABSTRACT Finding effective cancer treatment is a challenge, because the sensitivity of the cancer stems from both intrinsic cellular properties and acquired resistances from p rior tr eatmen t. Prev ious r esearch has rev ealed individual protein markers that are significant to chemosensitivity prediction. Our goal is to find corre- lated protein markers which are collectively signi- ficant to chemosensitivity prediction to complement the individual markers already reported. In order to do this, we used the D’ correlation measurement to study the feature selection correlations for chemo- sensitivity prediction of 118 anti-cancer agents with putatively known mechanisms of action. Three data- sets on the NCI-60 were utilized in this study: two protein datasets, one previously studied for chemo- sensitivity prediction and another novel to this topic, and one DNA copy number dataset. To validate our approach, we identified the protein markers that were strongly correlated by our analysis with the individual protein markers found in previous studies. Our feature analysis discovered highly correlated protein marker pairs, based on which we found individual protein markers with medical significance. While some of the markers uncovered were con- sistent with those previously reported, others were original to this work. Using these marker pairs we were able to further correlate the cellular functions associated with them. As an exploratory analysis, we discovered feature selection correlation patterns between and within different drug mechanisms of action for each of our datasets. In conclusion, the highly correlated protein marker pairs as well as their functions found by our feature analysis are validated by previous studies, and are shown to be medically significant, demonstrating D’ as an effec- ive measurement of correlation in the context of feature selection for the first time. Keywords: Cancer; Chemosensitivity; Correlation; D’; Feature Selection; Genetic Algorithm; Markov Blanket; Memetic Algorithm; NCI-60 1. INTRODUCTION The success of cancer treatment as well as the severity of the side effects of said treatment is heavily dependent on the sensitivity of the cancerous tissue to chemical treat- ment. Clinics face a great challenge in predicting treat- ment success, because chemosensitivity is determined by both intrinsic genomic and proteomic characteristics of the cancer as well as resistances induced through prior treatment. When trying to choose a therapy that will work best for a patient, it is important to evaluate their physical responses to different drugs. Because of this, many studies have been done to improve drug response prediction accuracy. Data profiling of cancer cells at genomic, proteomic, chromosomal and functional levels has long been used in the analysis of pharmacological sensitivity of the cancer cells [1,2,3,4]. A primary source of cancer data in this field is a set of 60 human cancer cell lines provided by the National Cancer Institute (NCI-60) [5]. These cell lines have been in use since 1990 and over 100,000 chemical compounds have been tested on them [6]. The NCI-60 includes melanomas, leukemias and samples of ovarian, prostate, renal, breast, colon, lung and central nervous system cancers. 1.1. Related Works on the NCI-60 One study [7] used protein expression profiles to predict responses to a set of 118 anti-cancer agents with known or experimentally supported mechanisms of action [8]. Well known machine learning algorithms such as Ran- dom Forest, Nearest Neighbor and Relief were used to make chemosensitivity predictions. One Random Forest based classifier was built for each of the 118 drugs. To measure the significance of their predictions, this study compared the computed predictions against random pre- 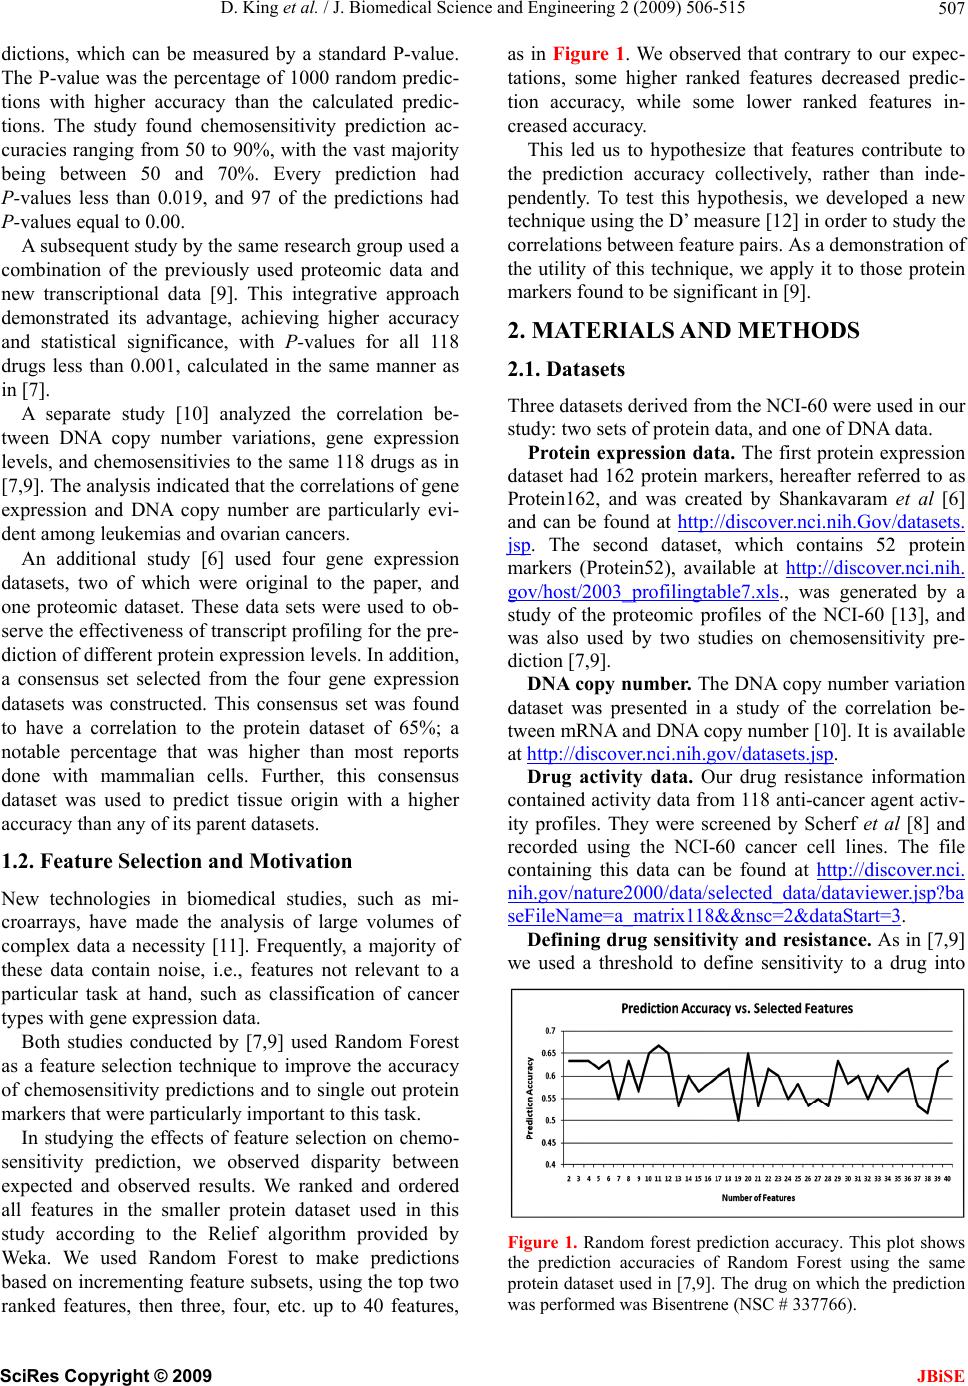 D. King et al. / J. Biomedical Science and Engineering 2 (2009) 506-515 507 dictions, which can be measured by a standard P-value. The P-value was the percentage of 1000 random predic- tions with higher accuracy than the calculated predic- tions. The study found chemosensitivity prediction ac- curacies ranging from 50 to 90%, with the vast majority being between 50 and 70%. Every prediction had P-values less than 0.019, and 97 of the predictions had P-values equal to 0.00. A subsequent study by the same research group used a combination of the previously used proteomic data and new transcriptional data [9]. This integrative approach demonstrated its advantage, achieving higher accuracy and statistical significance, with P-values for all 118 drugs less than 0.001, calculated in the same manner as in [7]. A separate study [10] analyzed the correlation be- tween DNA copy number variations, gene expression levels, and chemosensitivies to the same 118 drugs as in [7,9]. The analysis indicated that the correlations of gene expression and DNA copy number are particularly evi- dent among leukemias and ovarian cancers. An additional study [6] used four gene expression datasets, two of which were original to the paper, and one proteomic dataset. These data sets were used to ob- serve the effectiveness of transcript profiling for the pre- diction of different protein expression levels. In addition, a consensus set selected from the four gene expression datasets was constructed. This consensus set was found to have a correlation to the protein dataset of 65%; a notable percentage that was higher than most reports done with mammalian cells. Further, this consensus dataset was used to predict tissue origin with a higher accuracy than any of its parent datasets. 1.2. Feature Selection and Motivation New technologies in biomedical studies, such as mi- croarrays, have made the analysis of large volumes of complex data a necessity [11]. Frequently, a majority of these data contain noise, i.e., features not relevant to a particular task at hand, such as classification of cancer types with gene expression data. Both studies conducted by [7,9] used Random Forest as a feature selection technique to improve the accuracy of chemosensitivity predictions and to single out protein markers that were particularly important to this task. In studying the effects of feature selection on chemo- sensitivity prediction, we observed disparity between expected and observed results. We ranked and ordered all features in the smaller protein dataset used in this study according to the Relief algorithm provided by Weka. We used Random Forest to make predictions based on incrementing feature subsets, using the top two ranked features, then three, four, etc. up to 40 features, as in Figure 1. We observed that contrary to our expec- tations, some higher ranked features decreased predic- tion accuracy, while some lower ranked features in- creased accuracy. This led us to hypothesize that features contribute to the prediction accuracy collectively, rather than inde- pendently. To test this hypothesis, we developed a new technique using the D’ measure [12] in order to study the correlations between feature pairs. As a demonstration of the utility of this technique, we apply it to those protein markers found to be significant in [9]. 2. MATERIALS AND METHODS 2.1. Datasets Three datasets derived from the NCI-60 were used in our study: two sets of protein data, and one of DNA data. Protein expression data. The first protein expression dataset had 162 protein markers, hereafter referred to as Protein162, and was created by Shankavaram et al [6] and can be found at http://discover.nci.nih.Gov/datasets. jsp. The second dataset, which contains 52 protein markers (Protein52), available at http://discover.nci.nih. gov/host/2003_profilingtable7.xls., was generated by a study of the proteomic profiles of the NCI-60 [13], and was also used by two studies on chemosensitivity pre- diction [7,9]. DNA copy number. The DNA copy number variation dataset was presented in a study of the correlation be- tween mRNA and DNA copy number [10]. It is available at http://discover.nci.nih.gov/datasets.jsp. Drug activity data. Our drug resistance information contained activity data from 118 anti-cancer agent activ- ity profiles. They were screened by Scherf et al [8] and recorded using the NCI-60 cancer cell lines. The file containing this data can be found at http://discover.nci. nih.gov/nature2000/data/selected_data/dataviewer.jsp?ba seFileName=a_matrix118&&nsc=2&dataStart=3. Defining drug sensitivity and resistance. As in [7,9] we used a threshold to define sensitivity to a drug into Figure 1. Random forest prediction accuracy. This plot shows the prediction accuracies of Random Forest using the same protein dataset used in [7,9]. The drug on which the prediction was performed was Bisentrene (NSC # 337766). SciRes Copyright © 2009 JBiSE 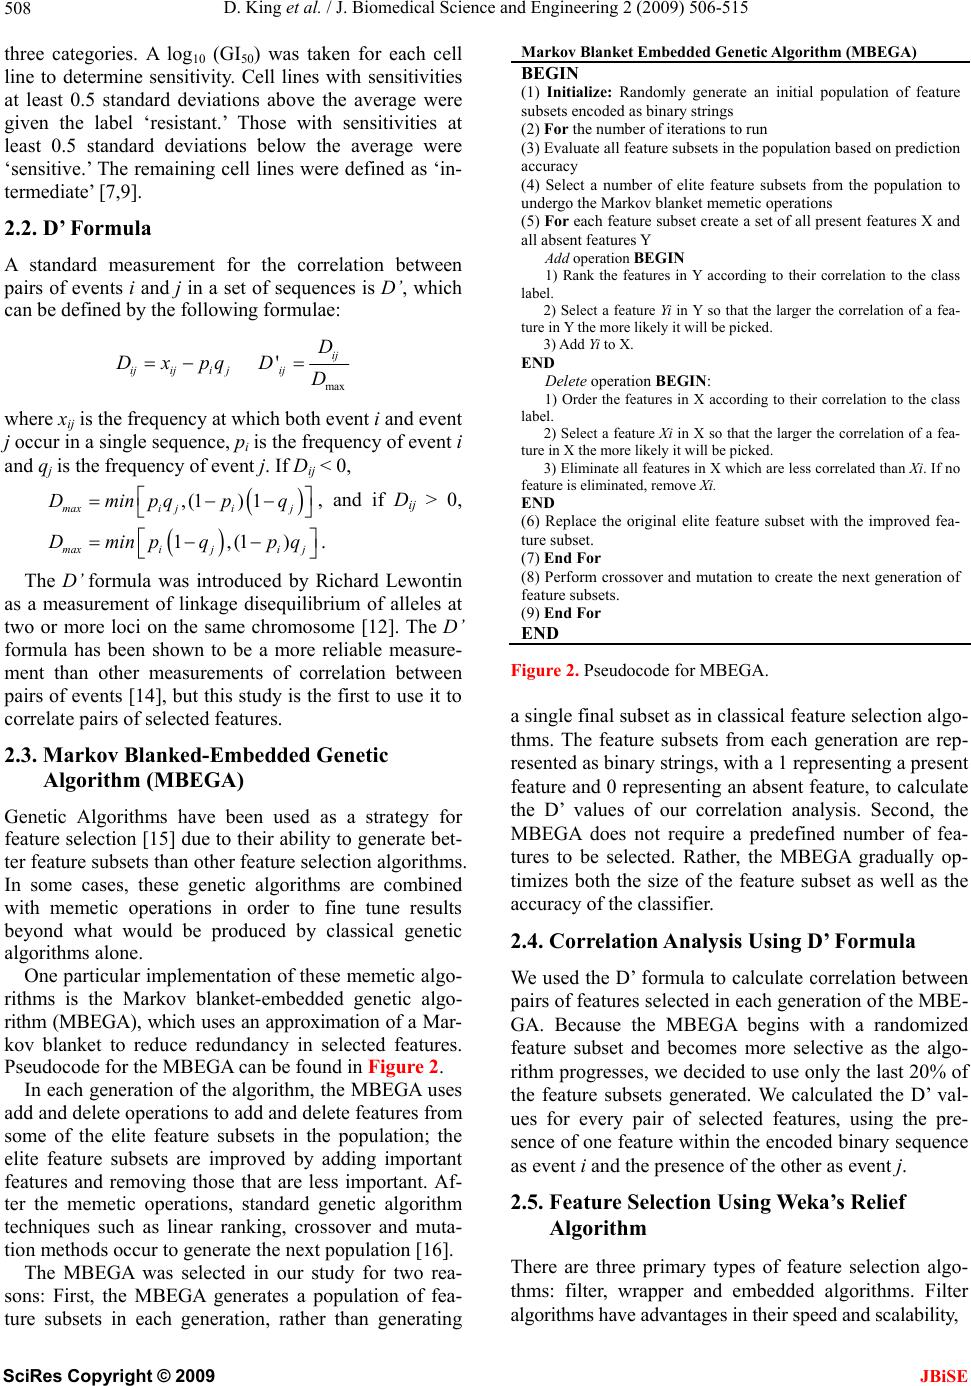 D. King et al. / J. Biomedical Science and Engineering 2 (2009) 506-515 508 three categories. A log10 (GI50) was taken for each cell line to determine sensitivity. Cell lines with sensitivities at least 0.5 standard deviations above the average were given the label ‘resistant.’ Those with sensitivities at least 0.5 standard deviations below the average were ‘sensitive.’ The remaining cell lines were defined as ‘in- termediate’ [7,9]. 2.2. D’ Formula A standard measurement for the correlation between pairs of events i and j in a set of sequences is D’, which can be defined by the following formulae: ijiji j Dxpq max 'ij ij D DD where xij is the frequency at which both event i and event j occur in a single sequence, pi is the frequency of event i and qj is the frequency of event j. If Dij < 0, ,(1) 1 maxi jij Dminp qpq , and if Dij > 0, 1,(1) maxiji j Dminpqpq . The D’ formula was introduced by Richard Lewontin as a measurement of linkage disequilibrium of alleles at two or more loci on the same chromosome [12]. The D’ formula has been shown to be a more reliable measure- ment than other measurements of correlation between pairs of events [14], but this study is the first to use it to correlate pairs of selected features. 2.3. Markov Blanked-Embedded Genetic Algorithm (MBEGA) Genetic Algorithms have been used as a strategy for feature selection [15] due to their ability to generate bet- ter feature subsets than other feature selection algorithms. In some cases, these genetic algorithms are combined with memetic operations in order to fine tune results beyond what would be produced by classical genetic algorithms alone. One particular implementation of these memetic algo- rithms is the Markov blanket-embedded genetic algo- rithm (MBEGA), which uses an approximation of a Mar- kov blanket to reduce redundancy in selected features. Pseudocode for the MBEGA can be found in Figure 2. In each generation of the algorithm, the MBEGA uses add and delete operations to add and delete features from some of the elite feature subsets in the population; the elite feature subsets are improved by adding important features and removing those that are less important. Af- ter the memetic operations, standard genetic algorithm techniques such as linear ranking, crossover and muta- tion methods occur to generate the next population [16]. The MBEGA was selected in our study for two rea- sons: First, the MBEGA generates a population of fea- Markov Blanket Embedded Genetic Algorithm (MBEGA) BEGIN (1) Initialize: Randomly generate an initial population of feature subsets encoded as binary strings (2) For the number of iterations to run (3) Evaluate all feature subsets in the population based on prediction accuracy (4) Select a number of elite feature subsets from the population to undergo the Markov blanket memetic operations (5) For each feature subset create a set of all present features X and all absent features Y Add operation BEGIN 1) Rank the features in Y according to their correlation to the class label. 2) Select a feature Yi in Y so that the larger the correlation of a fea- ture in Y the more likely it will be picked. 3) Add Yi to X. END Delete operation BEGIN: 1) Order the features in X according to their correlation to the class label. 2) Select a feature Xi in X so that the larger the correlation of a fea- ture in X the more likely it will be picked. 3) Eliminate all features in X which are less correlated than Xi. If no feature is eliminated, remove Xi. END (6) Replace the original elite feature subset with the improved fea- ture subset. (7) End For (8) Perform crossover and mutation to create the next generation of feature subsets. (9) End For END Figu . Pseudocode for MBEGA. a single final subset as in classical feature selection algo- Using D’ Formula ween Thereary types of feature selection algo- re 2 thms. The feature subsets from each generation are rep- resented as binary strings, with a 1 representing a present feature and 0 representing an absent feature, to calculate the D’ values of our correlation analysis. Second, the MBEGA does not require a predefined number of fea- tures to be selected. Rather, the MBEGA gradually op- timizes both the size of the feature subset as well as the accuracy of the classifier. 2.4. Correlation Analysis We used the D’ formula to calculate correlation bet pairs of features selected in each generation of the MBE- GA. Because the MBEGA begins with a randomized feature subset and becomes more selective as the algo- rithm progresses, we decided to use only the last 20% of the feature subsets generated. We calculated the D’ val- ues for every pair of selected features, using the pre- sence of one feature within the encoded binary sequence as event i and the presence of the other as event j. 2.5. Feature Selection Using Weka’s Relief Algorithm are three prim thms: filter, wrapper and embedded algorithms. Filter algorithms have advantages in their speed and scalability, ture subsets in each generation, rather than generating SciRes Copyright © 2009 JBiSE  D. King et al. / J. Biomedical Science and Engineering 2 (2009) 506-515 SciRes Copyright © 2009 509 able 1. Highly correlated protein marker pairs in protein52 based on significant chemosensitivity protein markers. The protein 1 2 3 4 5 6 7 8 9 10 JBiSE however they ignore feature dependencies. They also do not interact with classifiers, which is both an advantage, because they can select features independently, and a disadvantage, because they are unable to take the classi- fier into account when determining the feature subset. Wrapper algorithms, on the other hand, do interact with the classifier, and are therefore able to produce more informative feature subsets. They are also less prone to local optima. They are, however, computationally inten- se, and have a higher risk of over fitting. Embedded al- gorithms are built directly into a classifier. As such, they are able to interact with the classifier in the same manner as wrapper algorithms, but are far less computationally intense. Relief, a filter feature selection algorithm imple- mented in WEKA, was used to assess the features pairs found by our correlation analysis. Relief ranks features by assigning them weights according to their ability to T markers in column one and associated drugs, expressed as their NSC drug numbers, in column two were found in [9]. The remaining columns are the ten protein markers with the highest correlation to the protein marker in the first column. The markers notated with a * are those also selected by Weka’s Relief algorithm. Protein NSC Marker Drug # ISGF3g 56410 MAPK1 300* N E1* K3B DD AT1* AT3 AT5A 6 EPMSNMGSFASTSTSTMSH ISGF3g 354646 MGMT * * 8 * MGMT VIL1 RIPK1EP300 EP300 MSN GSK3B FADD STAT5A MSH2 STAT3 56410 EP300* EP300MSN GSK3BFADD ISGF3GSTAT1* STAT5ASTAT6* MSH2 NME1 353451 FN1 MVP RELA MSN CDH1*MGMT GSK3B FADD ISGF3G*STAT5A NME1 344007 KRT1EP300MAPK1CDH1GSK3B FADD ISGF3GSTAT3* STAT5A NME1 102816 TP53 EP300 MGMT* CCNE MAP2K1CDH1* MGMT*GSK3B FADD STAT3* NME1 107392 KRT8 MSN* CDH1 MGMT*GSK3B FADD ISGF3G STAT3* STAT5AMSH2 MGMT 95466 KRT18*CDH2 EP300 MSN EP300 MSN* CDH1 NME1* GSK3B ISGF3G CCNE 95441 KRT8* CCNA2 CCNB1VIL1*CDH1 RELA RIPK1 JAK1 MAP2K2STAT5A EP300 119875 KRT18 EP300 CDH2 KRT20 FN1 MSN CCNB1*JAK1 MAP2K1 MAP2K EP300 606497 EP300 CDH2 KRT20 FN1 KRT8 1 CCNBCCNE RIPK1STAT3* MAP2K FN1 135758 KRT18 CDH2 KRT20 KRT8 K2 28 * * 1 2* * 3 K2 B A 0 1 2 * 1 T K1 * * 1 CCNA2 CCNB1 CCNE VIL1 MAP2K2ISGF3G MSN 301739 KRT20 MAPK1MCP MCM7CDK6 G22P1 MVP PGR MAP2K2 FADD MSN 755 KRT18 CDH2 MCM7CDK6* G22P1 MVP PGR MAP2FADD STAT1 MSN 3761PCNA MCP CDK6 G22P1 MVP* PGR CCNEVIL1 CDH1*EP300 PGR 354646 MSN MVP CCNA2CCNB1*CCNE CDH1CASP2 RIPK1EP300 FADD STAT1 354646 KRT20MAPKG22P1 MVP MAP2KMSN NME1* FADD STAT3 STAT5A STAT6 354646 EP300 PCNA MAPK1FADDISGF3G STAT3STAT5A MSH2 MSH6 EP300 CASP2 264880 CCNA2CCNE VIL1 CDH1 RELA* RIPK1 JAK1* STAT3 EP300 STAT1 CDH1 71261 MAPK1 CCNE VIL1* RELA* CASP2 EP300 EP300 CDH1 NME1 MSH2* MCP 740 TP53 EP300 EP300 KRT20 ACVR2*MCM7*CDK6 CCNB1VIL1 EP300 KRT18 1989TP53 EP300 CDH2 EP300 FN1* KRT8 PGR JAK1 MAP2 EP300 KRT18 757 TP53 EP300 RELA STAT3 EP300 CDH1 GSK3STAT5MSH6 EP300 KRT18 3341TP53 EP300 CDH2 EP300 KRT20*RIPK1 MAP2K2MSN MSH6 EP300 KRT18 125973 TP53 EP300 CDH2 EP300*KRT20 CDK6 CCNA2 CCNERELA EP300 KRT18 658831 TP53 EP300 KRT20 FN1* MAPK1 MSN G22P1 JAK1 CDH1 EP300 KRT18 673188 TP53 EP300 CDH2 FN1 GSK3B* FADD*STAT5ASTAT6MSH6 EP300 KRT18 671867 TP53 EP300 CDH2 EP300 CCNB1 CASP2 EP300 MAP2KMSH6 EP300 KRT18 664402 TP53 EP300 CDH2 EP300 MVP PGR JAK1 EP300 STAT6 EP300 KRT18 661746 TP53 EP300 CDH2 EP300 ACVRMCP EP300 MSN CDH1* EP300 KRT18 673187 TP53 EP300 CDH2* ACVR2CDK6 VIL1 STAT6 MSH2MSH6* EP300 KRT18 664404 TP53 EP300 CDH2 KRT20 RB1 MAPKEP300 EP300 STAT5A*EP300 KRT18 671870 TP53 EP300 CDH2 KRT20*FN1 PCNA CDH1 CASP2 STAT6 EP300* KRT18 666608 TP53 EP300 CDH2 EP300 KRT20 MAPK1CCNB1RIPK1 STAT3 MGMT KRT18 600222 TP53 EP300*CDH2* RB1 G22P1 PGR CCNA2 MSN STAT3 STAT5A KRT18 656178 EP300 EP300 EP300 MGMMAPK1MSN G22P1 MAP2 STAT5ASTAT6 TP53 19893 KRT18 CDH2 RB1 MAPK1 EP300 CDK6 MSN STAT6 MSH6 EP300 TP53 125973KRT18* KRT20 FN1*MGMT MAPK1ERBB2 MCM7STAT6 MSH6 EP300 RELA 153353 CDH2* MSN G22P1VIL1 CDH1 CASP2 RIPK1* JAK1 MAP2KMAP2K G22P1 224131 EP300 MAPK1 MSN MVP* CCNA2CCNB1 RIPK1 EP300* MAP2K2 EP300 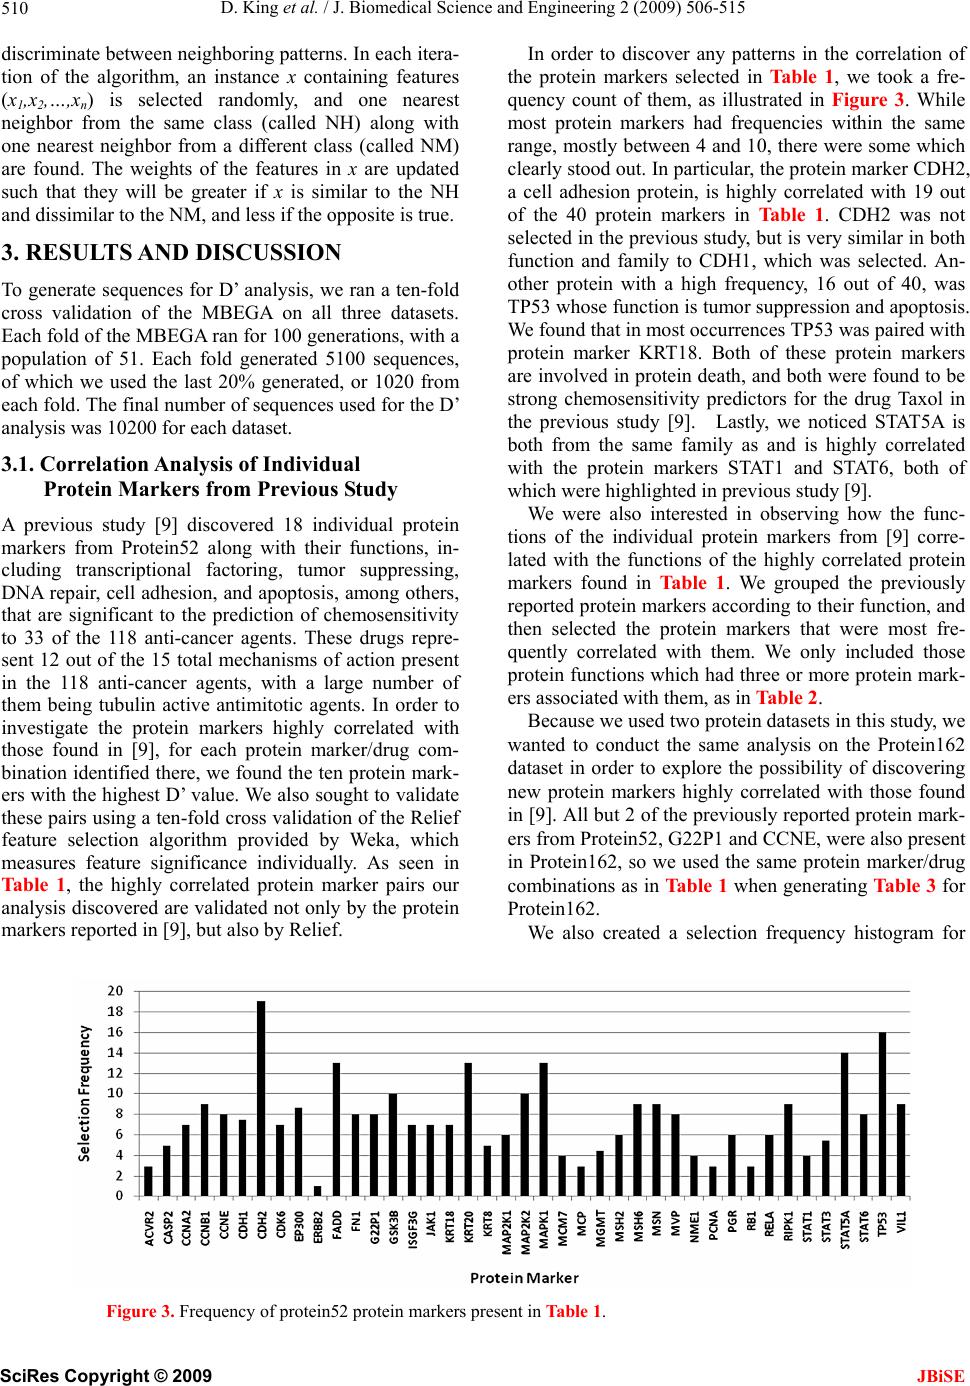 D. King et al. / J. Biomedical Science and Engineering 2 (2009) 506-515 510 dineehboter each n a ten-fold vidual A prrotein ordiscy p inel th iscrimate betwn neigring patns. In itera- tion of the algorithm, an instance x containing features (x1,x2,…,xn) is selected randomly, and one nearest neighbor from the same class (called NH) along with one nearest neighbor from a different class (called NM) are found. The weights of the features in x are updated such that they will be greater if x is similar to the NH and dissimilar to the NM, and less if the opposite is true. 3. RESULTS AND DISCUSSION To generate sequences for D’ analysis, we ra cross validation of the MBEGA on all three datasets. Each fold of the MBEGA ran for 100 generations, with a population of 51. Each fold generated 5100 sequences, of which we used the last 20% generated, or 1020 from each fold. The final number of sequences used for the D’ analysis was 10200 for each dataset. 3.1. Correlation Analysis of Indi Protein Markers from Previous Study evious study [9] discovered 18 individual p markers from Protein52 along with their functions, in- cluding transcriptional factoring, tumor suppressing, DNA repair, cell adhesion, and apoptosis, among others, that are significant to the prediction of chemosensitivity to 33 of the 118 anti-cancer agents. These drugs repre- sent 12 out of the 15 total mechanisms of action present in the 118 anti-cancer agents, with a large number of them being tubulin active antimitotic agents. In order to investigate the protein markers highly correlated with those found in [9], for each protein marker/drug com- bination identified there, we found the ten protein mark- ers with the highest D’ value. We also sought to validate these pairs using a ten-fold cross validation of the Relief feature selection algorithm provided by Weka, which measures feature significance individually. As seen in Table 1, the highly correlated protein marker pairs our analysis discovered are validated not only by the protein markers reported in [9], but also by Relief. Iner to dover anatterns the corration of e protein markers selected in Ta bl e 1 , we took a fre- quency count of them, as illustrated in Figure 3. While most protein markers had frequencies within the same range, mostly between 4 and 10, there were some which clearly stood out. In particular, the protein marker CDH2, a cell adhesion protein, is highly correlated with 19 out of the 40 protein markers in Table 1. CDH2 was not selected in the previous study, but is very similar in both function and family to CDH1, which was selected. An- other protein with a high frequency, 16 out of 40, was TP53 whose function is tumor suppression and apoptosis. We found that in most occurrences TP53 was paired with protein marker KRT18. Both of these protein markers are involved in protein death, and both were found to be strong chemosensitivity predictors for the drug Taxol in the previous study [9]. Lastly, we noticed STAT5A is both from the same family as and is highly correlated with the protein markers STAT1 and STAT6, both of which were highlighted in previous study [9]. We were also interested in observing how the func- tions of the individual protein markers from [9] corre- lated with the functions of the highly correlated protein markers found in Table 1. We grouped the previously reported protein markers according to their function, and then selected the protein markers that were most fre- quently correlated with them. We only included those protein functions which had three or more protein mark- ers associated with them, as in Table 2. Because we used two protein datasets in this study, we wanted to conduct the same analysis on the Protein162 dataset in order to explore the possibility of discovering new protein markers highly correlated with those found in [9]. All but 2 of the previously reported protein mark- ers from Protein52, G22P1 and CCNE, were also present in Protein162, so we used the same protein marker/drug combinations as in Table 1 when generating Table 3 for Protein162. We also created a selection frequency histogram for Figure 3. Frequency of protein52 protein markers present in Table 1. SciRes Copyright © 2009 JBiSE 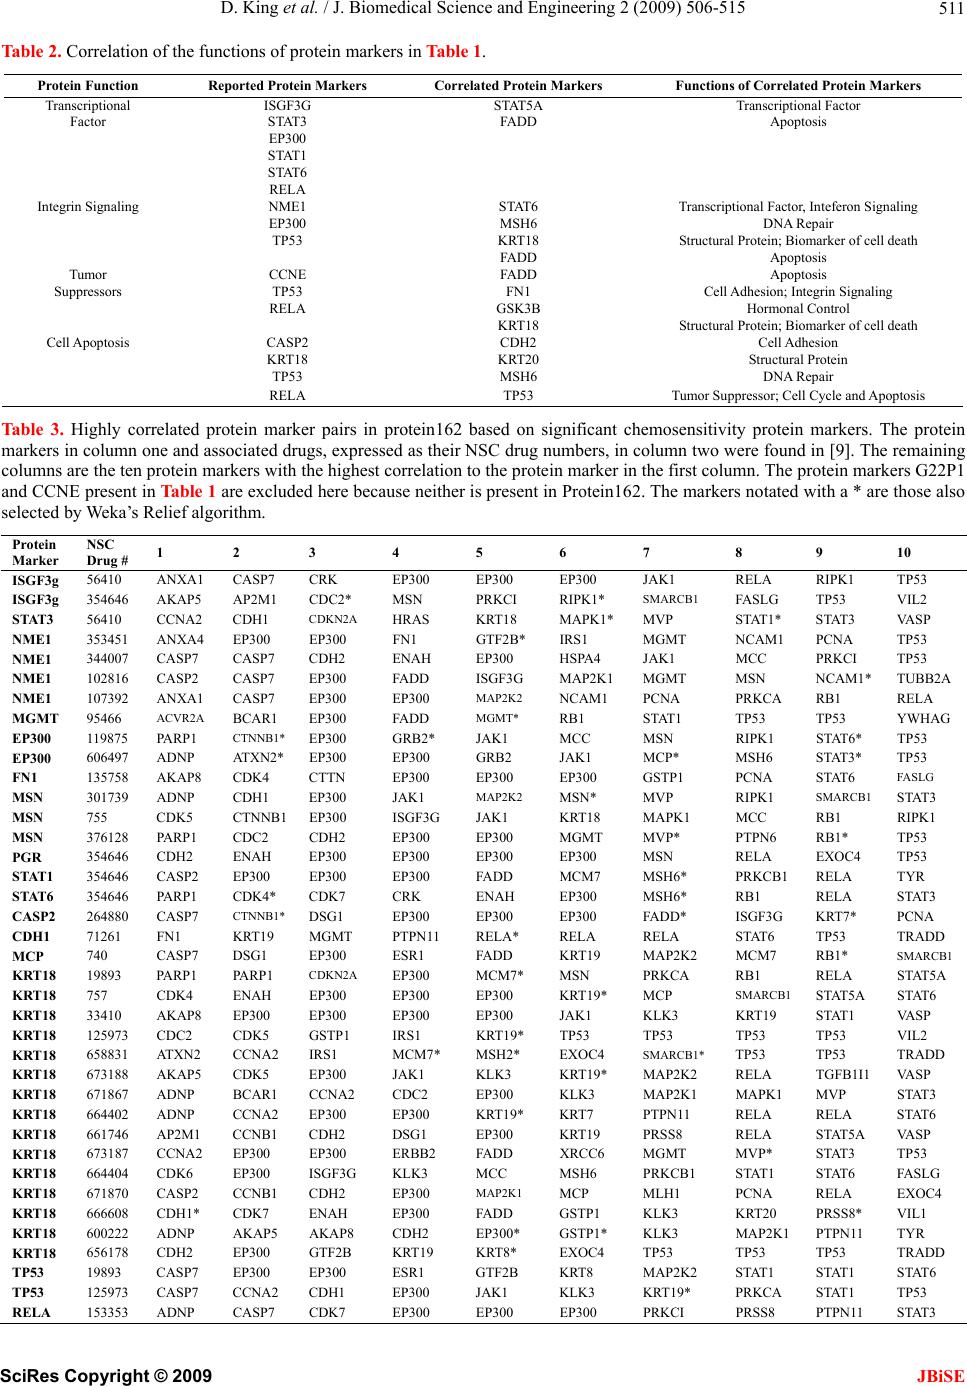 D. King et al. / J. Biomedical Science and Engineering 2 (2009) 506-515 511 Table 2. Corre Protein Markers Functions of Correlated Protein Markers lation of the functions of protein markers in Table 1. Protein Function Reported Protein Markers Correlated Transcriptional ISGF3G STAT5A Transcriptional Factor Factor STAT3 FADD Apoptosis EP300 STAT1 STAT6 RELA Integrin aling SignNME1 ST6 ATTranscriptional Factteferon Signaling or, In EP300 MSH6 DNApair Re TP53 KRT18 Structural Protein; Biomarker of cell death FADD Apoptosis Tu r mo CCNE FADD Apoptosis Supp sors res T P53FN1 Cell Adhesi Signaling on; Integrin RELA GSK3B Horrol monal Cont KRT18 Struath ctural Protein; Biomarker of cell de Cell Apoptosis CASP2 CDH2 Cell Adhesion KRT18 KRT20 Structural Protein TP53 MSH6 DNA Repair RELA TP53 Tumor Supprd Apoptosis essor; Cell Cycle an Table 3. Highly correlated protein marker pairs in protein162 baseicant chemotein 3 4 5 6 7 8 9 10 d on signifsensitivity protein markers. The pro markers in column one and associated drugs, expressed as their NSC drug numbers, in column two were found in [9]. The remaining columns are the ten protein markers with the highest correlation to the protein marker in the first column. The protein markers G22P1 and CCNE present in Table 1 are excluded here because neither is present in Protein162. The markers notated with a * are those also selected by Weka’s Relief algorithm. Protein Marker NSC Drug # 1 2 ISGF3g 56410 ANXA1 SP7 K 300 EP300 EP300 K1 LA K1 3 CACREPJARERIPTP5 ISGF3g 354646 AKAP5 CCNA2 AP2M1 CDH1 CDC2 CDKN2 * 1 * 2A 6* 1 4 1 1 9 1* I1 1 1 D 2 MSN HRAS PRKCI KRT18 RIPK1* MAPK1 SMARCB MVP FASLG TP5 STAT1* 3 STAT3 VIL2 VASP STAT3 56410 A EP300 * IRS1 NME1 353451 ANXA4 EP300 FN1 GTF2B*MGMT NCAM1PCNA PRKCI TP53 NME1 344007 102816 CASP7 CASP7 CDH2 ENAH EP300 HSPA4 JAK1 MCC TP53 NME1 CASP2 CASP7 EP300 FADD EP300 ISGF3G MAP2K1 NCAM1 MGMT MSN NCAM1TUBB NME1 107392 ANXA1 CASP7 EP300 MAP2K2 MGMT* PCNA RB1 PRKCARB1 RELA MGMT 95466 ACVR2A BCAR1 EP300 FADD STAT1 TP53 TP53 YWHAG EP300 119875 PARP1 CTNNB1* EP300 GRB2* JAK1 MCC MSN RIPK1 STATTP53 EP300 606497 ADNP 135758 ATXN2*EP300 EP300 GRB2 JAK1 EP300 GSTP1 MCP* MSH6 PCNA STAT3* STAT6 TP53 FN1 AKAP8 CDK4 CTTN EP300 EP300 FASLG MSN 301739 ADNP CDH1 EP300 JAK1 MAP2K2MSN* MVP RIPK1 SMARCB1 STAT3 MSN 755 CDK5 CTNNBEP300 ISGF3GJAK1 KRT18 MAPK1MCC RB1 RIPK1 MSN 376128 PARP1 CDC2 CDH2 EP300 EP300 MGMT MVP* MSN PTPN6 RB1* TP53 PGR 354646 354646 CDH2 ENAH EP300 EP300 EP300 EP300 RELA EXOCTP53 STAT1 CASP2 EP300 EP300 EP300 FADD MCM7 MSH6*PRKCB1RELA TYR STAT6 354646 PARP1 CDK4* CDK7 CRK ENAH EP300 MSH6* FADD* RB1 RELA STAT3 CASP2 264880 CASP7 CTNNB1* KRT19 DSG1 EP300 EP300 EP300 ISGF3G KRT7* PCNA TRADD CDH1 71261 FN1 MGMTPTPN1RELA* RELA RELA STAT6 MCM7 TP53 MCP 740 CASP7 DSG1 EP300 ESR1 FADD KRT19 MAP2K2RB1* SMARCB1 STAT5A KRT18 19893 PARP1 CDK4 PARP1 CDKN2A EP300 MCM7* MSN PRKCA MCP RB1 RELA KRT18 KRT18 757 ENAH EP300 EP300 EP300 KRT19* SMARCB STAT5A STAT6 33410 AKAP8 EP300 EP300 EP300 EP300 JAK1 KLK3 KRT1 STAT1 VASP KRT18 125973 658831 CDC2 CDK5 GSTP1 IRS1 KRT19*TP53 TP53 TP53 TP53 VIL2 KRT18 673188 A TXN2 CCNA2 IRS1 MCM7*MSH2* KLK3 EXOC4 SMARCB TP53 TP53 TRADD KRT18 AKAP5 ADNP CDK5 EP300 JAK1 KRT19*MAP2K2 MAP2K1 RELA TGFB1VASP KRT18 671867 BCAR1 CCNA2 EP300 CDC2 EP300 KLK3 MAPKMVP STAT3 KRT18 664402 ADNP CCNA2 CCNB1 EP300 KRT19*KRT7 PTPN11 RELA RELA STAT6 KRT18 661746 AP2M1 CDH2 DSG1 EP300 KRT19 PRSS8 RELA STAT5A VASP KRT18 673187 CCNA2 CDK6 EP300 EP300 ERBB2FADD XRCC6MGMT MVP* STAT3 TP53 KRT18 664404 EP300 ISGF3G KLK3 MCC MSH6 PRKCB1STAT1 STAT6 FASLG KRT18 671870 CASP2 CCNB1 CDH2 EP300 MAP2K1MCP MLH1 PCNA RELA EXOC4 VIL1 KRT18 666608 CDH1* ADNP CDK7 ENAH EP300 FADD GSTP1 KLK3 KRT20 PRSS8* KRT18 600222 AKAP5 AKAP8CDH2 EP300* GSTP1* EXOC4 KLK3 MAP2KPTPN11 TP53 TYR KRT18 656178 CDH2 EP300 GTF2B KRT19 KRT8* TP53 TP53 TRAD TP53 19893 CASP7 EP300 EP300 ESR1 GTF2B KRT8 MAP2KSTAT1 STAT1 STAT6 TP53 125973 CASP7 CCNA2CDH1 EP300 JAK1 KLK3 KRT19* PRKCASTAT1 PTPN11 TP53 RELA 153353ADNP CASP7 CDK7 EP300 EP300 EP300 PRKCI PRSS8 STAT3 SciRes Copyright © 2009 JBiSE 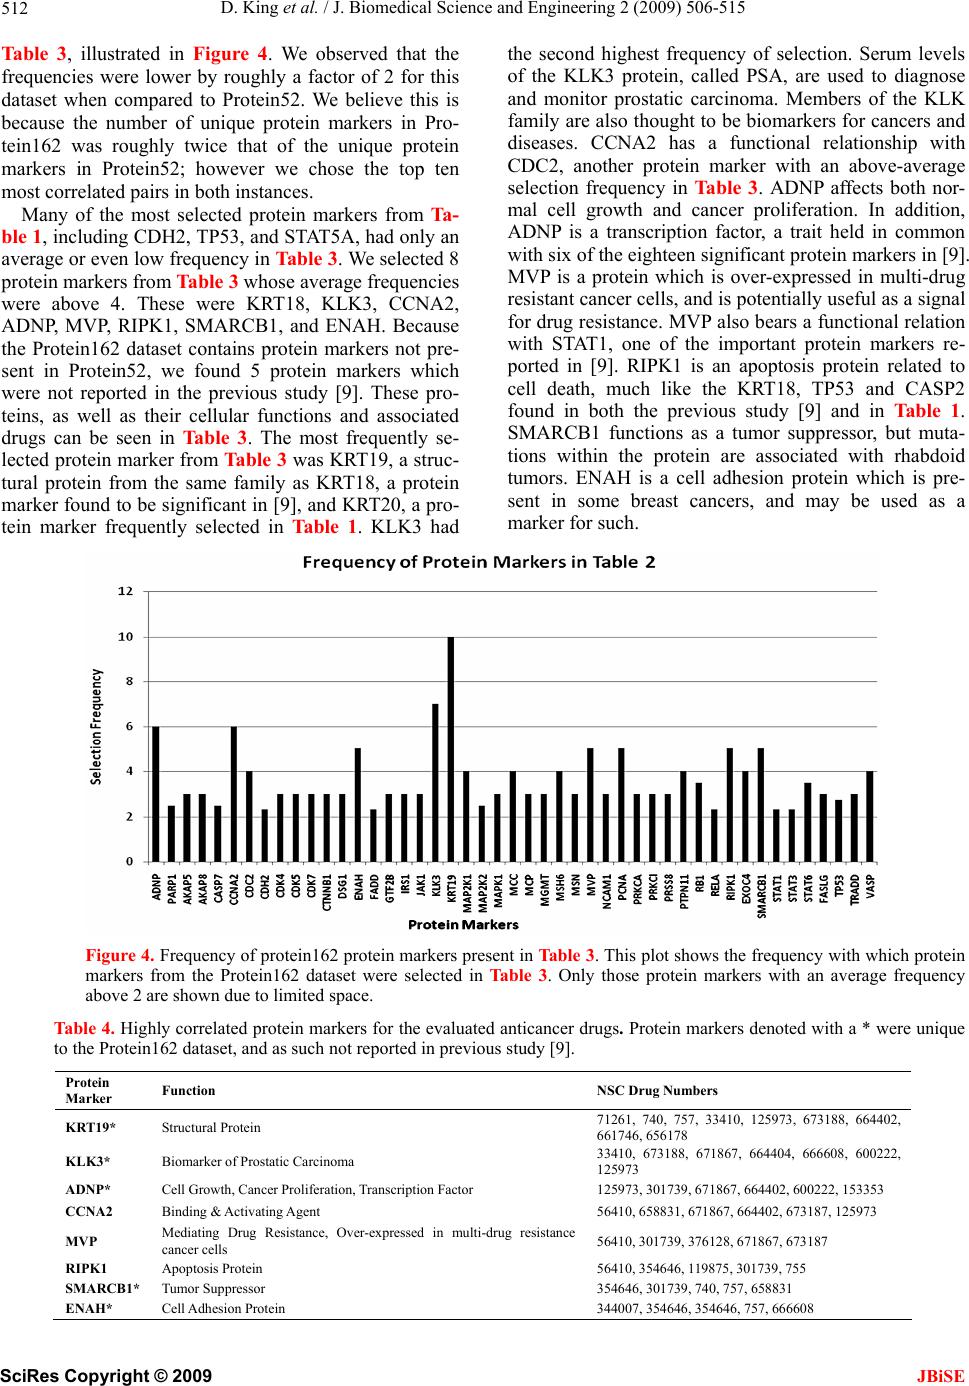 D. King et al. / J. Biomedical Science and Engineering 2 (2009) 506-515 512 T, egu ervedhe e seighuenclecels the3 prcalle, arto se able 3illustrat d in Fire 4. W obse that t fe ly r a of 2is dataset when compared to Protein52. We believe this is because the number of unique protein markers in Pro- tein162 was roughly twice that of the unique protein markers in Protein52; however we chose the top ten most correlated pairs in both instances. Many of the most selected protein markers from Ta- ble 1, including CDH2, TP53, and STAT requencis wereower boughlyfactor for th 5A, had only an average or even low frequency in Table 3. We selected 8 protein markers from Table 3 whose average frequencies were above 4. These were KRT18, KLK3, CCNA2, ADNP, MVP, RIPK1, SMARCB1, and ENAH. Because the Protein162 dataset contains protein markers not pre- sent in Protein52, we found 5 protein markers which were not reported in the previous study [9]. These pro- teins, as well as their cellular functions and associated drugs can be seen in Table 3 . The most frequently se- lected protein marker from Table 3 was KRT19, a struc- tural protein from the same family as KRT18, a protein marker found to be significant in [9], and KRT20, a pro- tein marker frequently selected in Table 1. KLK3 had and monitor prostatic carcinoma. Members of the KLK family are also thought to be biomarkers for cancers and diseases. CCNA2 has a functional relationship with CDC2, another protein marker with an above-average selection frequency in Ta b le 3 . ADNP affects both nor- mal cell growth and cancer proliferation. In addition, ADNP is a transcription factor, a trait held in common with six of the eighteen significant protein markers in [9]. MVP is a protein which is over-expressed in multi-drug resistant cancer cells, and is potentially useful as a signal for drug resistance. MVP also bears a functional relation with STAT1, one of the important protein markers re- ported in [9]. RIPK1 is an apoptosis protein related to cell death, much like the KRT18, TP53 and CASP2 found in both the previous study [9] and in Table 1. SMARCB1 functions as a tumor suppressor, but muta- tions within the protein are associated with rhabdoid tumors. ENAH is a cell adhesion protein which is pre- sent in some breast cancers, and may be used as a marker for such. thcond hest freqy of setion. Serum lev of KLKotein, d PSAe used diagno Figure 4. Frequency of protein162 protein markers present in Table 3. This plot shows the frequency with which protein markers from the Protein162 dataset were selected in Table 3. Only those protein markers with an averagquency Tab to thevious study [9]. e fre above 2 are shown due to limited space. le 4. Highly correlated protein markers for the evaluated anticancer drugs. Protein markers denoted with a * were unique e Protein162 dataset, and as such not reported in pr Protein Marker Function NSC Drug Numbers KRT19* Structural Protein 71261, 740, 757, 33410, 125973, 673188, 664402, 661746, 656178 KLK3* Biomarker of Prostatic Carcinoma 33410, 673188, 671867, 664404, 666608, 600222, 125973 ADNP* Cell Growth, Cancer Proliferation, Transcription Factor 125973, 301739, 671867, 664402, 600222, 153353 CCNA2 Binding & Activating Agent 56410, 658831, 671867, 664402, 673187, 125973 MVP Mediating Drug Resistance, Over-expressed in multi-drug resistance cancer cells 56410, 301739, 376128, 671867, 673187 RIPK1 Apoptosis Protein 56410, 354646, 119875, 301739, 755 SMARCB1* Tumor Suppressor 354646, 301739, 740, 757, 658831 ENAH* Cell Adhesion Protein 344007, 354646, 354646, 757, 666608 SciRes Copyright © 2009 JBiSE  D. King et al. / J. Biomedical Science and Engineering 2 (2009) 506-515 513 Figure 5. D’ patterns categorized according to mechanism of action. The drugs which alkylate at N7 and O6 produce similar patterns of D’ values in each of the three datasets. For readability, the curves displayed are maverage .2. Featur f the featurealso calculated the average D’ values ev cular, we noticed that to- oving curves with a period of 20 for Protein162 and DNA166 and a period of 7 for Protein52. e Correlation Analysis of All 118 related mechanisms. In parti 3Drugs In addition to simply calculating the D’ values o pairs, we for each feature based on the D’ values of all pairs asso- ciated with that feature. We performed this analysis for both protein datasets as well as the DNA166 dataset, using the protein markers as features for the protein datasets, and the DNA copy number variations as fea- tures for the DNA166 dataset. As an exploratory analysis, we attempted to use the average D’ values to find the trends of feature correlation within and between the mechanisms of action of the 118 anti-cancer agents. Each dataset generated unique patterns of feature cor- relation in each of the 118 drugs. We did observe, how- er, similar patterns of feature correlation in drugs with poisomerase I inhibitors and topoisomerase II inhibitors have very similar trends of feature correlation to one another in all three datasets. Drugs which alkylate at positions N7 (24 drugs) and O6 (7 drugs) of guanine also have very similar trends of feature correlation, as shown in Figure 5. This implies that related drug mechanisms tend to produce similar patterns of correlation between feature pairs. Our analysis indicated that this is not nec- essarily true of drugs with similar chemical structure. We also grouped drugs with similar mechanisms into three larger categories: drugs which alkylate at specific positions of guanine (Alkylating), drugs which inhibit to- poisomerase (TIM Inhibitors), and all other drugs (Other). The D’ values of these larger categories were generated by averaging the D’ values of the individual drugs within that larger category. We found the correlation SciRes Copyright © 2009 JBiSE 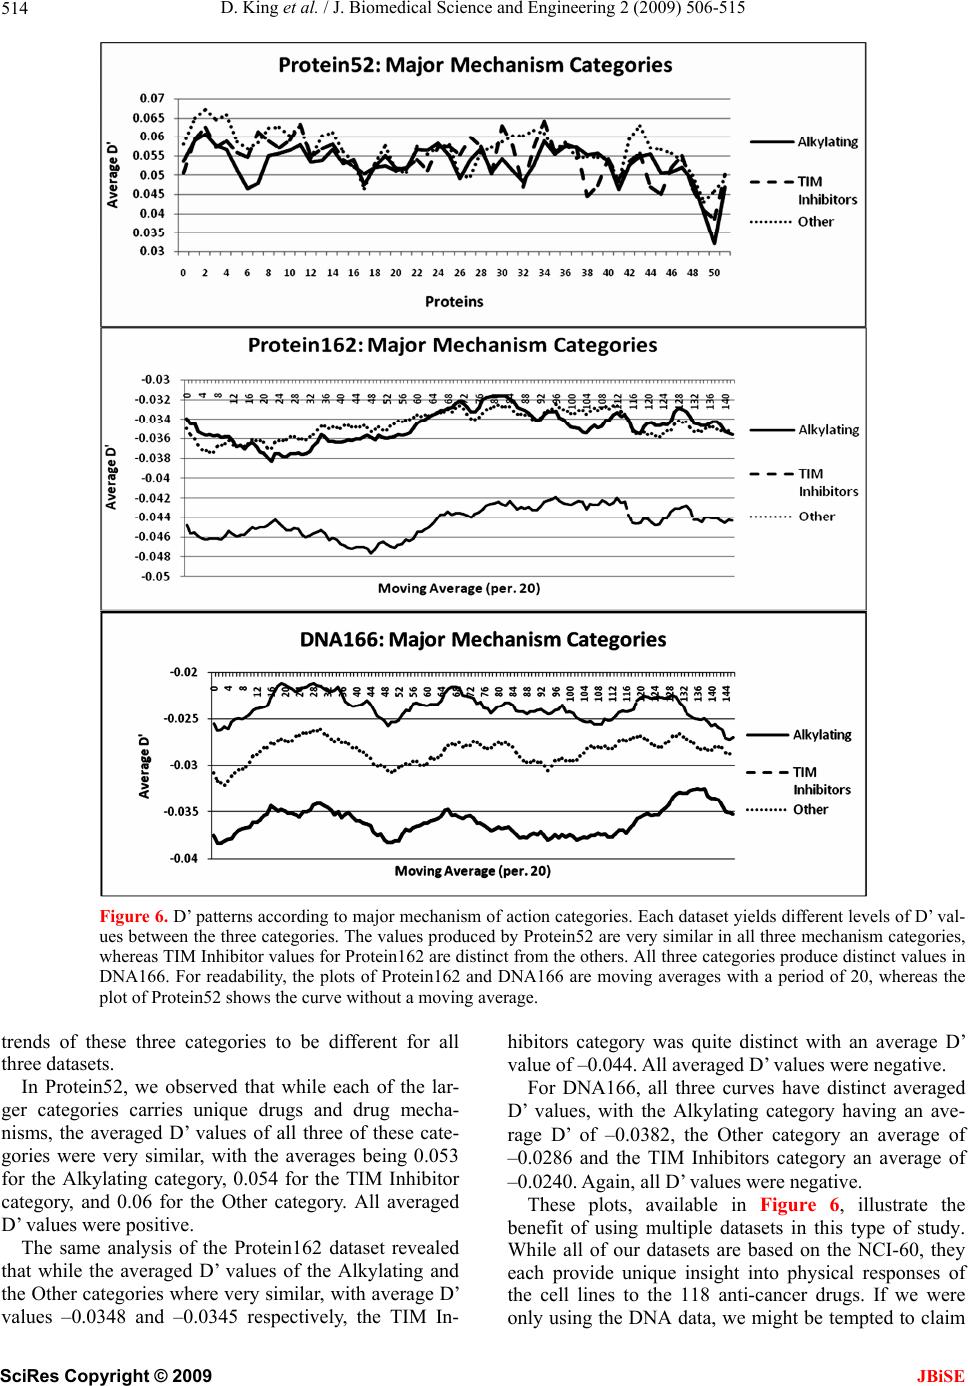 D. King et al. / J. Biomedical Science and Engineering 2 (2009) 506-515 514 Figure 6. D’ patterns according to major mechanism of action categories. Each dataset yields different levels of D’ val- ues between the three categories. The values produced by Protein52 are very similar in all three mechani categories, trends of th ree datasets. unique drugs and drug mecha- ni ’ values of the Alkylating and th rs category was quite distinct with an average D’ value of –0.044. All averaged D’ values were negative. –0 ponses of th sm whereas TIM Inhibitor values for Protein162 are distinct from the others. All three categories produce distinct values in DNA166. For readability, the plots of Protein162 and DNA166 are moving averages with a period of 20, whereas the plot of Protein52 shows the curve without a moving average. ese three categories to be different for all hibito th In Protein52, we observed that while each of the lar- ger categories carries sms, the averaged D’ values of all three of these cate- gories were very similar, with the averages being 0.053 for the Alkylating category, 0.054 for the TIM Inhibitor category, and 0.06 for the Other category. All averaged D’ values were positive. The same analysis of the Protein162 dataset revealed that while the averaged D e Other categories where very similar, with average D’ values –0.0348 and –0.0345 respectively, the TIM In- For DNA166, all three curves have distinct averaged D’ values, with the Alkylating category having an ave- rage D’ of –0.0382, the Other category an average of –0.0286 and the TIM Inhibitors category an average of .0240. Again, all D’ values were negative. These plots, available in Figure 6, illustrate the benefit of using multiple datasets in this type of study. While all of our datasets are based on the NCI-60, they each provide unique insight into physical res e cell lines to the 118 anti-cancer drugs. If we were only using the DNA data, we might be tempted to claim SciRes Copyright © 2009 JBiSE  D. King et al. / J. Biomedical Science and Engineering 2 (2009) 506-515 515 that these three mechanism categories produce distinctly different D’ values, whereas if we were only using the data from Protein52, we might claim the opposite. It is only when a wide range of data are used in study that a holistic understanding of the effects of these 118 drugs becomes possible. 4. CONCLUSIONS We found that each of our datasets provides a unique insight into the analysis of feature correlations in the ity of the NCI-60 cancer lines. 52, DNA166) have been u P., , , Mesirov, J. P., Lander, E. S., and 001) Chemosensitivity prediction by ary, K. K., Reimers, M. A., d Guo L., (2006) Predicting cancer drug response e, L., Kohn, K. W., Reinhold, W. C., Myers, T. , V., Harner, E. J., and Guo, N. L., (2009) An uo, W., Gwadry, F., Ajay, Kouros-Mehr, H., s in bioinformatics. Bioinfor- siderations, Heterotic Models, ouros-Mehr, H., Bussey, 1−341. ournal of thm for gene selection, Pat- study of the chemosensitiv Two of the three (Proteinsed by proteomic profiling, Clin. Cancer Res., 12, 4583− 4589. [8] Scherf U., Ross D. T., Waltham M., Smith L. H., Lee, J. K., Tanab in previous studies for the prediction of chemosensitivity of cancerous cells, and though Protein162 was novel to this topic, we have shown that both Protein162 and Pro- tein52 contain a number of protein markers that are both medically significant and highly correlated to individual protein markers highlighted in previous study [9]. In addition, we have shown D’ to be an accurate measure of correlation in the context of feature selection for the first time. 5. ACKNOWLEDGEMENTS We would like to thank Houghton College for its financial support. REFERENCES [1] Staunton, J. E., Slonim, D. K., Coller, H. A., Tamayo, Angelo, M. J., Park, J., Scherf, U., Lee, J. K., Reinhold W. O., Weinstein, J. N. Golub, T. R., (2 transcriptional profiling, PNAS, 98, 10787−10792. [2] Potti, A., Dressman, H. K., Bild, A., Riedel, R. F., Chan, G., Sayer, R., Cragun, J., Cottrill, H., Kelley, M. J., Pe- tersen, R., Harpole, D., Marks, J., Berchuck, A., Gins- burg, G. S., Febbo, P., Lancaster, J., and Nevins, J. R., (2006) Genomic signatures to guide the use of chemot- herapeutics. Nature Medicine, 12, 1294−1300. [3] Paweletz, C. P., Charboneau, L., Bichsel, V. E., Simone, N. L., Chen, T., Gillespie, J. W., Emmert-Buck, M. R., Roth, M. J., Petricoin, E. F., and Liott, L. A., (2001) Re- verse phase protein microarrays which capture disease progression show activation of prosurvival pathways at the cancer invasion front, Oncogene, 20, 1981−1989. [4] Lee, J. K., Bussey, K. J., Gwadry, F. G., Reinhold, W., Riddick, S. L. Pelletier, S. Nishizuka, G. Szakacs, J. An- nereau, G., Shankavaram, U., Lababidi, S., Smith, L. H., Gottesman, M. M., and Weinstein, J. N., (2003) Com- paring cDNA and oligonucleotide array data: Concor- dance of gene expression across platforms for the NCI- 60 cancer cells, Genome, Biol., 4, R82. [5] Ross, D. T., Scherf, U., Eisen, M. B., Perou, C. M., Rees, C., Spellman, P., Iyer, V., Jeffrey, S. S., Van de Rijn, M., Waltham, M., Pergamenschikov, A., Lee, J. C. F., Lash- kari, D., Shalon, D., Myers, T. G., Weinstein, J. N., Bot- stein, D., and Brown, P. O., (2000) Systematic variation in gene expression patterns in human cancer cell lines. Nat. Genet., 24, 227−235. [6] Shankavaram, U. T., Reinhold, W. C., Nishizuka, S., Major, S., Morita, D., Ch Scherf, U., Kahn, A., Dolginow, D., Cossman, J., Kald- jian, E. P., Scudiero, D. A., Petricoin, E., Liotta, L., Lee, J. K., and Weinstein, J. N., (2007) Transcript and protein expression profiles of the NCI-60 cancer cell panel: an integromic microarray study, Mol. Cancer Ther., 6, 820− 832. [7] Ma Y., Ding Z., Qian Y., Shi X., Castranova V., Harner, E. J., an G., Andrews, D. T., Scudiero, D. A., Eisen, M. B., Saus- ville, E. A., Pommier, Y., Botstein, D., Brown, P. O., and Weinstein, J. N., (2000) A gene expression database for the molecular pharmacology of cancer, Nat. Genet., 24, 236−244. [9] Ma, Y., Ding, Z., Qian, Y., Wan, Y., Tosun, K., Shi, X., Castranova integrative genomic and proteomic approach to chemo- sensitivity prediction, International Journal of Oncology, 34, 107−115. [10] Bussey, K. J., Chin, K., Lababidi, S., Reimers, M., Rein- hold, W. C., K Fridlyand, J., Jain, A., Collins, C., Nishizuka, S., Tonon, G., Roschke, A., Gehlhaus, K., Kirsch, I., Scudi ero, D. A., Gray, J. W., and Weinstein, J. N., (2006) Integrating data on DNA copy number with gene expression levels and drug sensitivities in the NCI-60 cell line panel, Mol. Cancer Ther., 5, 853−867. [11] Saeys, Y., Inza, I., and Larranaga, P., (2007) A review of feature selection technique matics, 23: 2507−2517. [12] Lewontin, R. C., (1964) The interaction of selection and linkage, I. General con Genetics, 49, 49−67. [13] Nishizuka, S., Charboneau, L., Young, L., Major, S., Reinhold, W. C., Waltham, M., K K. J., Lee, J. K., Espina, V., Munson, P. J., Petricoin, E., Liotta, L. A., and Weinstein, J. N., (2003) Proteomic pro- filing of the NCI-60 cancer cell lines using new high- density reverse-phase lysate microarrays, Proc. Natl. Acad. Sci., USA, 100, 14229−14234. [14] Hedrick, P. W., (1987) Gametic disequilibrium measures: proceed with caution, Genetics, 11 7, 33 [15] Leardic R., Boggia, R., and Terrile, M., (2005) Genetic algorithms as a strategy for feature selection, J Chemometrics, 6, 267−281. [16] Zhu, Z., Ong, Y., and Dash, M., (2007) Markov blan- ket-embedded genetic algori tern Recognition, 40, 3236−3248. SciRes Copyright © 2009 JBiSE
|