Paper Menu >>
Journal Menu >>
 Psychology 2011. Vol.2, No.8, 797-803 Copyright © 2011 SciRes. DOI:10.4236/psych.2011.28122 797 The Development of the Greek Personality Assessment Inventory Dimitrios Georgiou Lyrakos Maastricht University, Elpis Care, Greece. Email: info@lyrakos.gr Received August 17th, 2011; revised September 26th, 2011; accepted October 25th, 2011. Presented in the current report are the reliability analysis of the Greek Personality Assessment Inventory (PAI), the differences between the means and the standard deviation (SD) of the Greek and the US sample and the creation of the maximum non-clinical T Scores for each of the scale and subscale produced by the Greek stan- dardization sample. The PAI is considered, in the US and in many European countries, one of the most reliable multidimensional psychometric inventories. The PAI consists of 344 questions that are separated in non-over- lapping scales of clinical, treatment focus, personality and validity context. The present, mixed design study had 1870 participants, males and females between the ages of 20 and 55.The participants were 1120 non-clinical (standardization sample), 450 psychiatric inpatients and 300 psychiatric outpatients, who were gathered from 4 major regions of Greece. Keywords: Personality Assessment Inventory, Psychometrics, Greek Personality Tests, Clinical Psychology, Psychopathology, C l in i ca l As s e ssment Introduction In the field of measures of personality there are a wide vari- ety of instruments that can help to provide information that suggest either a diagnosis or diagnostic possibility. Even though these tests are not specifically designed to conclude an exact diagnosis, they nonetheless help to assist in the differen- tial diagnosis with many complicated cases. These batteries include multi-scale instruments that list the symptoms and the other features of psychiatric disorders by asking the respon- dents to list how and in what capacity they are bothered by their symptoms. Respondents may be required to answer True or False as to whether particular statements apply to them. Re- search on these scales has indicated a high score on the indi- vidual level, or some patterns and profiles of multiple scores, to be associated with certain disorders or diagnostic groups. When presented, these scores are indicative of the presence of an as- sociated type of pathology that needs further investigation. Hence the information provided by these testing forms is the starting point for the beginning of the diagnostic process. It also serves as supplemental information that helps to support an already suspected and present problem, information about pos- sible treatment obstacles, or treatment focus areas and personal- ity characteristics (Weiner et al., 2003). One of the best known and most used among these measures is The Personality Assessment Inventory, (PAI) (Morey, 1991) which is a self-administered test for personality, psychopa- thology and treatment consideration factors. The test is de- signed to collect information on critical client variables in a number of behavioral health care situations. The test has been conceived to provide a measure of construct that prove to be central in the planning, implementation, and evaluation of treatment. Even though this instrument has been introduced very recently it has already been the source of considerable attention among researchers and clinicians. Additionally the PAI has been described as a ‘substantial improvement from a psychometric perspective over the existing new personality tests’ (Helmes et al., 1993). The PAI has been developed along the lines of a construct validation framework that emphasizes a rational and quantitative method of scale development which lays a strong emphasis on a theoretically informed approach towards developing items. In addition to this it also emphasizes an assessment of the items’ stability and correlates. The PAI has been designed for use with individuals between the ages of 18 to 89 years of age and consists of 344 items constituting on four sets of nonoverlapping scales. There are 4 validity scales, 11 clinical scales covering major categories of pathologies that correspond to DSM nosology (neurotic spectrum—SOM, ANX, ARD, DEP; psychotic spectrum—MAN, PAR, SCZ; behavior disorder or impulse control problems—BOR, ANT, ALC, DRG). There are 5 treatment scales measuring constructs that are relevant to treatment, and 2 interpersonal scales (Strauss et al. 2006), on Table 1 there are presented the scales and sub- scales and their a cronyms. When Morey in 1991 was developing the PAI he reviewed each historical and recent literature on the targeted clinical syndromes in order to ensure that the PAI item assessed the core components of each disorder. For this reason the PAI has documented reliability validity in the assessment of personality and psychopathology in college, normative, and clinical sample. The PAI has also been examined recently in other specific populations such as alcohol dependent individuals, people with deviant and criminal behavior, as well as individuals suffering from eating disorders (Boccaccini et al. 2010, Sinclair et al. 2010, Thompson et al. 2010, Walters et al. 2010). The studies done with these groups indicate a success of PAI diagnosing these populations. There are certain aspects of PAI that indicate that it may be especially well suited for use with patients suf- fering from chronic pain as well (Karlin et al., 2005). A major practical advantage of PAI is its low text complexity of a fourth grade level of education. It is also much shorter than other per- sonality inventories such as the MMPI-2 which has 567 items compared to the significant less questions on the PAI (Weiner et al., 2003, Lanyon et al. 1997). Additionally the PAI also contains a greater coverage of certain phenomena related to psychopathology and personality, including acting out, sub- stance abuse and drugs treatment acceptance, interpersonal factors, and the more severe personality dysfunction such as 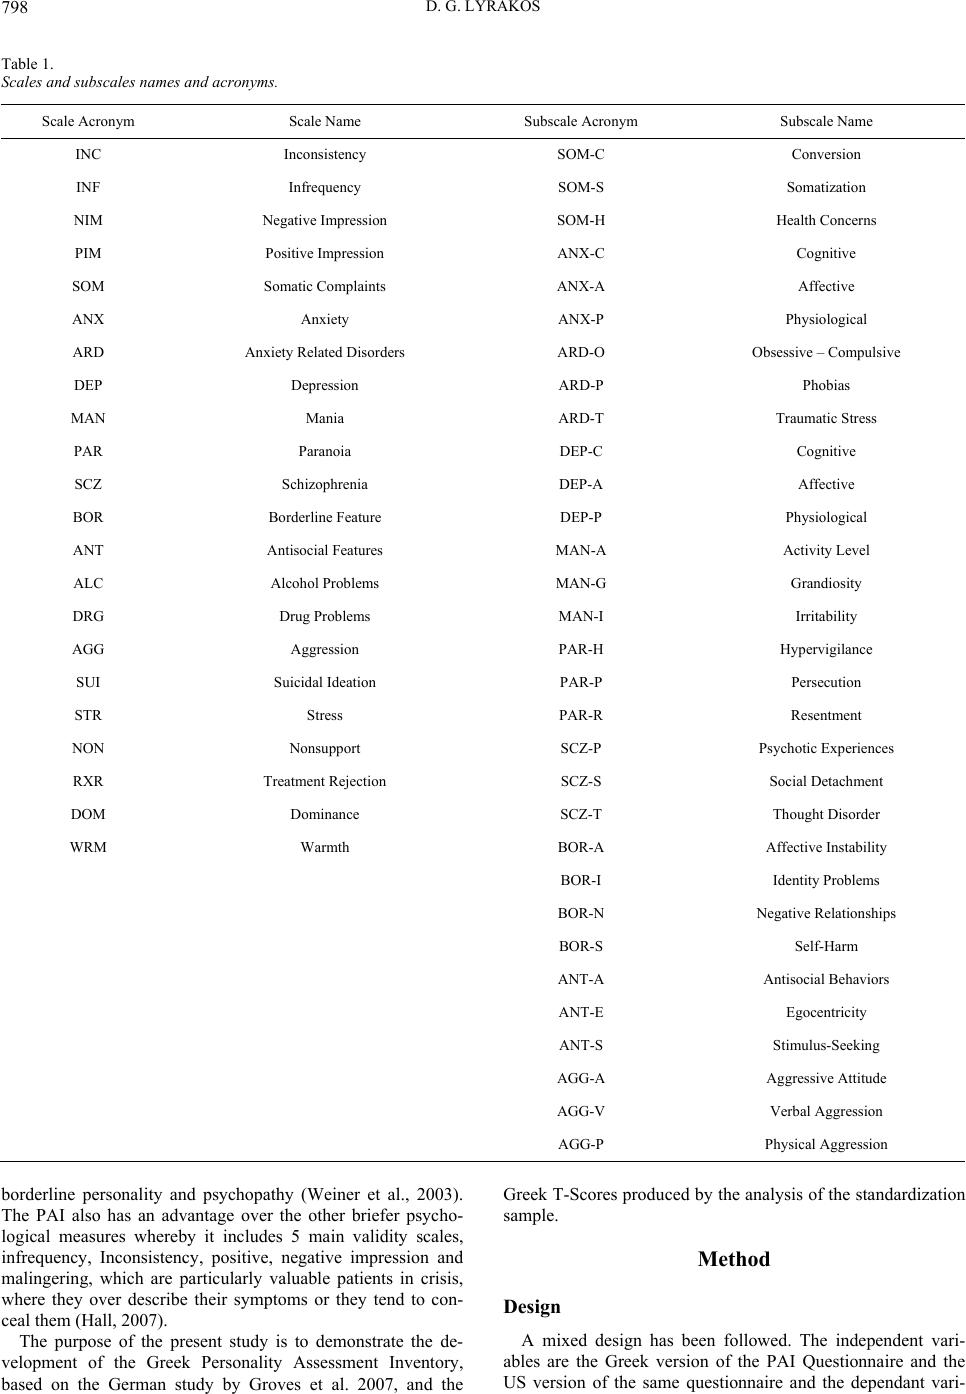 D. G. LYRAKOS 798 Table 1. Scales and subscales names a nd ac ronyms. Scale Ac ronym Scale Name Subscale Acronym Subscale Name INC Inconsistency SOM-C Conversion INF Infrequency SOM-S Somatization NIM Negative Impression SOM-H Health Concerns PIM Positive Impression ANX-C Cognitive SOM Somatic Complaints ANX-A Affective ANX Anxiety ANX-P Physiological ARD Anxiety Related Disorders ARD-O Obsessive – C ompulsive DEP Depression ARD-P Phobias MAN Mania ARD-T Traumatic Stress PAR Paranoia DEP-C Cognitive SCZ Schizophrenia DEP-A Affective BOR Borderline Feature DEP-P Physiological ANT Antisocial Features MAN-A Activity Level ALC Alcohol Problems MAN-G Grandiosity DRG Drug Problems MAN-I Irritability AGG Aggression PAR-H Hypervigilance SUI Suicidal Ideation PAR-P Persecution STR Stress PAR-R Resentment NON Nonsupport SCZ-P Psychotic Experiences RXR Treatment Rejection SCZ-S Social Detachment DOM Dominance SCZ-T Thought Disorder WRM Warmth BOR-A Affective Instability BOR-I Identity Problems BOR-N Negative Relationships BOR-S Self-Harm ANT-A Antisocial Behaviors ANT-E Egocentricity ANT-S Stimulus-Seeking AGG-A Aggressive Attitude AGG-V Verbal Aggression AGG-P Physical Aggression borderline personality and psychopathy (Weiner et al., 2003). The PAI also has an advantage over the other briefer psycho- logical measures whereby it includes 5 main validity scales, infrequency, Inconsistency, positive, negative impression and malingering, which are particularly valuable patients in crisis, where they over describe their symptoms or they tend to con- ceal them (Hall, 2007). The purpose of the present study is to demonstrate the de- velopment of the Greek Personality Assessment Inventory, based on the German study by Groves et al. 2007, and the Greek T-Scores produced by the analysis of the standardization sample. Method Design A mixed design has been followed. The independent vari- ables are the Greek version of the PAI Questionnaire and the US version of the same questionnaire and the dependant vari-  D. G. LYRAKOS 799 ables are the data from the standardization and clinical US sample obtained by Morey in 1991 during the development of the PAI and the data from the Standardization and clinical Greek sample, obtained for the present study. Participants The 1870 participants were both male (48.9%) and female (51.1%). The nonclinical sample consisted of 1.120 participants (59.8%) and were selected by a marketing research company from the major Greek cities. There were also 450 inpatients (24%) and 300 outpatients (16.2%), who were selected by psy- chiatric institutions and private practices from ma same cities that the non clinical sample was selected. The participants were adults, between the ages of 18 and 75; possible organic symp- toms such as dementia and mental retardation (IQ < 80) ex- cluded the participant from the study. The possible exclusion of any participant occurred by the screening questions before the completion of the questionnaire. There were 4 major Greek regions, selected, from where the all participants were obtained (Table 2). On the Greek regions the islands were not included because there were significant procedural problems. Nonclinical Participants (Standardization Sample) The nonclinical, standardization, participants were obtained by a marketing research company, through door to door re- quests, in order to obtain a sufficient sample in terms of geo- graphical and demographical characteristics, similar method was used in the German translation by Groves et al. 2007. The possible participants were requested if they were willing to participate in the study. If they wished to do so, they signed the consent form. On the form there was an option for the partici- pants, if they wished, to be informed about the results of the questionnaire. Clinical Part ic ipants For the inpatients participating in the study initial permission was requested by the scientific directors of the facilities. The clinical participants were initially screened, by their therapists, in terms of intelligence and organic disorders. Fur- thermore the participants should have an initial or final diagno- sis of any Axis I or II mental disorder by a clinical service. The participant’s therapists, for inpatients and outpatients, were requested to brief them about the study and then to ask them if Table 2. Region’s population and participant’s percent. Name of the Ci t y Actual Populat i on Sample Percent Thessaloniki 1,057,825 24.7 Bolos-Larisa 82,439 + 279,305 = 361,74 4 8.46 Athens 2,664,776 62.3 Patra-Tripoli 163,446 + 28,9 76 = 192,442 4.5 Total 4,276,787 100 Based on Population Report of 2004. they were willing to participate. Before the completion of the questionnaire the participants were asked to sign a consent form. Materials For the present study there were no other tests used apart from the Greek version of the PAI. There was though a struc- tured interview for the standardization sample in order to de- termine a number of factors, such as whether they are or were on any psychiatric medications, whether they ever visited a psychologist or psychiatrists and way, whether they have any alcohol or drug abuse problems. On the interview form there were also a number of clarification questions if the participant answered affirmatively to any of the above-mentioned ques- tions. Procedure Before the Greek version of the PAI could be distributed, a translation and back translation of the English version should be approved by Les Morey, the writer of the original question- naire. The translation was conducted by two different Greek, English teachers and then both translations were compared by two clinical psychologists. In order to evaluate the cross cul- tural validity of the questions a cultural psychologist had evalu- ated the questions. After the formulation of the Greek version of the questionnaire two different English teachers were re- quested to translate the Greek version of the questionnaire in English. After the approval of the back translation the distribu- tion commenced. After obtaining approval by the scientific directors of the mental health services, we have provided to the facilities and therapists, questionnaires and the participant’s screening parameters. The same materials and the interview form were also given to the marketing company for obtaining the standardization sample. Analysis The statistical analysis of the present study, was conducted with SPSS 17, and it is separated in three differe nt parts: 1) Reliability for all three groups of participants, nonclinical, inpatients and outpatients; 2) Comparison of the means and the SD between the Stan- dardization US and Greek sample and, if the means and SD differ 3) The calculation of the T Scores based on the same equa- tion used in the original US PAI, but with the means and stan- dard deviation produced by the Greek population. Results From Tables 3 and 4, it can be seen that all the scales and subscales have produced high Cronbach’s Alpha in all three types of participants, healthy, inpatients, and outpatients. From Table 3 it can be seen that the reliability analysis for all the sub- scales in all three samples, health participants, inpatients, outpa- tients, has produced high Cronbach’s Alpha. For the healthy sample the lower alpha produced was for the ARD-O = 0.653, but even if any of the items were deleted there would be no sig- nificant change. For the inpatients the lower Cronbach’s Alpha was produced for MAN-A = 0.683, but again there would be no significant change if any of the items were deleted. Finally for the outpatients sample, the lowest Cronbach’s Alpha was pro- duced for SOM-C = 0.721, which would not have any signifi- cant change if any of the items were deleted. From Table 4, it  D. G. LYRAKOS 800 Table 3. Subscales reliability analysis. Normal Sample Clinical Sample (In Patients) Clinical Sam ple (Out Patients) US Standa rdization Sample Subscale N Cronbach’s Alpha N N Cronbach’s Alpha Cronbach’s Alpha N Cronbach’s Alpha SOM-C 1120 0.791* 450 300 0.721* 0.863* 1000 0.74* SOM-S 1120 0.742* 450 300 0.953* 0.945* 1000 0.68* SOM-H 1120 0.845* 450 300 0.833* 0.962* 1000 0.81* ANX-C 1120 0.821* 450 300 0.842* 0.921* 1000 0.81* ANX-A 1120 0.747* 450 300 0.963* 0.898* 1000 0.73* ANX-P 1120 0.721* 450 300 0.778* 0.970* 1000 0.74* ARD-O 1120 0.653* 450 300 0.796* 0.958* 1000 0.56* ARD-P 1120 0.733* 450 300 0.842* 0.965* 1000 0.58* ARD-T 1120 0.842* 450 300 0.963* 0.863* 1000 0.81* DEP-C 1120 0.863* 450 300 0.791* 0.945* 1000 0.74* DEP-A 1120 0.778* 450 300 0.822* 0.962* 1000 0.80* DEP-P 1120 0.796* 450 300 0.845* 0.921* 1000 0.71* MAN-A 1120 0.698* 450 300 0.821* 0.683* 1000 0.51* MAN-G 1120 0.701* 450 300 0.897* 0.687* 1000 0.73* MAN-I 1120 0.712* 450 300 0.761* 0.785* 1000 0.78* PAR-H 1120 0.863* 450 300 0.853* 0.791* 1000 0.64* PAR-P 1120 0.776* 450 300 0.733* 0.822* 1000 0.76* PAR-R 1120 0.763* 450 300 0.842* 0.845* 1000 0.66* SCZ-P 1120 0.945* 450 300 0.963* 0.821* 1000 0.56* SCZ-S 1120 0.862* 450 300 0.778* 0.897* 1000 0.79* SCZ-T 1120 0.821* 450 300 0.796* 0.721* 1000 0.73* BOR-A 1120 0.898* 450 300 0.863* 0.953* 1000 0.71* BOR-I 1120 0.770* 450 300 0.836* 0.833* 1000 0.70* BOR-N 1120 0.858* 450 300 0.863* 0.842* 1000 0.63* BOR-S 1120 0.865* 450 300 0.945* 0.963* 1000 0.62* ANT-A 1120 0.921* 450 300 0.962* 0.778* 1000 0.73* ANT-E 1120 0.692* 450 300 0.921* 0.796* 1000 0.63* ANT-S 1120 0.745* 450 300 0.898* 0.842* 1000 0.69* AGG-A 1120 0.875* 450 300 0.958* 0.963* 1000 0.74* AGG-V 1120 0.854* 450 300 0.965* 0.778* 1000 0.67* AGG-P 1120 0.975* 450 300 0.921* 0.796* 1000 0.71* Note: * No significant change of the Cronbach’s Alpha if any of the items of the subscale are deleted. can be seen that all the scales have produced high Cronbach’s Alpha in all three types of participants, healthy, inpatients, and outpatients. The comparison of the alpha coefficients between the US (Morey 1991) and the Greek standardization sample do not present significant differences with the exemption of the ARD-O, ARD-P, MAN-A, SCZ-P and BOR-S where the reli- ability was significant higher in the Greek than in the US sam- ple. For the second part of the analysis the means and standard deviations have been compared between the standardization US sample (Morey 1991) and the Greek standardization sample produced in the present study, for the main scales and the sub- scales. The comparison of the US and GR standardization Means (Table 5) showed that although the majority of the scales had no significant differences, there are scales with high mean dif- ferences between the US and Greek standardization sample presented below. The results presented are from the equation US Mean-GR Mean. SOM = 1.95, MAN = –2.1, PAR = –2.8, BOR = –5.15 and DOM = 1.49. The comparison of the US and GR standardization SD (Table 5), produced high differences, with the exception of the PIM and NON scale. On Table 5 there are presented the Mean and SD of the US Normative sample (Morey 1991) and the ob- tained Greek Sample for the scales. The comparison of the Mean and the SD of US and GR Standardization sample of the subscales, based on the same equation, produced the highest differences for the means on: ARD-T = –1.69, DEP-C = –1.23, MAN-G = –1.29, BOR-A = –1.36 and BOR-I = –1.2. In terms of the SD, all subscales had similar differences, which is also consistent with previous findings by Karaminas et al. (2007), when they validated the MMPI-II. As we have described, in the third phase of the analysis we have created T Scores based on the Greek standardization sam- ple according to the original study of the PAI. The reason for 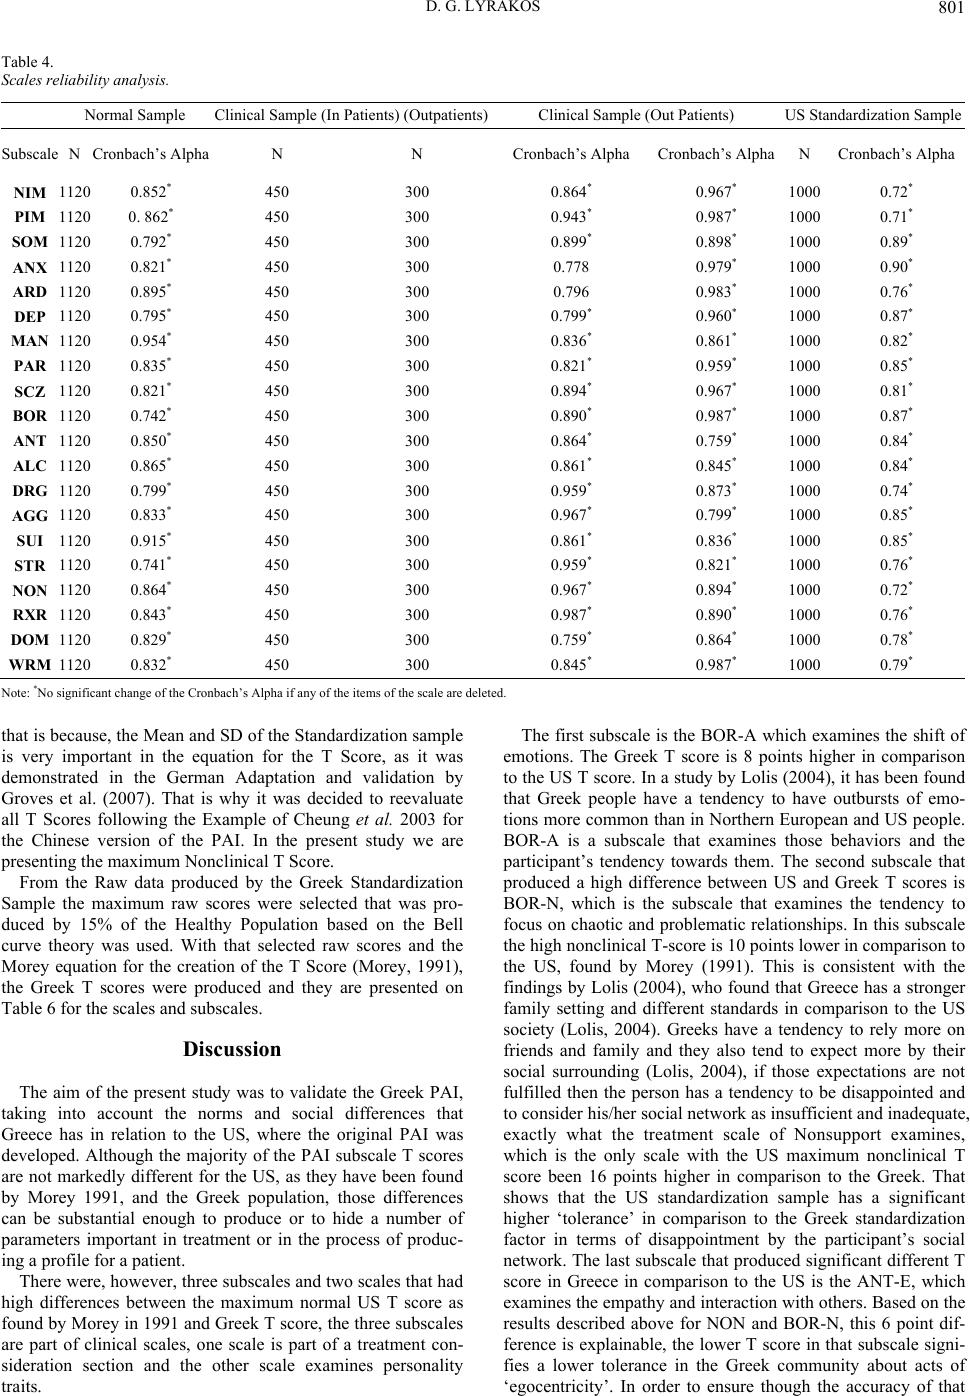 D. G. LYRAKOS 801 Table 4. Scales reliability analysis. Normal Sample Clinical Sample (In Patients) (Outpatients)Clinical Sample (Out Patients) US Standardization Sample Subscale N Cronbach’s Alpha N N Cronbach’s Alpha Cronbach’s Alpha N Cronbach’s Alpha NIM 1120 0.852* 450 300 0.864* 0.967* 1000 0.72* PIM 11200. 862* 450 300 0.943* 0.987* 1000 0.71* SOM 1120 0.792* 450 300 0.899* 0.898* 1000 0.89* ANX 1120 0.821* 450 300 0.778 0.979* 1000 0.90* ARD 1120 0.895* 450 300 0.796 0.983* 1000 0.76* DEP 1120 0.795* 450 300 0.799* 0.960* 1000 0.87* MAN 1120 0.954* 450 300 0.836* 0.861* 1000 0.82* PAR 1120 0.835* 450 300 0.821* 0.959* 1000 0.85* SCZ 1120 0.821* 450 300 0.894* 0.967* 1000 0.81* BOR 1120 0.742* 450 300 0.890* 0.987* 1000 0.87* ANT 1120 0.850* 450 300 0.864* 0.759* 1000 0.84* ALC 1120 0.865* 450 300 0.861* 0.845* 1000 0.84* DRG 1120 0.799* 450 300 0.959* 0.873* 1000 0.74* AGG 1120 0.833* 450 300 0.967* 0.799* 1000 0.85* SUI 1120 0.915* 450 300 0.861* 0.836* 1000 0.85* STR 1120 0.741* 450 300 0.959* 0.821* 1000 0.76* NON 1120 0.864* 450 300 0.967* 0.894* 1000 0.72* RXR 1120 0.843* 450 300 0.987* 0.890* 1000 0.76* DOM 1120 0.829* 450 300 0.759* 0.864* 1000 0.78* WRM 1120 0.832* 450 300 0.845* 0.987* 1000 0.79* Note: *No significant change of the Cronbach’s Alpha if any of the items of the scale are deleted. that is because, the Mean and SD of the Standardization sample is very important in the equation for the T Score, as it was demonstrated in the German Adaptation and validation by Groves et al. (2007). That is why it was decided to reevaluate all T Scores following the Example of Cheung et al. 2003 for the Chinese version of the PAI. In the present study we are presenting the maximum Nonclinical T Score. From the Raw data produced by the Greek Standardization Sample the maximum raw scores were selected that was pro- duced by 15% of the Healthy Population based on the Bell curve theory was used. With that selected raw scores and the Morey equation for the creation of the T Score (Morey, 1991), the Greek T scores were produced and they are presented on Table 6 for the scales and subscales. Discussion The aim of the present study was to validate the Greek PAI, taking into account the norms and social differences that Greece has in relation to the US, where the original PAI was developed. Although the majority of the PAI subscale T scores are not markedly different for the US, as they have been found by Morey 1991, and the Greek population, those differences can be substantial enough to produce or to hide a number of parameters important in treatment or in the process of produc- ing a profile for a patient. There were, however, three subscales and two scales that had high differences between the maximum normal US T score as found by Morey in 1991 and Greek T score, the three subscales are part of clinical scales, one scale is part of a treatment con- sideration section and the other scale examines personality traits. The first subscale is the BOR-A which examines the shift of emotions. The Greek T score is 8 points higher in comparison to the US T score. In a study by Lolis (2004), it has been found that Greek people have a tendency to have outbursts of emo- tions more common than in Northern European and US people. BOR-A is a subscale that examines those behaviors and the participant’s tendency towards them. The second subscale that produced a high difference between US and Greek T scores is BOR-N, which is the subscale that examines the tendency to focus on chaotic and problematic relationships. In this subscale the high nonclinical T-score is 10 points lower in comparison to the US, found by Morey (1991). This is consistent with the findings by Lolis (2004), who found that Greece has a stronger family setting and different standards in comparison to the US society (Lolis, 2004). Greeks have a tendency to rely more on friends and family and they also tend to expect more by their social surrounding (Lolis, 2004), if those expectations are not fulfilled then the person has a tendency to be disappointed and to consider his/her social network as insufficient and inadequate, exactly what the treatment scale of Nonsupport examines, which is the only scale with the US maximum nonclinical T score been 16 points higher in comparison to the Greek. That shows that the US standardization sample has a significant higher ‘tolerance’ in comparison to the Greek standardization factor in terms of disappointment by the participant’s social network. The last subscale that produced significant different T score in Greece in comparison to the US is the ANT-E, which examines the empathy and interaction with others. Based on the results described above for NON and BOR-N, this 6 point dif- ference is explainable, the lower T score in that subscale signi- fies a lower tolerance in the Greek community about acts of ‘egocentricity’. In order to ensure though the accuracy of that  D. G. LYRAKOS 802 Table 5. Means standard de v i ation US and Greek sample. Scale US Mean US SD GR Mean GR SD Scale US Mean US SD GR Mean GR SD ICN 5.39 3.35 5.5 3.45 SOM-C 2.5 3.37 2.34 2.99 INF 2.66 2.57 3.46 2.77 SOM-S 4.51 3.73 4.33 3.54 NIM 1.69 2.7 1.39 2.9 SOM-H 4.09 4.27 3.57 4.53 PIM 15.07 4.36 14.86 4.66 ANX-C 6.05 4.33 6.37 4.132 SOM 11.09 10.07 10.14 10.17 ANX-A 6.24 3.83 6.51 3.948 ANX 16.47 10.56 16.97 10.49 ANX-P 4.17 3.55 4.39 3.37 ARD 19.91 8.3 20.2 8.5 ARD-O 9.33 3.75 9.14 3.817 DEP 14.28 9.43 14.53 9.49 ARD-P 6.7 3.61 6.57 3.785 MAN 23.01 9.22 25.11 10.32 ARD-T 3.88 4.12 4.17 3.92 PAR 18.45 8.69 18.25 8.72 DEP-C 4.34 3.43 4.57 3.356 SCZ 13.99 7.79 14.29 7.89 DEP-A 4.04 3.66 4.34 3.585 BOR 18.03 10 18.18 9.89 DEP-P 5.89 4.16 5.58 3.742 ANT 13.16 9.11 13.75 9.17 MAN-A 6.69 3.2 7 3.662 ALC 4.83 5.62 4.57 5.58 MAN-G 8.39 4.37 9.68 4.99 DRG 4.09 4.99 4.21 5.01 MAN-I 7.92 4.37 8.61 5.19 AGG 14.81 8.42 15.86 8.5 PAR-H 7.6 4.27 7.93 3.88 SUI 3.28 4.86 3.07 4.81 PAR-P 3.64 3.41 3.21 3.315 STR 5.8 4.45 5.95 4.5 PAR-R 7.21 3.53 7.8 3.394 NON 4.9 3.36 5.18 3.32 SCZ-P 4.09 2.99 4.11 3.125 RXR 13.76 4.65 14 4.67 SCZ-S 5.59 3.94 5.26 3.716 DOM 20.6 5.59 19.98 5.62 SCZ-T 4.32 3.41 4.46 3.361 WRM 23.58 23.58 23.48 23.6 BOR-A 4.71 3.27 5.07 2.981 BOR-I 4.87 3.37 5.07 3.31 BOR-N 5.14 3.17 5.21 2.959 BOR-S 3.32 2.57 3.25 2.661 ANT-A 4.99 4.42 4.64 4.387 ANT-E 3.43 3.01 3.64 2.987 ANT-S 4.74 3.66 4.96 3.809 AGG-A 5.8 3.59 5.64 3.311 AGG-V 6.72 3.52 7.36 3.278 AGG-P 2.29 2.96 2.5 2.603 US Sample N = 1000; Greek Sample N = 1380. subscale, interviews were conducted with participants from the standardization sample and from the clinical sample diagnosed with Antisocial Personality disorder, which supported the clinical threshold of T score 89 for the Greek clinical sample. The last scale with significant difference between US and Greek maximum nonclinical T score is the personality scale of Warmth. That particular scale is a two-way evaluative scale (high and low), which means that a person with high levels on that particular scale tends to be characterized by exceptionally strong need to be accepted by others (Morey, 1991), whilst people with low scores on Warmth tend to be uneasy in social situations. People, who score low in that particular scale, pre- sent uneasiness in social interaction. Again, associated with all the above scales and subscales with differences between the US and Greek T scores, the lower nonclinical T score is 10 points lower in the Greek standardization sample in comparison to the US sample. The PAI is considered one of the most valid and accurate in- strument in the field of clinical psychology and diagnostic psy- chometrics (Maruish, 1999). The purpose of the present study was to create the Greek T scores, following the same procedure that Morey used in 1991 in the development of the PAI. It has been decided to follow that particular procedure not because the results produced by the instrument had weaknesses in the Greek  D. G. LYRAKOS 803 Table 6. Maximum nonclinical T-scores (scales subscales). Scale Maximum Normal T Scores Subscale Maximum Normal T Scores ICN 65 SOM-C 82 INF 76 SOM-S 70 NIM 74 SOM-H 94 PIM 69 ANX-C 71 SOM 85 ANX-A 70 ANX 67 ANX-P 72 ARD 70 ARD-O 65 DEP 68 ARD-P 67 MAN 73 ARD-T 79 PAR 68 DEP-C 70 SCZ 71 DEP-A 75 BOR 77 DEP-P 71 ANT 74 MAN-A 77 ALC 69 MAN-G 75 DRG 70 MAN-I 67 AGG 73 PAR-H 65 SUI 77 PAR-P 75 STR 71 PAR-R 66 NON 72 SCZ-P 79 RXR 69 SCZ-S 75 DOM 67 SCZ-T 72 WRM 71 BOR-A 73 BOR-I 71 BOR-N 70 BOR-S 75 ANT-A 77 ANT-E 89 ANT-S 70 AGG-A 67 AGG-V 74 AGG-P 70 sample, but because we wanted to fully exploit the PAI’s strengths for the Greek population, as it has been done for the Chinese version of the PAI (Cheung et al., 2003).Again, as it had been done by the US PAI team, we are currently in the process of comparing the US and Greek T scores, through in- terviews, clinical evaluations and a number of different clinical tests. The results from those analyses will be presented on fu- ture reports. Apart from the finding presented in the present article there is an ongoing process to investigate possible correlations be- tween the scales and subscales of the Greek PAI and other per- sonality inventories, such as MMPI-II and to create a more detailed analysis of the validity of the inventory in Greek. References Archer, R. P., Smith, S. R. (2008) Personality Assessment. Florida: CRC Press. Boccaccini, M. T., Murrie, D. C., Hawes, S. W., Simpler, A., & John- son, J. (2010). Predicting recidivism with the personality assessment inventory in a sample of sex offenders screened for civil commitment as sexually violent predators. Psychological Assessment, 22, 142-148. doi:10.1037/a0017818 Cheung, F. M., Kwong, Y. Y., Zhang, J. (2003). Clinical validation of the chinese personality assessment inventory. Psychological Assess- ment, 25, 89-100. doi:10.1037/1040-3590.15.1.89 Groves, J. A., & Engel, R. R. (2007). The German adaptation and stan- dardization of the personality assessment inventory (PAI). Journal of Personality Assessment, 88, 49-56. Hall, W. D., & Mattick, R. P. (2007) Clinical update: Codeine mainte- nance is opioid dependence. The Lancet, 370, 550-552. doi:10.1016/S0140-6736(07)61273-2 Helmes, E., & Reddon, J. R. (1993). A perspective on developments in assessing psychopathology: A critical review of the MMPI and MMPI-2. Psychological Bulletin, 113, 453-471. doi:10.1037/0033-2909.113.3.453 Karaminas, N., Georgakas, P., Kantas A., Tsaousis, I., Marini, K., Karakosta, A., Stathopoulos, K. (2007) Cross cultural robustness of MMPI-2: The Greek standardization. International Psychological Bulleting, 11, 24-26. Karlin, B. E., Creech, S. K., Grimes, J. S., Clark, T. S., Meagher, M. W., & Morey, L. C. (2005) The personality assessment inventory with chronic pain patients: psychometric properties and clinical utility. Journal of Clinical Psychology, 61, 1571-1585. doi:10.1002/jclp.20209 Lanyon, R. I., & Goodstein, L. D. (1997) Personality Assessment. New Jersey: John Wiley and Sons. Lolis, V. (2004) Social Differences between the Greek, the US and the British population. PhD Thesis, Athen: Pantion University, unpub- lished. Maruish, M. E. (1999) The Use of Psychological Testing for Treatment Planning and Outcomes Assessment. New Jersey: Lawrence Erlbaum Associates. Morey, L. C. (1991). The personality assessment inventory professional manual. Odessa, FL: Psyc h o l o g i c a l A s s e s sment Resources. Sinclair, S. J., Antonius, D., Shiva, A., Siefert, C. J., Kehl-Fie, K., Lama, S., Blais, M. A. (2010). The psychometric properties of the Personality Assessment Inventory-Short Form (PAI-SF) in inpatient forensic and civil samples. Journal of Psychopathology and Behav- ioral Assessment, 32, 406-415. doi:10.1007/s10862-009-9165-x Strauss, E., Sherman, E. M. S., Spreen, O. (2006) A compendium of neuropsychological tests: Administration, norms, and commentary. Oxford: Oxford University Press. Thompson, A. W., Hantke, N., Phatak, V., & Chaytor, N. (2010). The Personality Assessment Inventory as a tool for diagnosing psycho- genic nonepileptic s e izures. Epilepsia, 51, 161-164. doi:10.1111/j.1528-1167.2009.02151.x Wagner, M. T., Wymer, J. H., Topping, K. B., Pritchard, P. B. (2005) use of the personality assessment inventory as an efficacious and cost-effective diagnostic tool for nonepileptic seizures. Epilepsy and Behavior, 7, 301-304. doi:10.1016/j.yebeh.2005.05.017 Walters, G. D., Diamond, P. M., & Magaletta, P. R. (2010). What is the latent structure of alcohol use disorders? A taxometric analysis of the personality assessment inventory alcohol problems scale in male and female prison inmates. Psychology of Addictive Behaviors, 24, 26-37. doi:10.1037/a0016587 Weiner, I. B., Freedheim, D. K., Goldstein, A. M. (2003) handbook of psychology: forensic psychology. New Jersey: John Wi le y and Sons. Weiner, I. B., et al. (2003) Handbook of Psychology Assessment Psy- chology. New Jersey: John Wiley and Sons. Greek National Statistical Department (200 4) Greek Population Report. |