S. P. McGuirk et al. / J. Biomedical Science and Engineering 2 (2009) 491-498 497
vitro findings are consistent with our previously unre-
ported clinical findings.
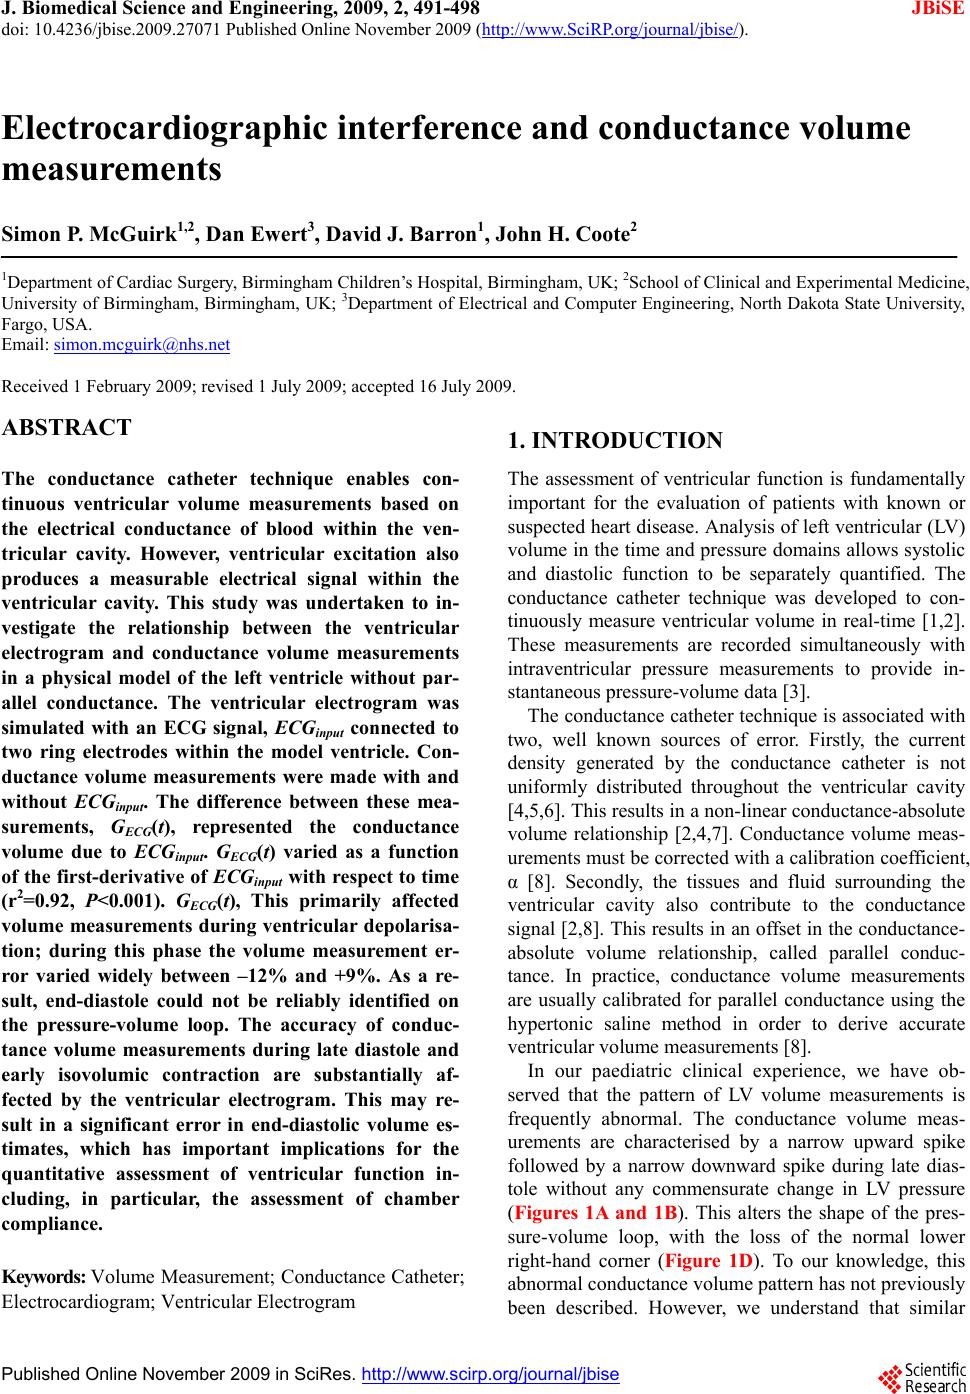
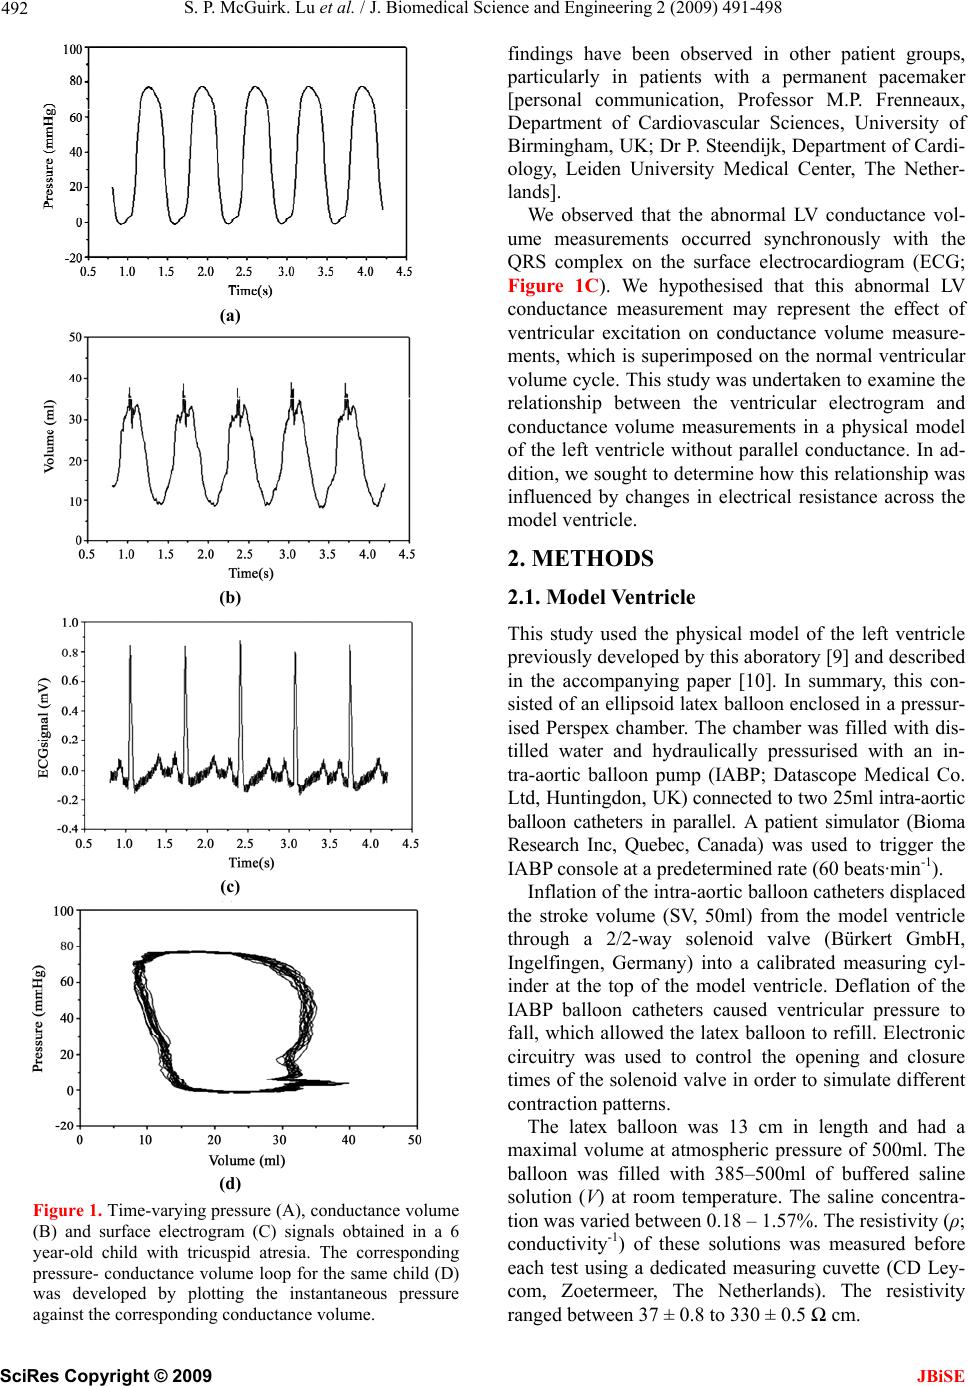
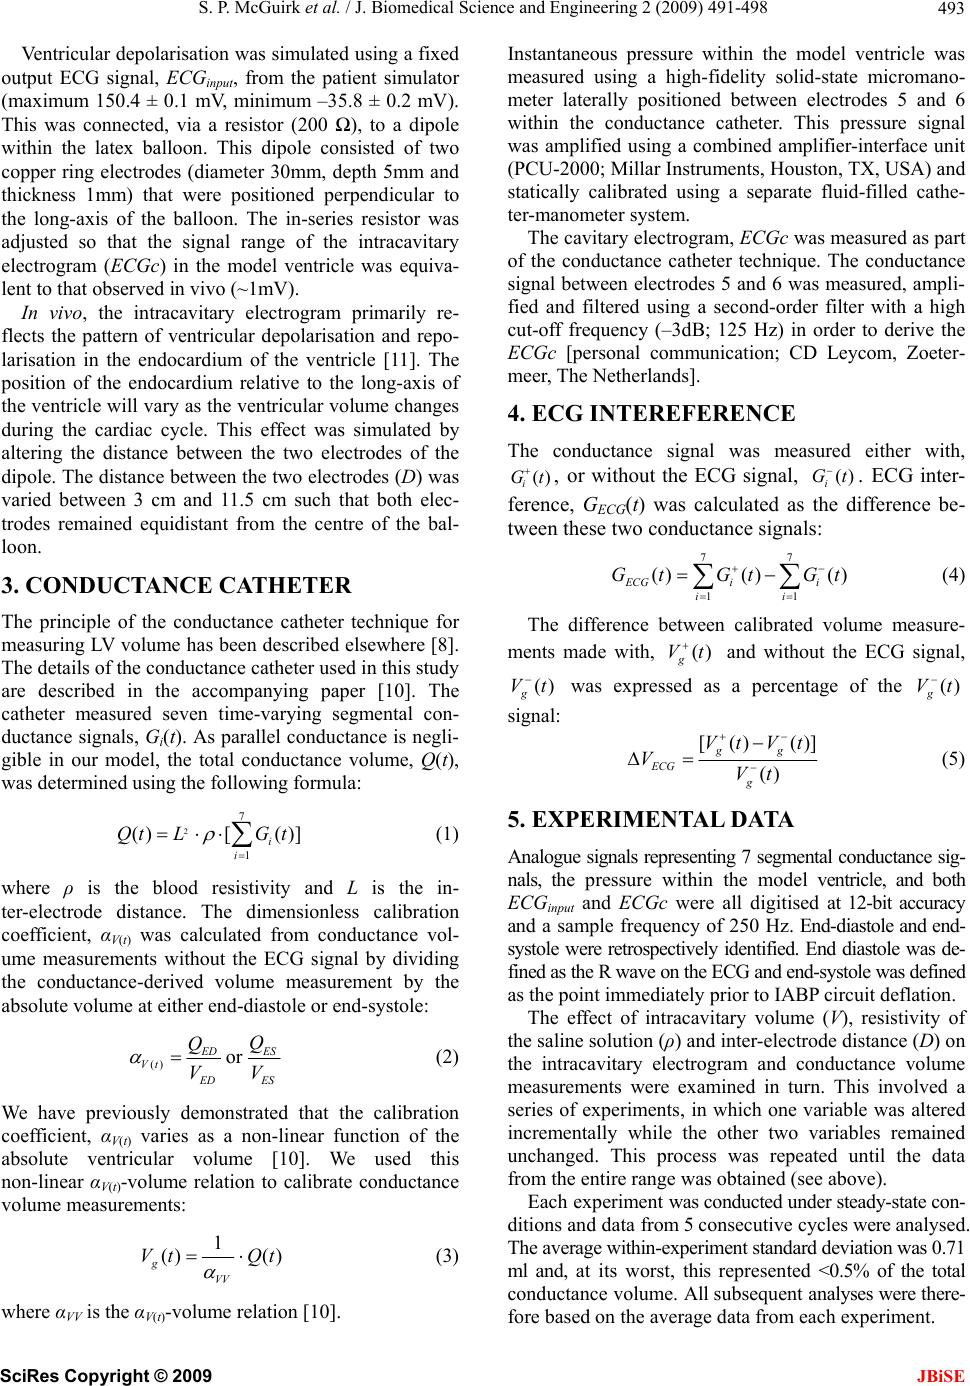
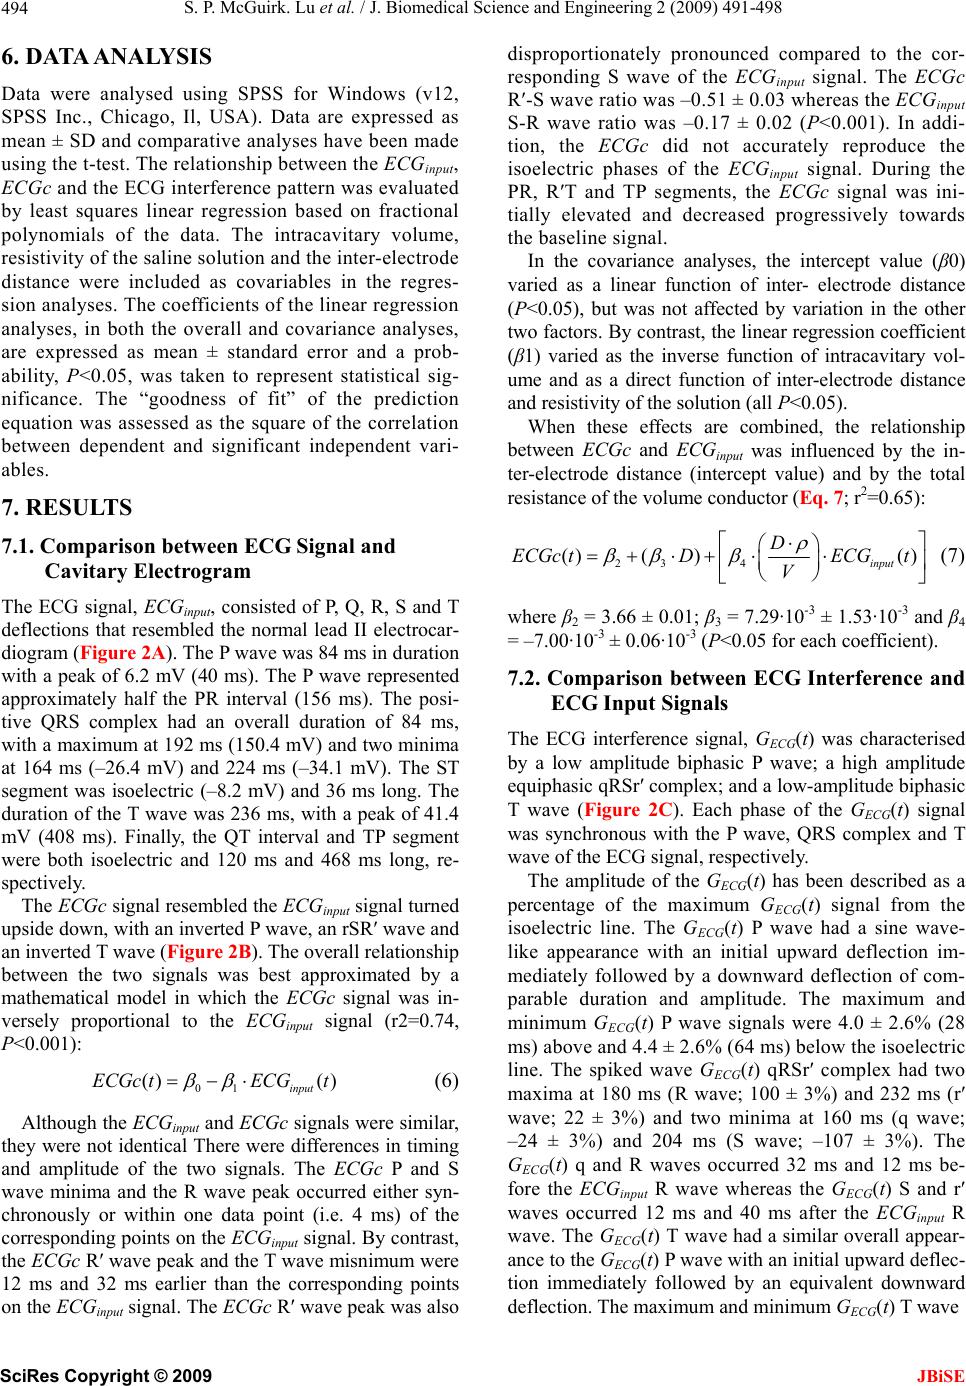
The haemodynamic events during the cardiac cycle
are best displayed by plotting the instantaneous left ven-
tricular pressure versus volume [15]. Under steady-state
conditions, this pressure-volume loop has a quadrilateral
shape where each side represents one of four functional
distinct phases: filling, isovolumic contraction, ejection
and isovolumic relaxation. End-diastole and end-systole
are identifiable as the single pressure-volume points in
the lower right-hand and upper left-hand corners, re-
spectively. However, ventricular depolarisation
overlaps
the rapid rise in intraventricular pressure that marks the
onset of ventricular systole. The conductance signal ar-
tefact identified in this study meant that end-diastole
could no longer be reliably identified on the pressure-
conductance volume loop alone.
End-diastole may alternatively be defined using the
surface electrocardiogram as the onset of the QRS com-
plex [16]; the R wave peak [17]; or up to 40 ms after the
R wave peak [18]. End-diastole may also be defined as
the R wave peak on the ventricular electrogram. In our
experience, this time-point occurs synchronously with
the onset of ventricular systole [19]. However, conduc-
tance volume measurements at all of these time-points
will be variably affected by the conductance signal arte-
fact such that end-diastolic volume cannot be accurately
measured using the conductance catheter technique. This
in turn means that indices of ventricular function that are
based on EDV, such as cardiac output, ejection fraction
together with the quantitative assessment of ventricular
compliance, will be adversely affected as a consequence
of the conductance signal artefact.
9. STUDY LIMITATIONS
The limitations of the physical model have been de-
scribed previously [10]. Electrical activity within the
ventricle was represented using a fixed dipole within the
ventricular cavity. This comparatively simple model en-
abled characterisation and quantification of a new con-
ductance measurement error. However, the model did
not include any representation of the ventricular wall and
the effect of parallel conductance was not examined. A
moving dipole or multiple dipoles within an artificial
ventricular wall would also have provided a more
physiological model.
10. CONCLUSIONS
This study has demonstrated that the accuracy of these
conductance volume measurements is adversely affected
by other electrical signals, such as the ventricular elec-
trogram. The ventricular electrogram produced a clini-
cally important volume measurement that meant end-
diastole could neither be precisely identified nor accu-
rately measured. These original findings have important
implications for the quantitative assessment of ventricu-
lar function and, in particular the assessment of chamber
compliance.
1 1. ACKNOWLEDGEMENTS
Simon McGuirk was supported by a British Heart Foundation Junior
Research Fellowship (FS/03/102).
REFERENCES
[1] Baan, J., Aouw Jong, T. T., Kerkhof, P. L., Moene, R. J.,
van Dijk, A. D., van der Velde, E. T., and Koops, J. (1981)
Continuous stroke volume and cardiac output from intra-
ventricular dimensions obtained with an impedance ca-
theter, Cardiovascular Research, 15, 328–334.
[2] Mur, G. and Baan, J., (1984) Computation of the input
impedances of a catheter for cardiac volumetry, IEEE
Transactions on Biomedical Engineering, 31, 448–453.
[3] Kass, D. A., (1992) Clinical evaluation of left heart func-
tion by conductance catheter technique, European Heart
Journal, 13(Suppl E), 57–64.
[4] Wu, C. C., Skalak, T. C., Schwenk, T. R., Mahler, C. M.,
Anne, A., Finnerty, P. W., Haber, H. L., Weikle II, R. M.
and Feldman, M. D., (1997) Accuracy of the conductance
catheter for measurement of ventricular volumes seen
clinically: Effects of electric field homogeneity and par-
allel conductance, IEEE Transactions on Biomedical En-
gineering, 44, 266–277.
[5] Salo, R. W., (1989) The theoretical basis of a compart-
mental model for the determination of volume by im-
pedance, Automedica, 11, 299–310.
[6] Wei, C. L., Valvano, J. W., Feldman, M. D., and Pearce, J.
A., (2005) Nonlinear conductance-volume relationship
for murine conductance catheter measurement system,
IEEE Transactions on Biomedical Engineering, 52, 654–
661.
[7] Salo, R. W., Wallner, T. G., and Pederson, B. D., (1986)
Measurement of ventricular volume by intracardiac im-
pedance: Theoretical and empirical approaches, IEEE
Transactions on Biomedical Engineering, 33, 189−195.
[8] Baan, J., van der Velde, E. T., de Bruin, H. G., Smeenk, G.
J., Koops, J., van Dijk, A. D., Temmerman, D., Senden, J.,
and Buis, B., (1984) Continuous measurement of left
ventricular volume in animals and humans by conduc-
tance catheter, Circulation, 70, 812–823.
[9] Al-Khalidi, A. H., Townend, J. N., Bonser, R. S., and
Coote, J. H., (1998) Validation of the conductance cathe-
ter method for measurement of ventricular volumes un-
der varying conditions relevant to cardiac surgery, Am-
erican Journal of Cardiology, 82, 1248–1252.
[10] McGuirk, S. P., Barron, D. J., Ewert, D., and Coote, J. H.,
(2009) Calibrating volume measurements made using the
dual-field conductance catheter, Journal of Biomedical
Science and Engineering, In Press.
[11] Durrer, D., Van Dam, R. T., Freud, G. E., Janse, M. J.,
Meijler, F. L., and Arzbaecher, R. C., (1970) Total excita-
tion of the isolated human heart, Circulation, 41, 899–
912.
[12] Taccardi, B., Arisi, G., Macchi, E., Baruffi, S., and Spag-
giari, S., (1987) A new intracavitary probe for detecting
the site of origin of ectopic ventricular beats during one
SciRes
Copyright © 2009 JBiSE