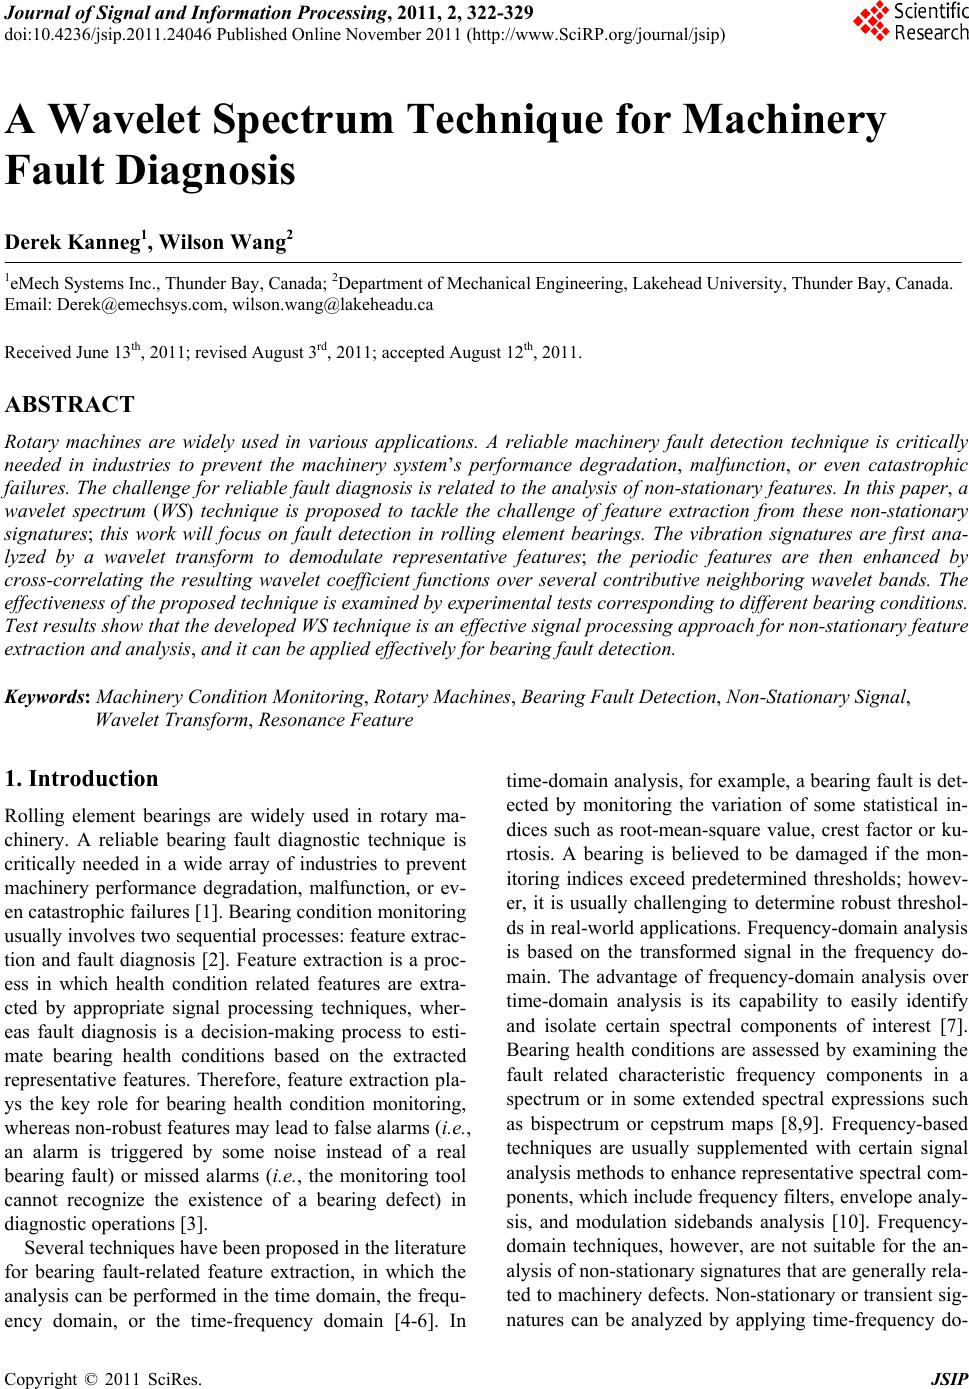
 Journal of Signal and Information Processing, 2011, 2, 322-329 doi:10.4236/jsip.2011.24046 Published Online November 2011 (http://www.SciRP.org/journal/jsip) Copyright © 2011 SciRes. JSIP 1 A Wavelet Spectrum Technique for Machinery Fault Diagnosis Derek Kanneg1, Wilson Wang2 1eMech Systems Inc., Thunder Bay, Canada; 2Department of Mechanical Engineering, Lakehead University, Thunder Bay, Canada. Email: Derek@emechsys.com, wilson.wang@lakeheadu.ca Received June 13th, 2011; revised August 3rd, 2011; accepted August 12th, 2011. ABSTRACT Rotary machines are widely used in various applications. A reliable machinery fault detection technique is critically needed in industries to prevent the machinery system’s performance degradation, malfunction, or even catastrophic failures. The cha llenge for reliable fault diagnosis is related to the ana lysis of non-stationary features. In this paper, a wavelet spectrum (WS) technique is proposed to tackle the challenge of feature extraction from these non-stationary signatures; this work will focus on fault detection in rolling element bearings. The vibration signatures are first ana- lyzed by a wavelet transform to demodulate representative features; the periodic features are then enhanced by cross-correlating the resulting wavelet coefficient functions over several contributive neighboring wavelet bands. The effectiveness of the proposed techn ique is examined by experimen tal tests correspond ing to differen t bearing cond itio ns. Test results show that the developed WS technique is an effective signal processing approach for non-stationary feature extraction and analysis, and it can be applied effectively for bearing fault detection. Keywords: Machinery Condition Monitoring, Rotary Machines, Bearing Fault Detection, Non-Stationary Signal, Wavelet Transform, Resonance Feature 1. Introduction Rolling element bearings are widely used in rotary ma- chinery. A reliable bearing fault diagnostic technique is critically needed in a wide array of industries to prevent machinery performance degradation, malfunction, or ev- en catastrophic failures [1]. Bearing condition monitoring usually involves two sequential processes: feature extrac- tion and fault diagnosis [2]. Feature extraction is a proc- ess in which health condition related features are extra- cted by appropriate signal processing techniques, wher- eas fault diagnosis is a decision-making process to esti- mate bearing health conditions based on the extracted representative features. Therefore, feature extraction pla- ys the key role for bearing health condition monitoring, whereas non-robust features may lead to false alarms (i.e., an alarm is triggered by some noise instead of a real bearing fault) or missed alarms (i.e., the monitoring tool cannot recognize the existence of a bearing defect) in diagnostic operations [3]. Several techniques have been proposed in the literature for bearing fault-related feature extraction, in which the analysis can be performed in the time domain, the frequ- ency domain, or the time-frequency domain [4-6]. In time-domain analysis, for example, a bearing fault is det- ected by monitoring the variation of some statistical in- dices such as root-mean-square value, crest factor or ku- rtosis. A bearing is believed to be damaged if the mon- itoring indices exceed predetermined thresholds; howev- er, it is usually challenging to determine robust threshol- ds in real-world applications. Frequency-domain analysis is based on the transformed signal in the frequency do- main. The advantage of frequency-domain analysis over time-domain analysis is its capability to easily identify and isolate certain spectral components of interest [7]. Bearing health conditions are assessed by examining the fault related characteristic frequency components in a spectrum or in some extended spectral expressions such as bispectrum or cepstrum maps [8,9]. Frequency-based techniques are usually supplemented with certain signal analysis methods to enhance representative spectral com- ponents, which include frequency filters, envelope analy- sis, and modulation sidebands analysis [10]. Frequency- domain techniques, however, are not suitable for the an- alysis of non-stationary signatures that are generally rela- ted to machinery defects. Non-stationary or transient sig- natures can be analyzed by applying time-frequency do- 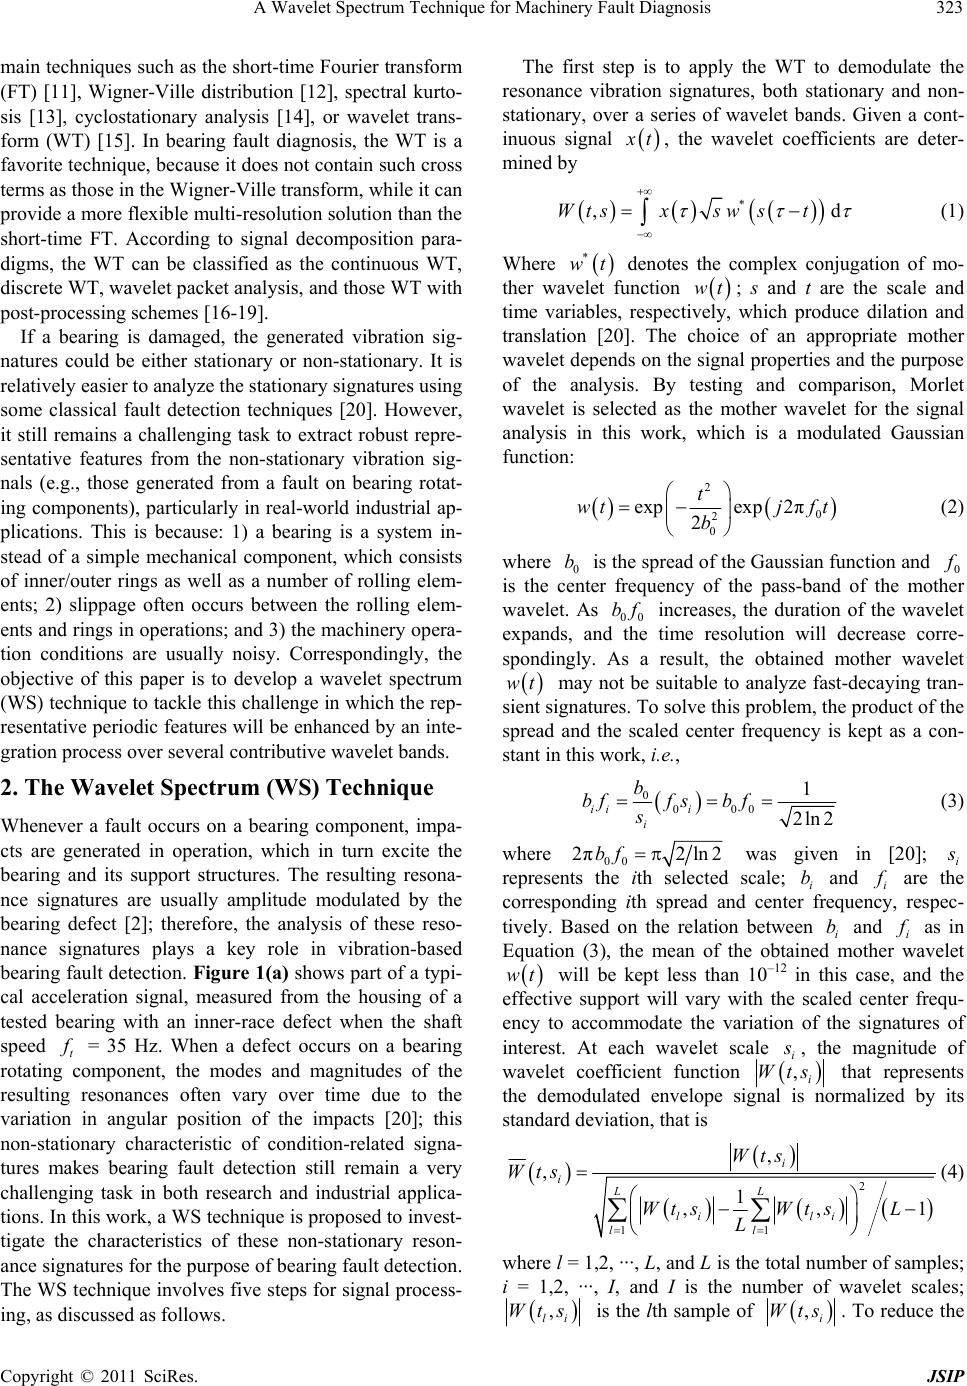 A Wavelet Spectrum Technique for Machinery Fault Diagnosis323 main techniques such as the short-time Fourier transform (FT) [11], Wigner-Ville distribution [12], spectral kurto- sis [13], cyclostationary analysis [14], or wavelet trans- form (WT) [15]. In bearing fault diagnosis, the WT is a favorite technique, because it does not contain such cross terms as those in the Wigner-Ville transform, while it can provide a more flexible multi-resolution solution than the short-time FT. According to signal decomposition para- digms, the WT can be classified as the continuous WT, discrete WT, wavelet packet analysis, and those WT with post-processing schemes [16-19]. If a bearing is damaged, the generated vibration sig- natures could be either stationary or non-stationary. It is relatively easier to analyze the stationary signatures using some classical fault detection techniques [20]. However, it still remains a challenging task to extract robust repre- sentative features from the non-stationary vibration sig- nals (e.g., those generated from a fault on bearing rotat- ing components), particularly in real-world industrial ap- plications. This is because: 1) a bearing is a system in- stead of a simple mechanical component, which consists of inner/outer rings as well as a number of rolling elem- ents; 2) slippage often occurs between the rolling elem- ents and rings in operations; and 3) the machinery opera- tion conditions are usually noisy. Correspondingly, the objective of this paper is to develop a wavelet spectrum (WS) technique to tackle this challenge in which the rep- resentative periodic features will be enhanced by an inte- gration process over several contributive wavelet bands. 2. The Wavelet Spectrum (WS) Technique Whenever a fault occurs on a bearing component, impa- cts are generated in operation, which in turn excite the bearing and its support structures. The resulting resona- nce signatures are usually amplitude modulated by the bearing defect [2]; therefore, the analysis of these reso- nance signatures plays a key role in vibration-based bearing fault detection. Figure 1(a) shows part of a typi- cal acceleration signal, measured from the housing of a tested bearing with an inner-race defect when the shaft speed t = 35 Hz. When a defect occurs on a bearing rotating component, the modes and magnitudes of the resulting resonances often vary over time due to the variation in angular position of the impacts [20]; this non-stationary characteristic of condition-related signa- tures makes bearing fault detection still remain a very challenging task in both research and industrial applica- tions. In this work, a WS technique is proposed to invest- tigate the characteristics of these non-stationary reson- ance signatures for the purpose of bearing fault detection. The WS technique involves five steps for signal process- ing, as discussed as follows. The first step is to apply the WT to demodulate the resonance vibration signatures, both stationary and non- stationary, over a series of wavelet bands. Given a cont- inuous signal t, the wavelet coefficients are deter- mined by * ,dWtsxsw st (1) Where * wt denotes the complex conjugation of mo- ther wavelet function wt ; s and t are the scale and time variables, respectively, which produce dilation and translation [20]. The choice of an appropriate mother wavelet depends on the signal properties and the purpose of the analysis. By testing and comparison, Morlet wavelet is selected as the mother wavelet for the signal analysis in this work, which is a modulated Gaussian function: 2 0 2 0 expexp 2π 2 t wtj ft b (2) where 0 is the spread of the Gaussian function and 0 b is the center frequency of the pass-band of the mother wavelet. As 00 increases, the duration of the wavelet expands, and the time resolution will decrease corre- spondingly. As a result, the obtained mother wavelet bf wt may not be suitable to analyze fast-decaying tran- sient signatures. To solve this problem, the product of the spread and the scaled center frequency is kept as a con- stant in this work, i.e., 0 000 1 2ln2 ii i i b bffs bf s (3) where 00 2π2ln2bf was given in [20]; i represents the ith selected scale; i b and i are the corresponding ith spread and center frequency, respec- tively. Based on the relation between i and i b as in Equation (3), the mean of the obtained mother wavelet wt will be kept less than 10–12 in this case, and the effective support will vary with the scaled center frequ- ency to accommodate the variation of the signatures of interest. At each wavelet scale i , the magnitude of wavelet coefficient function ,i sWt that represents the demodulated envelope signal is normalized by its standard deviation, that is 2 11 , , 1 ,, i iLL li li ll Wts Wts WtsWtsL L 1 (4) where l = 1,2, ···, L, and L is the total number of samples; i = 1,2, ···, I, and I is the number of wavelet scales; , li Wts is the lth sample of ,i Wts . To reduce the Copyright © 2011 SciRes. JSIP 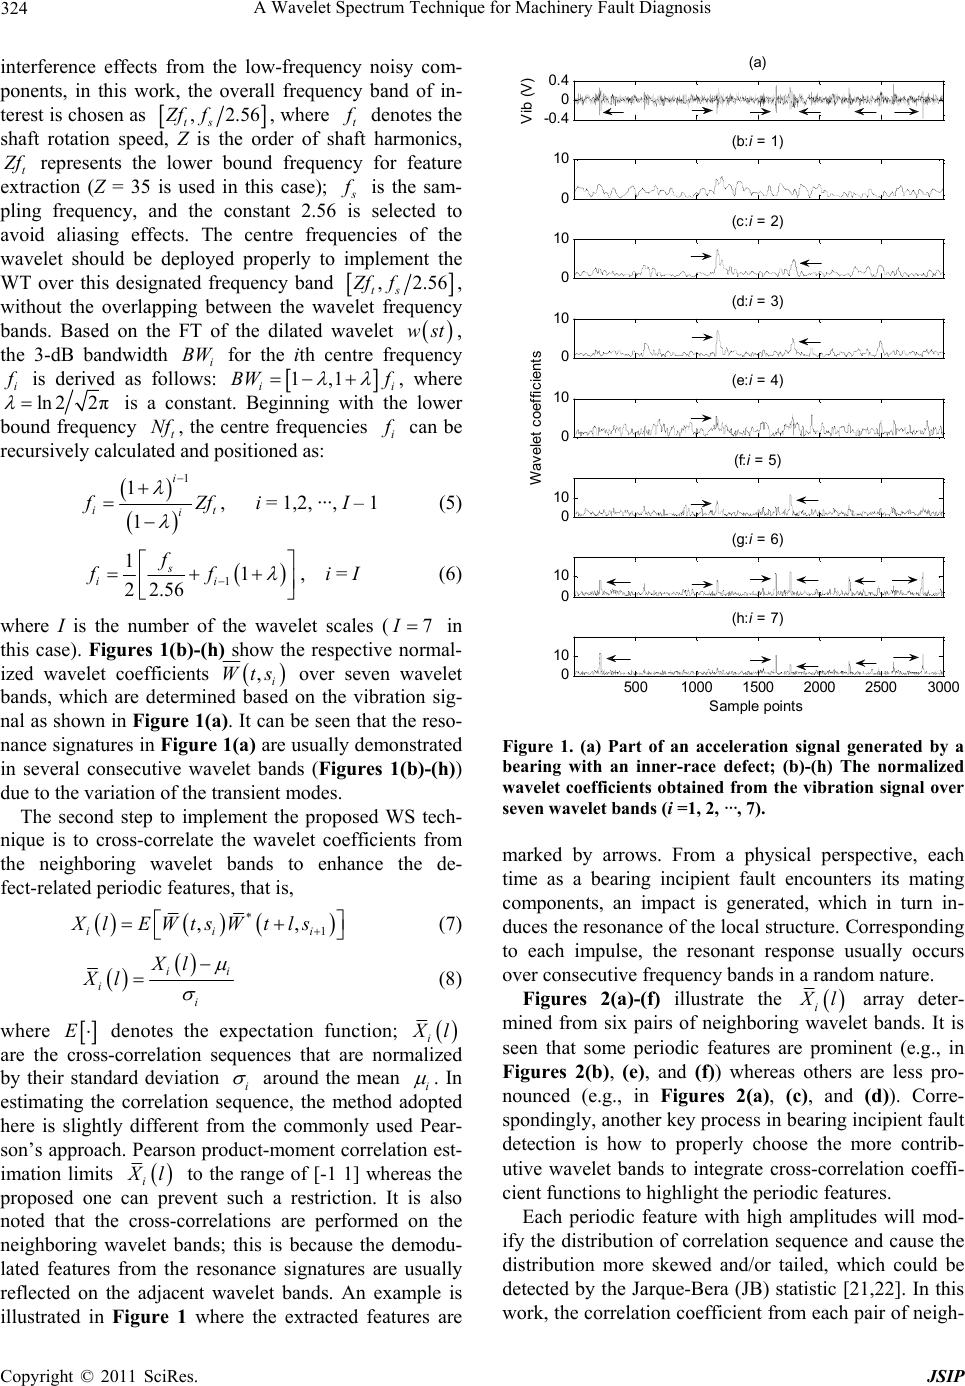 A Wavelet Spectrum Technique for Machinery Fault Diagnosis 324 interference effects from the low-frequency noisy com- ponents, in this work, the overall frequency band of in- terest is chosen as ,2.56 ts Zf f, where t denotes the shaft rotation speed, Z is the order of shaft harmonics, t f represents the lower bound frequency for feature extraction (Z = 35 is used in this case); is the sam- pling frequency, and the constant 2.56 is selected to avoid aliasing effects. The centre frequencies of the wavelet should be deployed properly to implement the WT over this designated frequency band ,2.56f ts , without the overlapping between the wavelet frequency bands. Based on the FT of the dilated wavelet Zf wst, the 3-dB bandwidth i for the ith centre frequency BW i is derived as follows: 1,BW f1 ii , where ln 22π is a constant. Beginning with the lower bound frequency t, the centre frequencies Nf i can be recursively calculated and positioned as: 1i i 1 1 it Zf , i = 1,2, ···, I – 1 (5) 11 i f 1 22 . s i f f 56 I , i = I (6) where I is the number of the wavelet scales (7 in this case). Figures 1(b)-(h) show the respective normal- ized wavelet coefficients ,i Wts over seven wavelet bands, which are determined based on the vibration sig- nal as shown in Figure 1(a). It can be seen that the reso- nance signatures in Figure 1(a) are usually demonstrated in several consecutive wavelet bands (Figures 1(b)-(h)) due to the variation of the transient modes. The second step to implement the proposed WS tech- nique is to cross-correlate the wavelet coefficients from the neighboring wavelet bands to enhance the de- fect-related periodic features, that is, , * 1 ,Xl EWtls ii Wtsi (7) i i Xl i i Xl (8) where E denotes the expectation function; i l are the cross-correlation sequences that are normalized by their standard deviation i around the mean i . In estimating the correlation sequence, the method adopted here is slightly different from the commonly used Pear- son’s approach. Pearson product-moment correlation est- imation limits i -0.4 0 0.4 (a) Vib (V) 0 10 (b:i = 1) 0 10 (c:i = 2) 0 10 (d:i = 3) 0 10 (e:i = 4) Wavelet coefficients 0 10 (f:i = 5) 0 10 (g:i = 6) 5001000 1500 2000 25003000 0 10 Sample points (h:i = 7) Figure 1. (a) Part of an acceleration signal generated by a bearing with an inner-race defect; (b)-(h) The normalized wavelet coefficients obtained from the vibration signal over seven wavele t bands ( i =1, 2, ···, 7). marked by arrows. From a physical perspective, each time as a bearing incipient fault encounters its mating components, an impact is generated, which in turn in- duces the resonance of the local structure. Corresponding to each impulse, the resonant response usually occurs over consecutive frequency bands in a random nature. Figures 2(a)-(f) illustrate the i l array deter- mined from six pairs of neighboring wavelet bands. It is seen that some periodic features are prominent (e.g., in Figures 2(b), (e), and (f)) whereas others are less pro- nounced (e.g., in Figures 2(a), (c), and (d)). Corre- spondingly, another key process in bearing incipient fault detection is how to properly choose the more contrib- utive wavelet bands to integrate cross-correlation coeffi- cient functions to highlight the periodic features. l to the range of [-1 1] whereas the proposed one can prevent such a restriction. It is also noted that the cross-correlations are performed on the neighboring wavelet bands; this is because the demodu- lated features from the resonance signatures are usually reflected on the adjacent wavelet bands. An example is illustrated in Figure 1 where the extracted features are Each periodic feature with high amplitudes will mod- ify the distribution of correlation sequence and cause the distribution more skewed and/or tailed, which could be detected by the Jarque-Bera (JB) statistic [21,22]. In this work, the correlation coefficient from each pair of neigh- Copyright © 2011 SciRes. JSIP 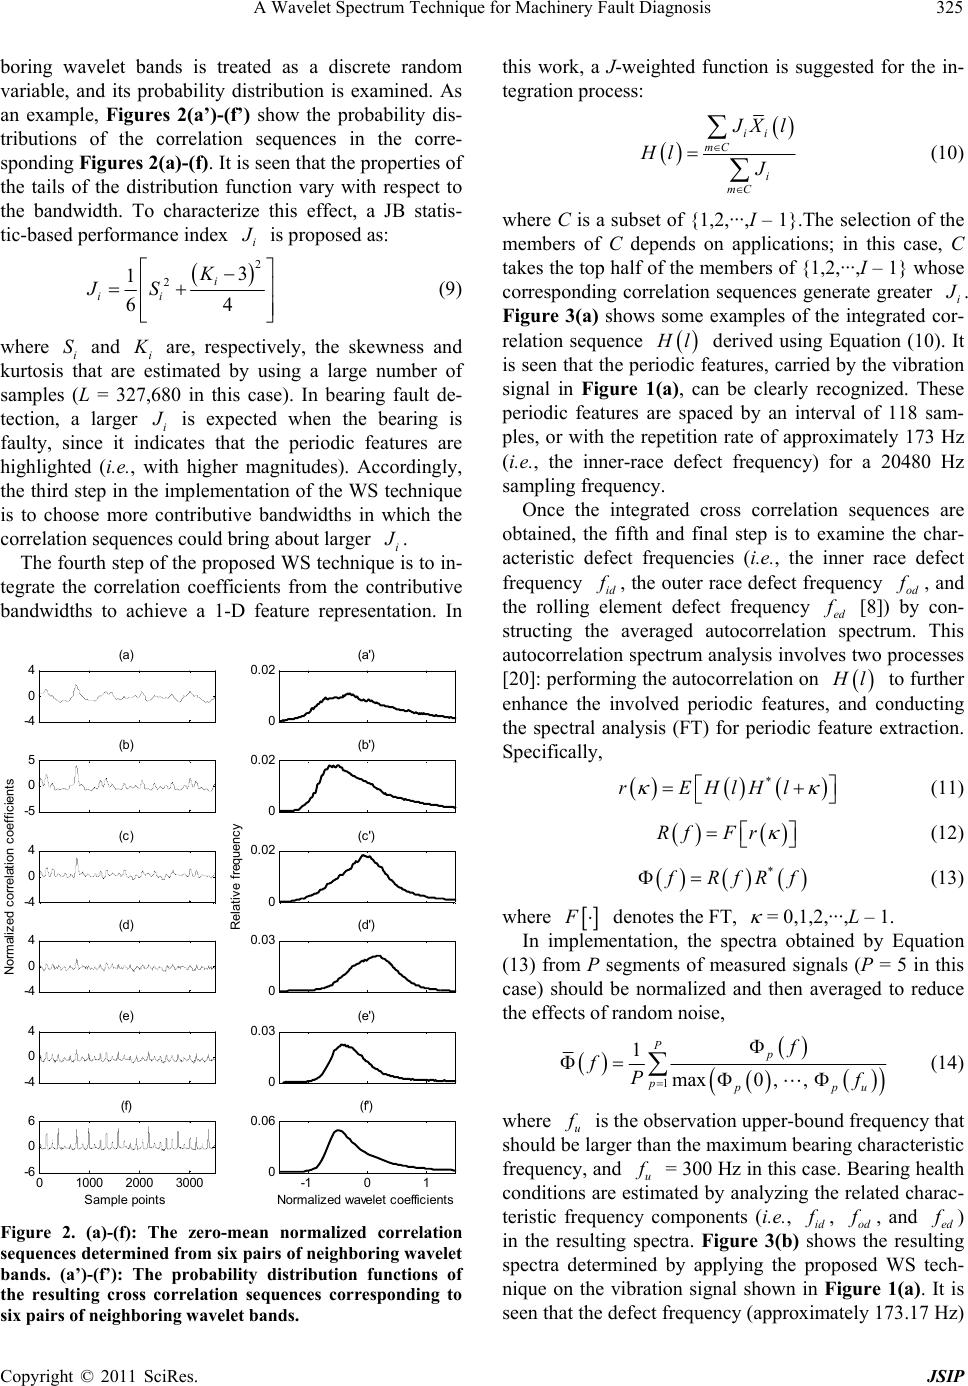 A Wavelet Spectrum Technique for Machinery Fault Diagnosis325 boring wavelet bands is treated as a discrete random variable, and its probability distribution is examined. As an example, Figures 2(a’)-(f’) show the probability dis- tributions of the correlation sequences in the corre- sponding Fig ures 2(a)-( f). It is seen that the properties of the tails of the distribution function vary with respect to the bandwidth. To characterize this effect, a JB statis- tic-based performance index i is proposed as: 2 23 1 64 i ii K JS (9) where i and i S are, respectively, the skewness and kurtosis that are estimated by using a large number of samples (L = 327,680 in this case). In bearing fault de- tection, a larger i is expected when the bearing is faulty, since it indicates that the periodic features are highlighted (i.e., with higher magnitudes). Accordingly, the third step in the implementation of the WS technique is to choose more contributive bandwidths in which the correlation sequences could bring about larger i . The fourth step of the proposed WS technique is to in- tegrate the correlation coefficients from the contributive bandwidths to achieve a 1-D feature representation. In -4 0 4(a) -5 0 5(b) -4 0 4 Normalized c orrelati on c oeff i cient s (c ) -4 0 4(d) -4 0 4(e) 01000 2000 3000 -6 0 6 Sample points (f) 0 0.02 (a') 0 0.02 (b') 0 0.02 (c') Relat ive frequenc y 0 0.03 (d') 0 0.03 (e') -1 0 1 0 0.06 (f') Normal i zed wavelet coeffic i ents Figure 2. (a)-(f): The zero-mean normalized correlation sequences determined fr om six pairs of neighboring wavelet bands. (a’)-(f’): The probability distribution functions of the resulting cross correlation sequences corresponding to six pairs of neighboring wavelet bands. this work, a J-weighted function is suggested for the in- tegration process: ii mC i mC Xl Hl J (10) where C is a subset of {1,2,···,I – 1}.The selection of the members of C depends on applications; in this case, C takes the top half of the members of {1,2,···,I – 1} whose corresponding correlation sequences generate greater i . Figure 3(a) shows some examples of the integrated cor- relation sequence l derived using Equation (10). It is seen that the periodic features, carried by the vibration signal in Figure 1(a), can be clearly recognized. These periodic features are spaced by an interval of 118 sam- ples, or with the repetition rate of approximately 173 Hz (i.e., the inner-race defect frequency) for a 20480 Hz sampling frequency. Once the integrated cross correlation sequences are obtained, the fifth and final step is to examine the char- acteristic defect frequencies (i.e., the inner race defect frequency id , the outer race defect frequency od , and the rolling element defect frequency ed [8]) by con- structing the averaged autocorrelation spectrum. This autocorrelation spectrum analysis involves two processes [20]: performing the autocorrelation on l to further enhance the involved periodic features, and conducting the spectral analysis (FT) for periodic feature extraction. Specifically, * rEHlHl (11) Rf Fr (12) * RfR f (13) where denotes the FT, = 0,1,2,···,L – 1. In implementation, the spectra obtained by Equation (13) from P segments of measured signals (P = 5 in this case) should be normalized and then averaged to reduce the effects of random noise, 1 1 max0 ,, Pp ppp f fPu (14) where u is the observation upper-bound frequency that should be larger than the maximum bearing characteristic frequency, and u = 300 Hz in this case. Bearing health conditions are estimated by analyzing the related charac- teristic frequency components (i.e., id , od , and ed) in the resulting spectra. Figure 3(b) shows the resulting spectra determined by applying the proposed WS tech- nique on the vibration signal shown in Figure 1(a). It is seen that the defect frequency (approximately 173.17 Hz) f f f ff Copyright © 2011 SciRes. JSIP 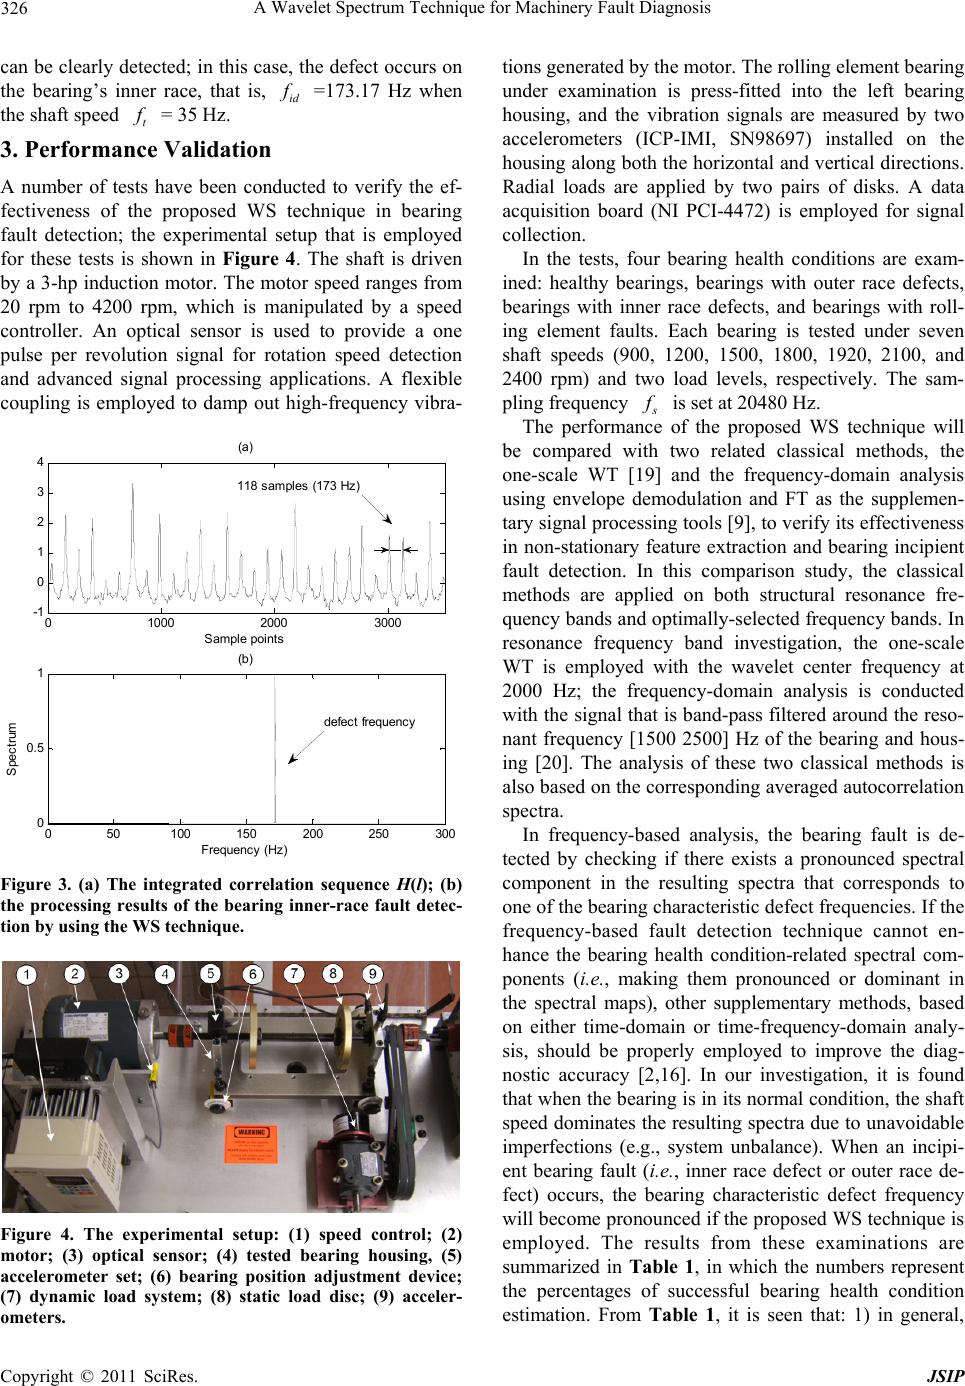 A Wavelet Spectrum Technique for Machinery Fault Diagnosis 326 can be clearly detected; in this case, the defect occurs on the bearing’s inner race, that is, =173.17 Hz when the shaft speed = 35 Hz. id f t f 3. Performance Validation A number of tests have been conducted to verify the ef- fectiveness of the proposed WS technique in bearing fault detection; the experimental setup that is employed for these tests is shown in Figure 4. The shaft is driven by a 3-hp induction motor. The motor speed ranges from 20 rpm to 4200 rpm, which is manipulated by a speed controller. An optical sensor is used to provide a one pulse per revolution signal for rotation speed detection and advanced signal processing applications. A flexible coupling is employed to damp out high-frequency vibra- 01000 20003000 -1 0 1 2 3 4(a) S am pl e poi nt s 050 100 150 200250 300 0 0.5 1(b) Frequen cy (H Spectrum z) 118 s (173 Hz )ampl es defect frequenc y Figure 3. (a) The integrated correlation sequence H(l); (b) the processing results of the bearing inner-race fault detec- tion by using the WS technique. Figure 4. The experimental setup: (1) speed control; (2) motor; (3) optical sensor; (4) tested bearing housing, (5) accelerometer set; (6) bearing position adjustment device; (7) dynamic load system; (8) static load disc; (9) acceler- ometers. tions generated by the motor. The rolling element bearing under examination is press-fitted into the left bearing housing, and the vibration signals are measured by two accelerometers (ICP-IMI, SN98697) installed on the housing along both the horizontal and vertical directions. Radial loads are applied by two pairs of disks. A data acquisition board (NI PCI-4472) is employed for signal collection. In the tests, four bearing health conditions are exam- ined: healthy bearings, bearings with outer race defects, bearings with inner race defects, and bearings with roll- ing element faults. Each bearing is tested under seven shaft speeds (900, 1200, 1500, 1800, 1920, 2100, and 2400 rpm) and two load levels, respectively. The sam- pling frequency f is set at 20480 Hz. The performance of the proposed WS technique will be compared with two related classical methods, the one-scale WT [19] and the frequency-domain analysis using envelope demodulation and FT as the supplemen- tary signal processing tools [9], to verify its effectiveness in non-stationary feature extraction and bearing incipient fault detection. In this comparison study, the classical methods are applied on both structural resonance fre- quency bands and optimally-selected frequency bands. In resonance frequency band investigation, the one-scale WT is employed with the wavelet center frequency at 2000 Hz; the frequency-domain analysis is conducted with the signal that is band-pass filtered around the reso- nant frequency [1500 2500] Hz of the bearing and hous- ing [20]. The analysis of these two classical methods is also based on the corresponding averaged autocorrelation spectra. In frequency-based analysis, the bearing fault is de- tected by checking if there exists a pronounced spectral component in the resulting spectra that corresponds to one of the bearing characteristic defect frequencies. If the frequency-based fault detection technique cannot en- hance the bearing health condition-related spectral com- ponents (i.e., making them pronounced or dominant in the spectral maps), other supplementary methods, based on either time-domain or time-frequency-domain analy- sis, should be properly employed to improve the diag- nostic accuracy [2,16]. In our investigation, it is found that when the bearing is in its normal condition, the shaft speed dominates the resulting spectra due to unavoidable imperfections (e.g., system unbalance). When an incipi- ent bearing fault (i.e. , inner race defect or outer race de- fect) occurs, the bearing characteristic defect frequency will become pronounced if the proposed WS technique is employed. The results from these examinations are summarized in Table 1, in which the numbers represent the percentages of successful bearing health condition estimation. From Table 1, it is seen that: 1) in general, Copyright © 2011 SciRes. JSIP 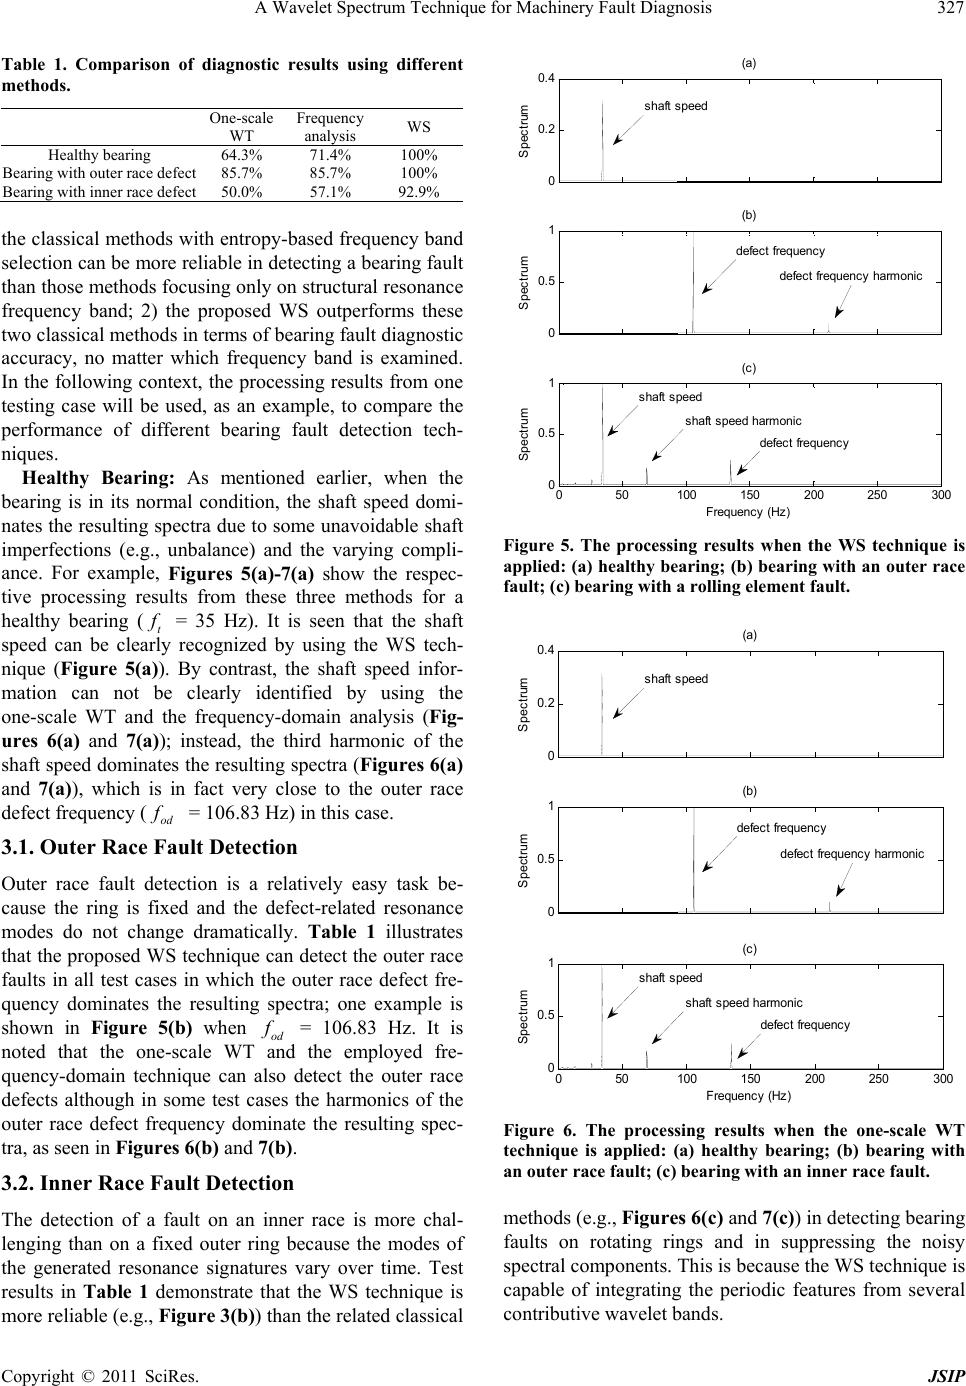 A Wavelet Spectrum Technique for Machinery Fault Diagnosis327 Table 1. Comparison of diagnostic results using different methods. One-scale WT Frequency analysis WS Healthy bearing 64.3% 71.4% 100% Bearing with outer race defect 85.7% 85.7% 100% Bearing with inner race defect 50.0% 57.1% 92.9% the classical methods with entropy-based frequency band selection can be more reliable in detecting a bearing fault than those methods focusing only on structural resonance frequency band; 2) the proposed WS outperforms these two classical methods in terms of bearing fault diagnostic accuracy, no matter which frequency band is examined. In the following context, the processing results from one testing case will be used, as an example, to compare the performance of different bearing fault detection tech- niques. Healthy Bearing: As mentioned earlier, when the bearing is in its normal condition, the shaft speed domi- nates the resulting spectra due to some unavoidable shaft imperfections (e.g., unbalance) and the varying compli- ance. For example, Figures 5(a)-7(a) show the respec- tive processing results from these three methods for a healthy bearing (t = 35 Hz). It is seen that the shaft speed can be clearly recognized by using the WS tech- nique (Figure 5(a)). By contrast, the shaft speed infor- mation can not be clearly identified by using the one-scale WT and the frequency-domain analysis (Fig- ures 6(a) and 7(a)); instead, the third harmonic of the shaft speed dominates the resulting spectra (Figures 6(a) and 7(a)), which is in fact very close to the outer race defect frequency ( = 106.83 Hz) in this case. f od f 3.1. Outer Race Fault Detection Outer race fault detection is a relatively easy task be- cause the ring is fixed and the defect-related resonance modes do not change dramatically. Table 1 illustrates that the proposed WS technique can detect the outer race faults in all test cases in which the outer race defect fre- quency dominates the resulting spectra; one example is shown in Figure 5(b) when od = 106.83 Hz. It is noted that the one-scale WT and the employed fre- quency-domain technique can also detect the outer race defects although in some test cases the harmonics of the outer race defect frequency dominate the resulting spec- tra, as seen in Figures 6(b) and 7(b). f 3.2. Inner Race Fault Detection The detection of a fault on an inner race is more chal- lenging than on a fixed outer ring because the modes of the generated resonance signatures vary over time. Test results in Table 1 demonstrate that the WS technique is more reliable (e.g., Figure 3(b)) than the related classical 0 0. 2 0.4 (a) Spectrum 0 0. 5 1(b) Spectrum 050100 150200250 300 0 0. 5 1(c) Frequenc y (Hz) Spectrum shaft speed defect frequenc y harm oni c defect frequenc y shaft speed s haft speed harm oni c defect frequenc y Figure 5. The processing results when the WS technique is applied: (a) healthy bearing; (b) bearing with an outer race fault; (c) bearing with a rolling element fault. 0 0.2 0.4 (a) Spectrum 0 0.5 1(b) Spectrum 050100 150 200250 300 0 0.5 1(c) Freque ncy (Hz ) Spectrum s h aft speed defec t frequency harm oni c defec t frequency s haft s peed shaft speed ha rm onic defec t frequency Figure 6. The processing results when the one-scale WT technique is applied: (a) healthy bearing; (b) bearing with an outer race fault; (c) bearing with an inner race fault. methods (e.g., Figures 6(c) and 7(c)) in detecting bearing faults on rotating rings and in suppressing the noisy spectral components. This is because the WS technique is capable of integrating the periodic features from several contributive wavelet bands. Copyright © 2011 SciRes. JSIP 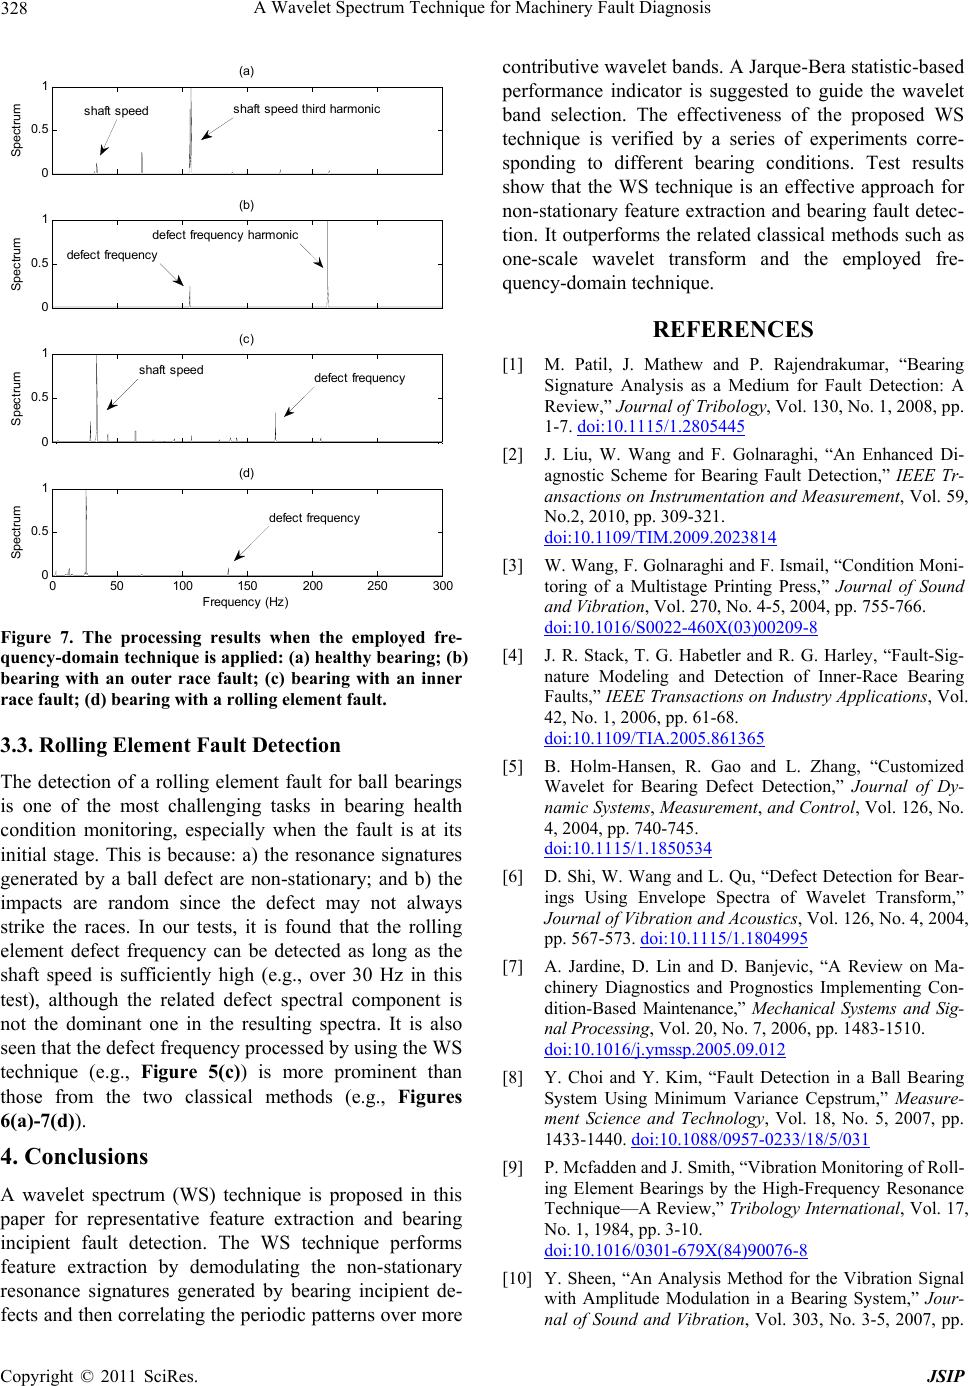 A Wavelet Spectrum Technique for Machinery Fault Diagnosis 328 0 0.5 1(a) S pectrum 0 0.5 1(b) S pectrum 0 0.5 1(c) Spectrum 050100 150200 250300 0 0.5 1(d) S pectrum Frequency (Hz ) shaft speed defect frequency s haft speed defect frequency defect frequency harm oni c s haft speed t hi rd harm oni c defect frequency Figure 7. The processing results when the employed fre- quency-domain technique is applied: (a) healthy bearing; (b) bearing with an outer race fault; (c) bearing with an inner race fault; (d) bearing with a rolling element fault. 3.3. Rolling Element Fault Detection The detection of a rolling element fault for ball bearings is one of the most challenging tasks in bearing health condition monitoring, especially when the fault is at its initial stage. This is because: a) the resonance signatures generated by a ball defect are non-stationary; and b) the impacts are random since the defect may not always strike the races. In our tests, it is found that the rolling element defect frequency can be detected as long as the shaft speed is sufficiently high (e.g., over 30 Hz in this test), although the related defect spectral component is not the dominant one in the resulting spectra. It is also seen that the defect frequency processed by using the WS technique (e.g., Figure 5(c)) is more prominent than those from the two classical methods (e.g., Figures 6(a)-7(d)). 4. Conclusions A wavelet spectrum (WS) technique is proposed in this paper for representative feature extraction and bearing incipient fault detection. The WS technique performs feature extraction by demodulating the non-stationary resonance signatures generated by bearing incipient de- fects and then correlating the periodic patterns over more contributive wavelet bands. A Jarque-Bera statistic-based performance indicator is suggested to guide the wavelet band selection. The effectiveness of the proposed WS technique is verified by a series of experiments corre- sponding to different bearing conditions. Test results show that the WS technique is an effective approach for non-stationary feature extraction and bearing fault detec- tion. It outperforms the related classical methods such as one-scale wavelet transform and the employed fre- quency-domain technique. REFERENCES [1] M. Patil, J. Mathew and P. Rajendrakumar, “Bearing Signature Analysis as a Medium for Fault Detection: A Review,” Journal of Tribology, Vol. 130, No. 1, 2008, pp. 1-7. doi:10.1115/1.2805445 [2] J. Liu, W. Wang and F. Golnaraghi, “An Enhanced Di- agnostic Scheme for Bearing Fault Detection,” IEEE Tr- ansactions on Instrumentation and Measurement, Vol. 59, No.2, 2010, pp. 309-321. doi:10.1109/TIM.2009.2023814 [3] W. Wang, F. Golnaraghi and F. Ismail, “Condition Moni- toring of a Multistage Printing Press,” Journal of Sound and Vibration, Vol. 270, No. 4-5, 2004, pp. 755-766. doi:10.1016/S0022-460X(03)00209-8 [4] J. R. Stack, T. G. Habetler and R. G. Harley, “Fault-Sig- nature Modeling and Detection of Inner-Race Bearing Faults,” IEEE Transactions on Industry Applications, Vol. 42, No. 1, 2006, pp. 61-68. doi:10.1109/TIA.2005.861365 [5] B. Holm-Hansen, R. Gao and L. Zhang, “Customized Wavelet for Bearing Defect Detection,” Journal of Dy- namic Systems, Measurement, and Control, Vol. 126, No. 4, 2004, pp. 740-745. doi:10.1115/1.1850534 [6] D. Shi, W. Wang and L. Qu, “Defect Detection for Bear- ings Using Envelope Spectra of Wavelet Transform,” Journal of Vibration and Acoustics, Vol. 126, No. 4, 2004, pp. 567-573. doi:10.1115/1.1804995 [7] A. Jardine, D. Lin and D. Banjevic, “A Review on Ma- chinery Diagnostics and Prognostics Implementing Con- dition-Based Maintenance,” Mechanical Systems and Sig- nal Processing, Vol. 20, No. 7, 2006, pp. 1483-1510. doi:10.1016/j.ymssp.2005.09.012 [8] Y. Choi and Y. Kim, “Fault Detection in a Ball Bearing System Using Minimum Variance Cepstrum,” Measure- ment Science and Technology, Vol. 18, No. 5, 2007, pp. 1433-1440. doi:10.1088/0957-0233/18/5/031 [9] P. Mcfadden and J. Smith, “Vibration Monitoring of Roll- ing Element Bearings by the High-Frequency Resonance Technique—A Review,” Tribology International, Vol. 17, No. 1, 1984, pp. 3-10. doi:10.1016/0301-679X(84)90076-8 [10] Y. Sheen, “An Analysis Method for the Vibration Signal with Amplitude Modulation in a Bearing System,” Jour- nal of Sound and Vibration, Vol. 303, No. 3-5, 2007, pp. Copyright © 2011 SciRes. JSIP 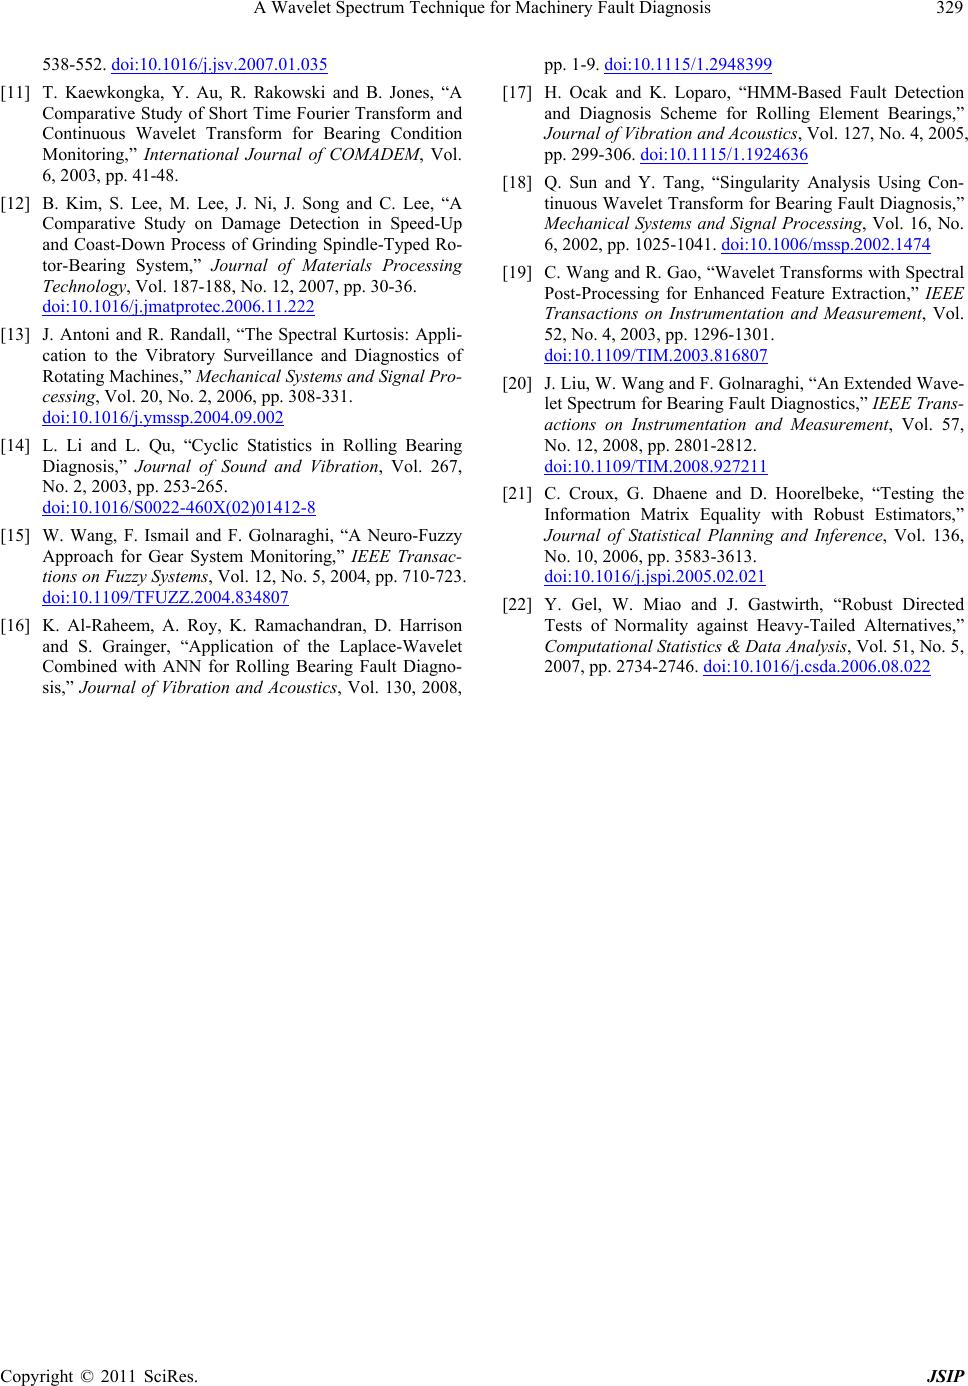 A Wavelet Spectrum Technique for Machinery Fault Diagnosis Copyright © 2011 SciRes. JSIP 329 538-552. doi:10.1016/j.jsv.2007.01.035 [11] T. Kaewkongka, Y. Au, R. Rakowski and B. Jones, “A Comparative Study of Short Time Fourier Transform and Continuous Wavelet Transform for Bearing Condition Monitoring,” International Journal of COMADEM, Vol. 6, 2003, pp. 41-48. [12] B. Kim, S. Lee, M. Lee, J. Ni, J. Song and C. Lee, “A Comparative Study on Damage Detection in Speed-Up and Coast-Down Process of Grinding Spindle-Typed Ro- tor-Bearing System,” Journal of Materials Processing Technology, Vol. 187-188, No. 12, 2007, pp. 30-36. doi:10.1016/j.jmatprotec.2006.11.222 [13] J. Antoni and R. Randall, “The Spectral Kurtosis: Appli- cation to the Vibratory Surveillance and Diagnostics of Rotating Machines,” Mechanical Systems and Signal Pro- cessing, Vol. 20, No. 2, 2006, pp. 308-331. doi:10.1016/j.ymssp.2004.09.002 [14] L. Li and L. Qu, “Cyclic Statistics in Rolling Bearing Diagnosis,” Journal of Sound and Vibration, Vol. 267, No. 2, 2003, pp. 253-265. doi:10.1016/S0022-460X(02)01412-8 [15] W. Wang, F. Ismail and F. Golnaraghi, “A Neuro-Fuzzy Approach for Gear System Monitoring,” IEEE Transac- tions on Fuzzy Systems, Vol. 12, No. 5, 2004, pp. 710-723. doi:10.1109/TFUZZ.2004.834807 [16] K. Al-Raheem, A. Roy, K. Ramachandran, D. Harrison and S. Grainger, “Application of the Laplace-Wavelet Combined with ANN for Rolling Bearing Fault Diagno- sis,” Journal of Vibration and Acoustics, Vol. 130, 2008, pp. 1-9. doi:10.1115/1.2948399 [17] H. Ocak and K. Loparo, “HMM-Based Fault Detection and Diagnosis Scheme for Rolling Element Bearings,” Journal of Vibration and Acoustics, Vol. 127, No. 4, 2005, pp. 299-306. doi:10.1115/1.1924636 [18] Q. Sun and Y. Tang, “Singularity Analysis Using Con- tinuous Wavelet Transform for Bearing Fault Diagnosis,” Mechanical Systems and Signal Processing, Vol. 16, No. 6, 2002, pp. 1025-1041. doi:10.1006/mssp.2002.1474 [19] C. Wang and R. Gao, “Wavelet Transforms with Spectral Post-Processing for Enhanced Feature Extraction,” IEEE Transactions on Instrumentation and Measurement, Vol. 52, No. 4, 2003, pp. 1296-1301. doi:10.1109/TIM.2003.816807 [20] J. Liu, W. Wang and F. Golnaraghi, “An Extended Wave- let Spectrum for Bearing Fault Diagnostics,” IEEE Trans- actions on Instrumentation and Measurement, Vol. 57, No. 12, 2008, pp. 2801-2812. doi:10.1109/TIM.2008.927211 [21] C. Croux, G. Dhaene and D. Hoorelbeke, “Testing the Information Matrix Equality with Robust Estimators,” Journal of Statistical Planning and Inference, Vol. 136, No. 10, 2006, pp. 3583-3613. doi:10.1016/j.jspi.2005.02.021 [22] Y. Gel, W. Miao and J. Gastwirth, “Robust Directed Tests of Normality against Heavy-Tailed Alternatives,” Computational Statistics & Data Analysis, Vol. 51, No. 5, 2007, pp. 2734-2746. doi:10.1016/j.csda.2006.08.022
|