Journal of Environmental Protection, 2011, 2, 1143-1148
doi:10.4236/jep.2011.29133 Published Online November 2011 (http://www.scirp.org/journal/jep)
Copyright © 2011 SciRes. JEP
An Indoor Radon Survey in Three Different
Climate Regions in Mexico, and the Influence of
Climate in the Obtained Values
Guillermo Espinosa1, Richard Gammage2
1Instituto de Física, Universidad Nacional Autónoma de México, Coyoacán, México; 2Oak Ridge National Laboratory, Oak Ridge,
USA.
Email: espinosa@fisica.unam.mx
Received May 17th, 2011; revised August 19th, 2011; accepted October 2nd, 2011.
ABSTRACT
In this paper we present the results of a survey of indoor radon concentration levels in Mexico. In order to investigate
whether differences in climate translate into significant differences in indoor radon concentrations, the country was
divided into three climate regions: the northern semi-desert region, the central semitropical region and the southern
tropical region. The survey was carried out using nuclear track methodology. The dosimeters employed for the survey
were based on the passive closed-end cup device, developed at the Physics Institute of the National Autonomous Uni-
versity of Mexico, and used PADC as detector material. A well-established protocol for chemically etching and reading
the detectors was followed. Average annual temp eratures differ between regions (from 15˚C t o 28˚C) but vary rela tivel y
little within each region. Atmospheric temperature is one of the most important factors which need to be considered
when carrying out a survey of indoor radon concentrations becau se temperature largely determines building ventilation
habits, and ventilation habits are known to have significant effects on indoor radon concentrations. Other factors, in-
cluding building construction materials, architectural styles, geological and hydrological characteristics, and seismic-
ity, vary from region to region and within each region. In each of the three regions low levels of indoor radon (from 37
to 179 Bq·m3) were found.
Keywords: Radon, Indoor Radon, Climate Influence, Nuclear Tracks Methodology
1. Introduction
The radioactive gas radon is a decay product of naturally
occurring uranium. Radon builds up in confined areas,
and accounts for approximately 50% of the effective
dose to which the general public is exposed [1]. The in-
halation of radon progeny such as polonium, lead and
bismuth is a significant cause of lung cancer throughout
the world. Determining indoor radon concentrations in
dwellings and workplaces is thus an important public
health problem.
Several national and international organizations and
institutions have condu cted national surveys of indoor ra-
don concentrations [2-5]. The measurement of indoor ra-
don concentration levels forms a mandatory part of ra-
diation safety procedures in the United Kingdom, the
United States of America, the Nordic countries and, in
general, countries which experience cold climates for a
significant part of year.
The concentrations of radon and its progeny inside a
given dwelling depend on numerous factors, the most
important of which are the uranium concentrations both
in the soil surrounding the dwelling and in the building
materials themselves, atmospheric conditions, architec-
tural style (for example, whether there is a slab basement,
a crawl space, etc.), porosity of the surrounding soil,
building layout, and the ventilation habits of the inhabi-
tants of the building. The large variability in the factors
listed above contribute to potentially large variability in
indoor radon concentrations and motivate detailed, na-
tion-wide indoor radon surveys such as that described
here.
Indoor radon concentration measurements are also
important from the public health point of view in coun-
tries with more benign climates. In these countries, the
ventilation habits of the inhabitants, themselves largely
determined by climate, are more important than other
An Indoor Radon Survey in Three Different Climate Regions in Mexico, and the Influence of
1144 Climate in the Obtained Values
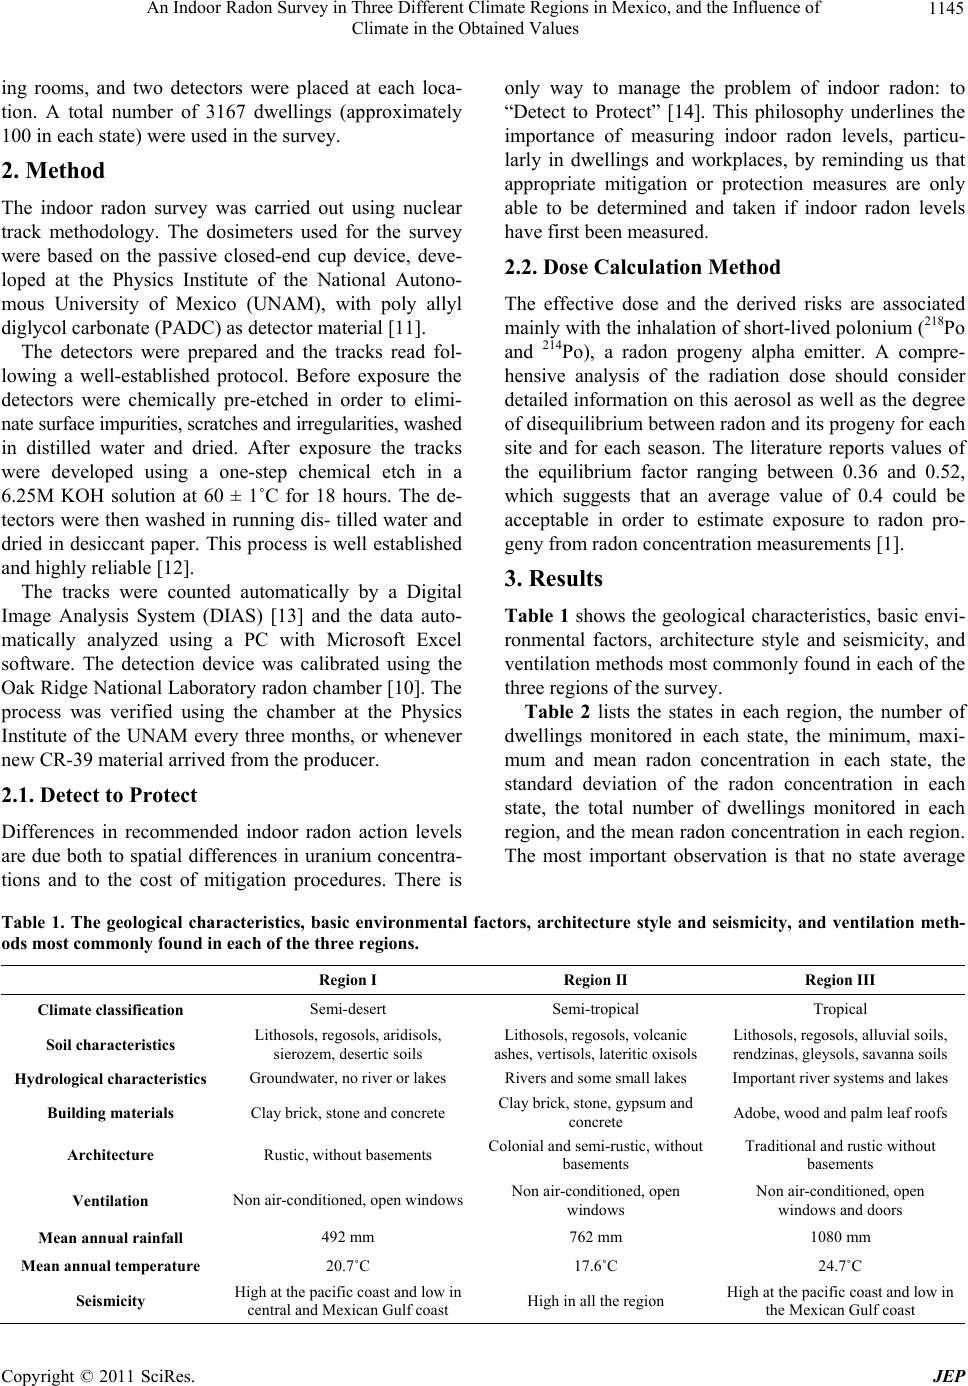
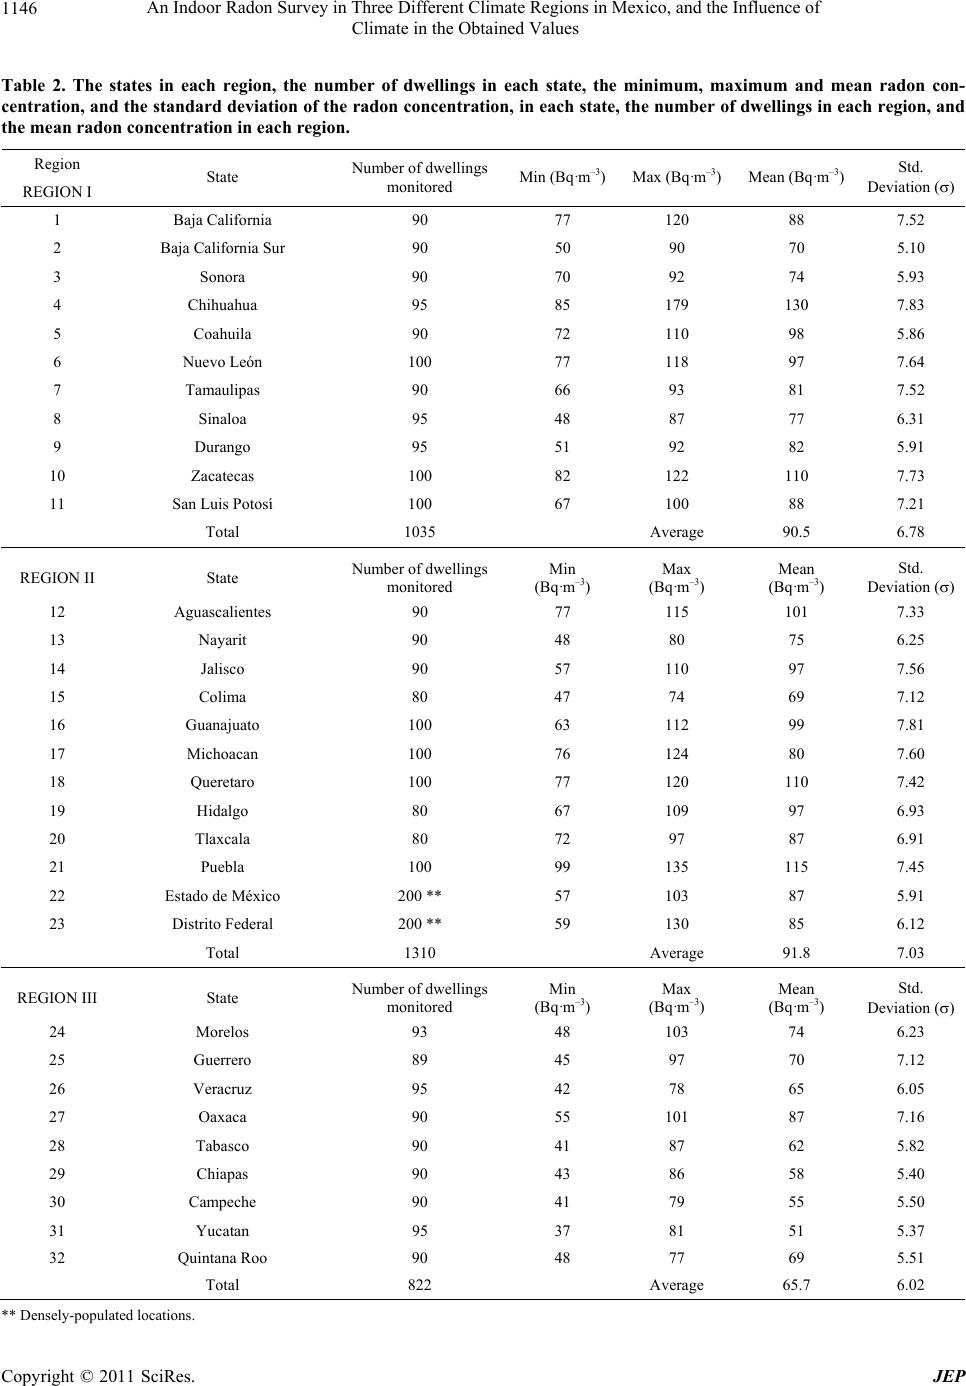
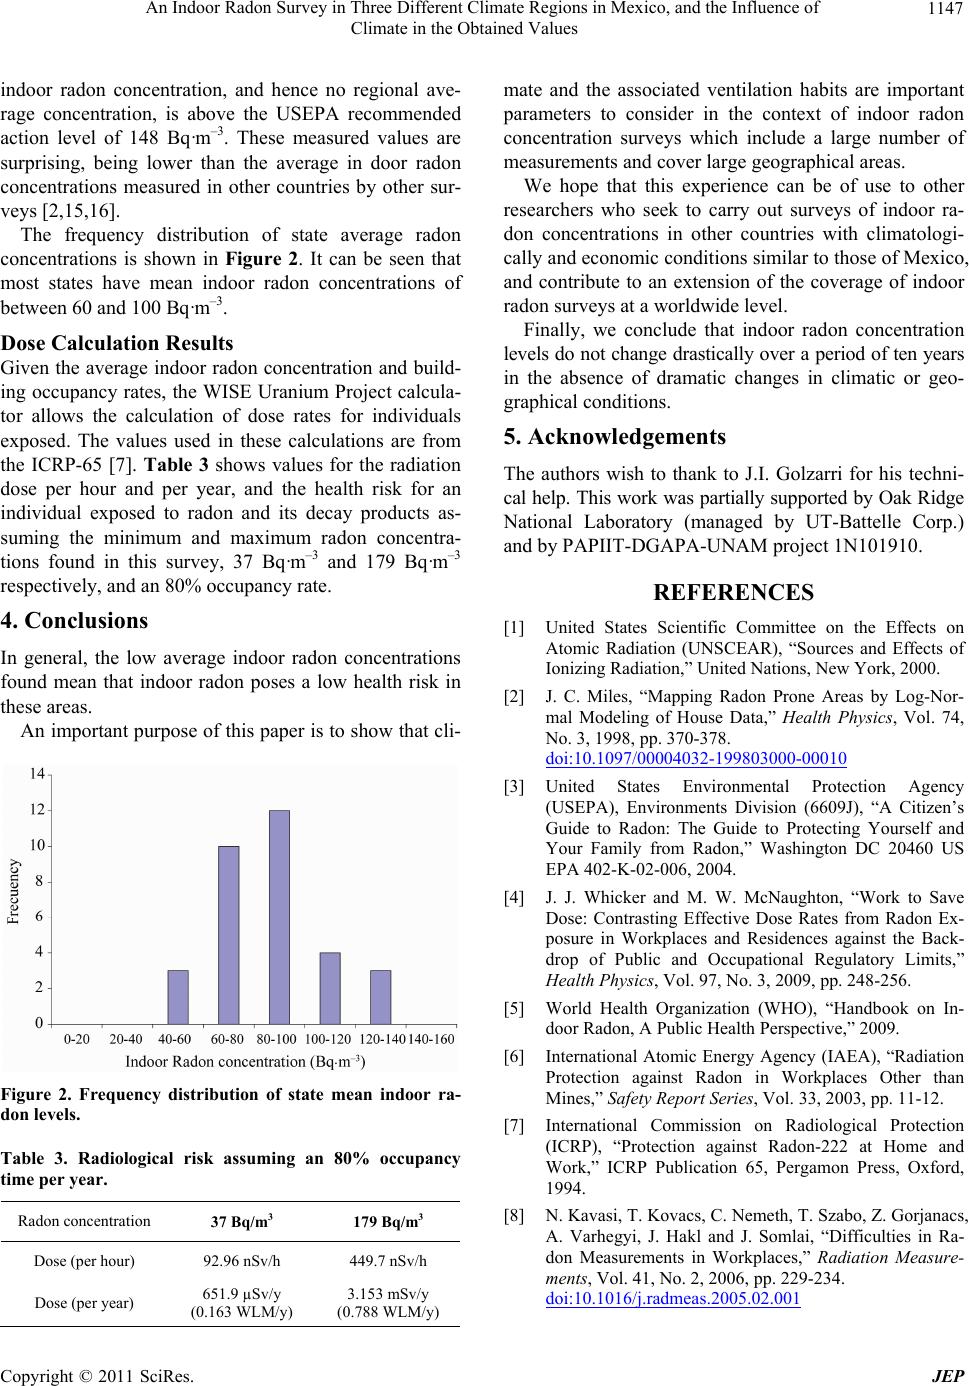
factors in determining th e differences in the in door radon
levels over large spatial scales.
1.1. Regulations and Action Levels in Selected
Countries
A radon action level is a concentration of radon gas
above which remedial or protective actions should be ca-
rried out. Both the International Commission on Radio-
logical Protection (ICRP) and the International Atomic
Energy Agency (IAEA) suggest allowable radon concen-
trations of 200 to 600 Bq·m–3 in dwellings and 500 to
1500 Bq·m–3 in workplaces [6,7]. However both agencies
allow national authorities a significant degree of auton-
omy in establishing action levels.
The European Union accepts the reference values
recommended by the ICRP in its Publication 65 [7]. Th e
United States Environmental Protection Agency (USEPA)
uses a reference level of 148 Bq·m–3 for dwellings and
400 Bq·m–3 for workplaces [3]. In the UK, the Health
and Safety Executive (HSE) [8] h as adopted radon action
levels of 200 Bq·m–3 for dwellings and 400 Bq·m–3 for
workplaces. In Israel there is a mandatory reference level
of 200 Bq·m–3 for already existing schools and day care
centers and an advisory reference level of 400 Bq·m–3 for
all other already existing workplaces. For new schools
and day care centers the advisory level is 40 Bq·m–3
while that for other new workplaces [9]. In contrast, in
Mexico there are no specific regulations relating to in-
door radon levels in either homes or workplaces. It is
hoped that the survey d escribed here will aid the relev ant
government institutions to establish appropriate regula-
tions in the near fu ture.
1.2. Indoor Radon Survey Strategy
Mexico is a large country in terms of both area and popu-
lation. It covers an area of 1,967,183 km2 and extends
from the southern border of the United States, in North
America, to the northern border of Guatemala, consi-
dered to be part of Central America. For the purposes of
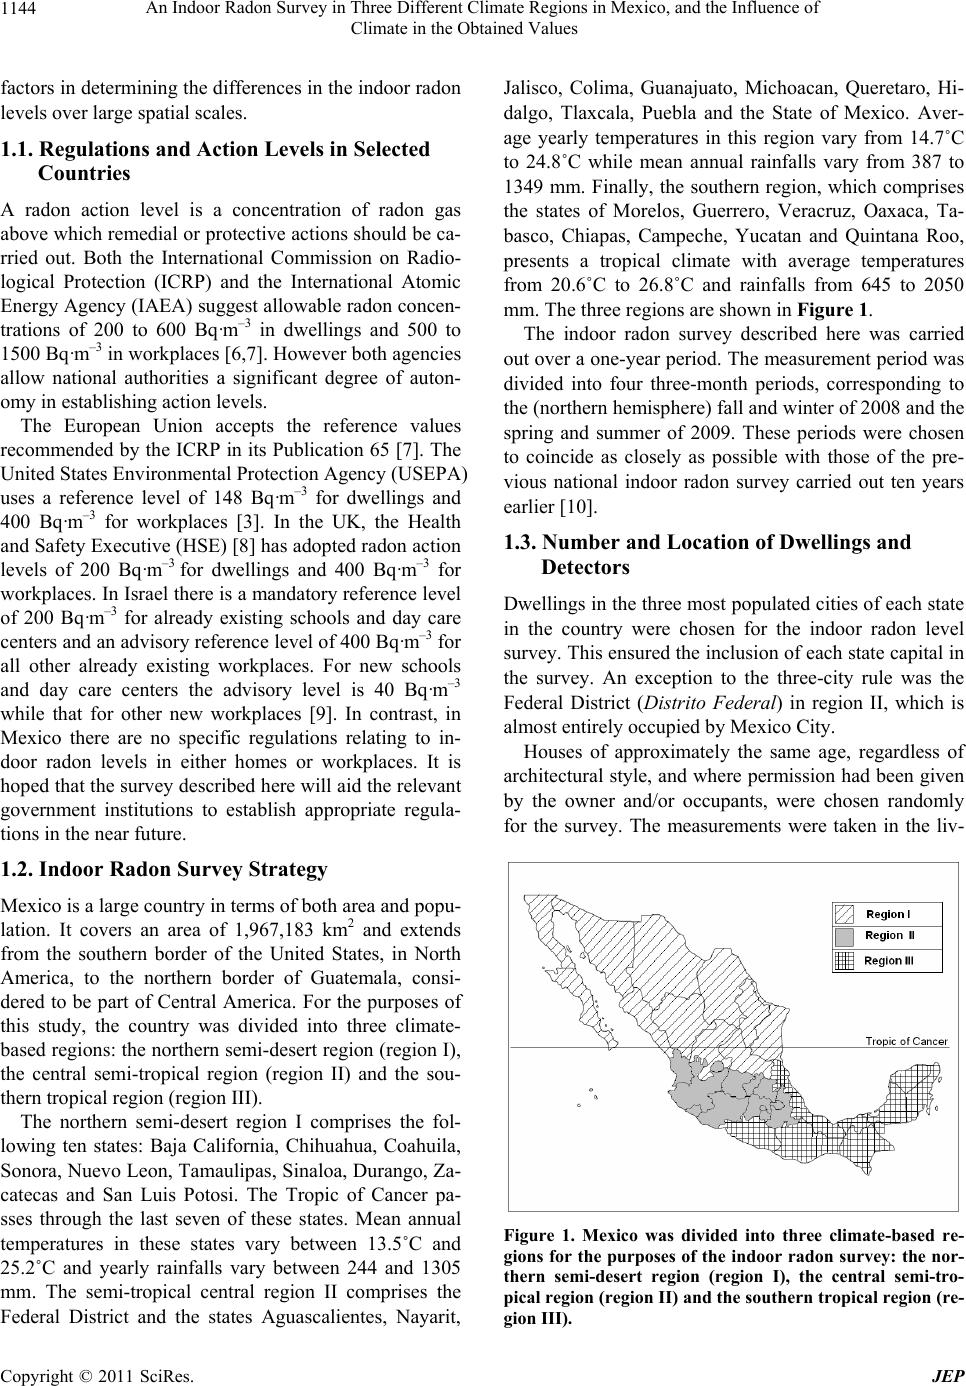
this study, the country was divided into three climate-
based regions: the nor thern semi-desert region (region I),
the central semi-tropical region (region II) and the sou-
thern tropical r e gi o n (re gi o n III).
The northern semi-desert region I comprises the fol-
lowing ten states: Baja California, Chihuahua, Coahuila,
Sonora, Nuevo Leon, Tamaulipas, Sinaloa, Durango, Za-
catecas and San Luis Potosi. The Tropic of Cancer pa-
sses through the last seven of these states. Mean annual
temperatures in these states vary between 13.5˚C and
25.2˚C and yearly rainfalls vary between 244 and 1305
mm. The semi-tropical central region II comprises the
Federal District and the states Aguascalientes, Nayarit,
Jalisco, Colima, Guanajuato, Michoacan, Queretaro, Hi-
dalgo, Tlaxcala, Puebla and the State of Mexico. Aver-
age yearly temperatures in this region vary from 14.7˚C
to 24.8˚C while mean annual rainfalls vary from 387 to
1349 mm. Finally, the southern region, which comprises
the states of Morelos, Guerrero, Veracruz, Oaxaca, Ta-
basco, Chiapas, Campeche, Yucatan and Quintana Roo,
presents a tropical climate with average temperatures
from 20.6˚C to 26.8˚C and rainfalls from 645 to 2050
mm. The three regions are shown in Figure 1.
The indoor radon survey described here was carried
out over a one-year period. The measurement period was
divided into four three-month periods, corresponding to
the (northern hemisphere) fall and winter of 2008 and the
spring and summer of 2009. These periods were chosen
to coincide as closely as possible with those of the pre-
vious national indoor radon survey carried out ten years
earlier [10].
1.3. Number and Location of Dwellings and
Detectors
Dwellings in the three most populated cities of each state
in the country were chosen for the indoor radon level
survey. This ensured the inclusion of each state capital in
the survey. An exception to the three-city rule was the
Federal District (Distrito Federal) in region II, which is
almost entirely occupied by Mexico City.
Houses of approximately the same age, regardless of
architectural style, and where permission had been given
by the owner and/or occupants, were chosen randomly
for the survey. The measurements were taken in the liv-
Figure 1. Mexico was divided into three climate-based re-
gions for the purposes of the indoor radon survey: the nor-
thern semi-desert region (region I), the central semi-tro-
pical region (region II) and the southe rn tropic al region (re -
gion III).
C
opyright © 2011 SciRes. JEP
An Indoor Radon Survey in Three Different Climate Regions in Mexico, and the Influence of
Climate in the Obtained Values
Copyright © 2011 SciRes. JEP
1145
ing rooms, and two detectors were placed at each loca-
tion. A total number of 3167 dwellings (approximately
100 in each state) were used in the survey.
2. Method
The indoor radon survey was carried out using nuclear
track methodology. The dosimeters used for the survey
were based on the passive closed-end cup device, deve-
loped at the Physics Institute of the National Autono-
mous University of Mexico (UNAM), with poly allyl
diglycol carbonate (PADC) as detector material [11].
The detectors were prepared and the tracks read fol-
lowing a well-established protocol. Before exposure the
detectors were chemically pre-etched in order to elimi-
nate surface impurities, scratches and irregularities, washed
in distilled water and dried. After exposure the tracks
were developed using a one-step chemical etch in a
6.25M KOH solution at 60 ± 1˚C for 18 hours. The de-
tectors were then washed in running dis- tilled water and
dried in desiccant paper. This process is well established
and highly reliable [12].
The tracks were counted automatically by a Digital
Image Analysis System (DIAS) [13] and the data auto-
matically analyzed using a PC with Microsoft Excel
software. The detection device was calibrated using the
Oak Ridge Natio nal Laboratory radon ch amber [10]. Th e
process was verified using the chamber at the Physics
Institute of the UNAM every three months, or whenever
new CR-39 material arrived from the producer.
2.1. Detect to Protect
Differences in recommended indoor radon action levels
are due both to spatial differences in uranium concentra-
tions and to the cost of mitigation procedures. There is
only way to manage the problem of indoor radon: to
“Detect to Protect” [14]. This philosophy underlines the
importance of measuring indoor radon levels, particu-
larly in dwellings and workplaces, by reminding us that
appropriate mitigation or protection measures are only
able to be determined and taken if indoor radon levels
have first been measured.
2.2. Dose Calculation Method
The effective dose and the derived risks are associated
mainly with the inh alation of short-lived polonium (218Po
and 214Po), a radon progeny alpha emitter. A compre-
hensive analysis of the radiation dose should consider
detailed information on this aerosol as well as the degree
of disequilibrium between radon and its progen y for each
site and for each season. The literature reports values of
the equilibrium factor ranging between 0.36 and 0.52,
which suggests that an average value of 0.4 could be
acceptable in order to estimate exposure to radon pro-
geny from radon concentration measurements [1].
3. Results
Table 1 shows the geological characteristics, basic envi-
ronmental factors, architecture style and seismicity, and
ventilation methods most commonly found in each of the
three regi o n s o f the survey.
Table 2 lists the states in each region, the number of
dwellings monitored in each state, the minimum, maxi-
mum and mean radon concentration in each state, the
standard deviation of the radon concentration in each
state, the total number of dwellings monitored in each
region, and the mean rado n concentration in each region .
The most important observation is that no state average
Table 1. The geological characteristics, basic environmental factors, architecture style and seismicity, and ventilation meth-
ods most commonly found in each of the three regions.
Region I Region II Region III
Climate classification Semi-desert Semi-tropical Tropical
Soil characteristics Lithosols, regosols, aridisols,
sierozem, desertic soils Lithosols, regosols , volcanic
ashes, vertisols, lateritic oxisols Lithosols, regosols, alluvial soils,
rendzinas, gleysol s, sav a n n a s o il s
Hydrological characteristics Groundwater, no river or lakes Rivers and some small lakes Important river systems and lakes
Building materials Clay brick, stone and concrete Clay brick, stone, gypsum and
concrete Adobe, wood and palm leaf roofs
Architecture Rustic, without basements Colonial and semi-rustic, without
basements Traditional and rustic wi t h o u t
basements
Ventilation Non air-conditioned, open windowsNon air-conditioned, open
windows Non air-conditioned, open
windows and doors
Mean annual rainfall 492 mm 762 mm 1080 mm
Mean annual temperature 20.7˚C 17.6˚C 24.7˚C
Seismicity High at the pacific coast and low in
central and Mexican Gulf coast High in all t he region High at the pacific coast and low in
the Mexican Gulf coast
An Indoor Radon Survey in Three Different Climate Regions in Mexico, and the Influence of
1146 Climate in the Obtained Values
Table 2. The states in each region, the number of dwellings in each state, the minimum, maximum and mean radon con-
centration, and the standard deviation of the radon concentration, in each state, the number of dwellings in each region, and
the mean radon concentration in each region.
Region
REGION I State Number of dwellings
monitored Min (Bq·m–3)Max (Bq·m
–3)Mean (Bq·m–3) Std.
Deviation ()
1 Baja California 90 77 120 88 7.52
2 Baja California Sur 90 50 90 70 5.10
3 Sonora 90 70 92 74 5.93
4 Chihuahua 95 85 179 130 7.83
5 Coahuila 90 72 110 98 5.86
6 Nuevo León 100 77 118 97 7.64
7 Tamaulipas 90 66 93 81 7.52
8 Sinaloa 95 48 87 77 6.31
9 Durango 95 51 92 82 5.91
10 Zacatecas 100 82 122 110 7.73
11 San Luis Potosí 100 67 100 88 7.21
Total 1035 Average 90.5 6.78
REGION II State Number of dwellings
monitored Min
(Bq·m–3) Max
(Bq·m–3) Mean
(Bq·m–3) Std.
Deviation ()
12 Aguascalientes 90 77 115 101 7.33
13 Nayarit 90 48 80 75 6.25
14 Jalisco 90 57 110 97 7.56
15 Colima 80 47 74 69 7.12
16 Guanajuato 100 63 112 99 7.81
17 Michoacan 100 76 124 80 7.60
18 Queretaro 100 77 120 110 7.42
19 Hidalgo 80 67 109 97 6.93
20 Tlaxcala 80 72 97 87 6.91
21 Puebla 100 99 135 115 7.45
22 Estado de México 200 ** 57 103 87 5.91
23 Distrito Fed e ral 200 ** 59 130 85 6.12
Total 1310 Average 91.8 7.03
REGION III State Number of dwellings
monitored Min
(Bq·m–3) Max
(Bq·m–3) Mean
(Bq·m–3) Std.
Deviation ()
24 Morelos 93 48 103 74 6.23
25 Guerrero 89 45 97 70 7.12
26 Veracruz 95 42 78 65 6.05
27 Oaxaca 90 55 101 87 7.16
28 Tabasco 90 41 87 62 5.82
29 Chiapas 90 43 86 58 5.40
30 Campeche 90 41 79 55 5.50
31 Yucatan 95 37 81 51 5.37
32 Quintana Roo 90 48 77 69 5.51
Total 822 Average 65.7 6.02
** Densely-populated locations.
C
opyright © 2011 SciRes. JEP
An Indoor Radon Survey in Three Different Climate Regions in Mexico, and the Influence of
Climate in the Obtained Values
Copyright © 2011 SciRes. JEP
1147
mate and the associated ventilation habits are important
parameters to consider in the context of indoor radon
concentration surveys which include a large number of
measurements and cover large geographical areas.
indoor radon concentration, and hence no regional ave-
rage concentration, is above the USEPA recommended
action level of 148 Bq·m–3. These measured values are
surprising, being lower than the average in door radon
concentrations measured in other countries by other sur-
veys [2,15,16]. We hope that this experience can be of use to other
researchers who seek to carry out surveys of indoor ra-
don concentrations in other countries with climatologi-
cally and economic conditions similar to those of Mexico,
and contribute to an extension of the coverage of indoor
radon surveys at a worldwide level.
The frequency distribution of state average radon
concentrations is shown in Figure 2. It can be seen that
most states have mean indoor radon concentrations of
between 60 an d 100 Bq·m–3. Finally, we conclude that indoor radon concentration
levels do not change drastically over a period of ten years
in the absence of dramatic changes in climatic or geo-
graphical conditions.
Dose Calculation Results
Given the average indoor radon concentration and build-
ing occupancy rates, the WISE Uranium Project calcula-
tor allows the calculation of dose rates for individuals
exposed. The values used in these calculations are from
the ICRP-65 [7]. Table 3 shows values for the radiation
dose per hour and per year, and the health risk for an
individual exposed to radon and its decay products as-
suming the minimum and maximum radon concentra-
tions found in this survey, 37 Bq·m–3 and 179 Bq·m–3
respectively, and an 80% occupancy rate.
5. Acknowledgements
The authors wish to thank to J.I. Golzarri for his techni-
cal help. This work was partially supported by Oak Ridge
National Laboratory (managed by UT-Battelle Corp.)
and by PAPIIT-DGAPA-UNAM project 1N101910.
REFERENCES
4. Conclusions [1] United States Scientific Committee on the Effects on
Atomic Radiation (UNSCEAR), “Sources and Effects of
Ionizing Radiation,” United Nations, New York, 2000.
In general, the low average indoor radon concentrations
found mean that indoor radon poses a low health risk in
these areas. [2] J. C. Miles, “Mapping Radon Prone Areas by Log-Nor-
mal Modeling of House Data,” Health Physics, Vol. 74,
No. 3, 1998, pp. 370-378.
doi:10.1097/00004032-199803000-00010
An important purpose of this paper is to show that cli-
[3] United States Environmental Protection Agency
(USEPA), Environments Division (6609J), “A Citizen’s
Guide to Radon: The Guide to Protecting Yourself and
Your Family from Radon,” Washington DC 20460 US
EPA 402-K-02-006, 2004.
[4] J. J. Whicker and M. W. McNaughton, “Work to Save
Dose: Contrasting Effective Dose Rates from Radon Ex-
posure in Workplaces and Residences against the Back-
drop of Public and Occupational Regulatory Limits,”
Health Physics, Vol. 97, No. 3, 2009, pp. 248-256.
[5] World Health Organization (WHO), “Handbook on In-
door Radon, A Public Health Perspective,” 2009.
[6] International Atomic Energy Agency (IAEA), “Radiation
Protection against Radon in Workplaces Other than
Mines,” Safety Report Series, Vol. 33, 2003, pp. 11-12.
Figure 2. Frequency distribution of state mean indoor ra-
don levels. [7] International Commission on Radiological Protection
(ICRP), “Protection against Radon-222 at Home and
Work,” ICRP Publication 65, Pergamon Press, Oxford,
1994.
Table 3. Radiological risk assuming an 80% occupancy
time per year.
Radon concentration 37 Bq/m3 179 Bq/m3
Dose (per hour) 92.96 nSv/h 449.7 nSv/h
Dose (per year) 651.9 µSv/y
(0.163 WLM/y) 3.153 mSv/y
(0.788 WLM/y)
[8] N. Kavasi, T. Kovacs, C. Nemeth, T. Szabo, Z. Gorjanacs,
A. Varhegyi, J. Hakl and J. Somlai, “Difficulties in Ra-
don Measurements in Workplaces,” Radiation Measure-
ments, Vol. 41, No. 2, 2006, pp. 229-234.
doi:10.1016/j.radmeas.2005.02.001
An Indoor Radon Survey in Three Different Climate Regions in Mexico, and the Influence of
1148 Climate in the Obtained Values
[9] G. Akerblom, “Radon Legislation and National Guide-
lines Swedish Radiation Protection Institute,” SSI Report,
99-18, ISSN 0282-4434, 1999.
[10] G. Espinosa and R. B. Gammage, “Indoor Radon Con-
centration Survey in Mexico,” Journal of Radioanalytical
and Nuclear Chemistry, Vol. 236, 1998, pp. 227-229.
doi:10.1007/BF02386347
[11] G. Espinosa and R. B. Gammage, “Measurement Meth-
odology for Indoor Radon Using Passive Track Detec-
tor,” Applied Radiation and Isotopes, Vol. 44, No. 4,
1993, pp. 719-723. doi:10.1016/0969-8043(93)90138-Z
[12] G. Espinosa, J. I. Golzarri, J. Bogard, I. Gaso, G. Pon-
ciano, M. Mena and N. Segovia, “Indoor Radon Meas-
urements in Mexico City,” Radiation Measurements, Vol.
43, Suppl. 1, 2008, pp. 431-434.
doi:10.1016/j.radmeas.2008.03.039
[13] R. B. Gammage and G. Espinosa, “Digital Image System
for Track Measurements,” Radiation Measurements, Vol.
28, No. 1-6, 1997, pp. 835-838.
doi:10.1016/S1350-4487(97)00193-5
[14] M. Walchuk, “Speaking up about Radon,” Health Physics
News, Vol. XXXVIII, No. 4, 2010, pp. 1, 4-7.
[15] H. Arvela, H. Reisbacka and P. Keraenen, “Radon Pre-
vention and Mitigation in Finland: Guidance and Prac-
tice,” Proceedings of the American Association of Radon
Scientists and Technologists 2008, Las Vegas NV, 14-17
September 2008.
[16] H. Friedmann, “Final Results of the Austrian Radon Pro-
ject,” Health P hysics, Vol. 89, 2005, pp. 339-348.
C
opyright © 2011 SciRes. JEP