 American Journal of Anal yt ical Chemistry, 2011, 2, 757-767 doi:10.4236/ajac.2011.27087 Published Online November 2011 (http://www.SciRP.org/journal/ajac) Copyright © 2011 SciRes. AJAC Determination of Trace Amounts of Lead by Modified Graphite Furnace Atomic Absorption Spectrometry after Liquid Phase Microextraction with Pyrimidine-2-thiol Saeid Nazari1,2 1Department of Chemistry, Faculty of Science, Sabzevar Tarbiat Moallem University, Sabzevar, Iran 2Department of Chemistry, Quchan Branch, Islamic Azad University, Quchan, Iran E-mail: nazari@chemist.com, nazari@sttu.ac.ir Received December 18, 2010; revised February 3, 2011; accepted February 11, 2011 Abstract The liquid phase microextraction (LPME) was combined with the modified Graphite furnace atomic absorp- tion spectrometry (GF-AAS) for determination of lead in the water and solid samples. In a preconcentration step, lead was extracted from a 2 ml of its aqueous sample in the pH = 5 as lead-Pyrimidine-2-thiol cationic complex into a 4 µl drop of 1,2 dichloroethane and ammonium tetraphenylborate as counter ion immersed in the solution. In the drop, the lead-Pyrimidine-2-thiol ammonium tetraphenylborate ion associated complex was formed. After extraction, the microdrop was retracted and directly transferred into a graphite tube modi- fied by [W.Pd.Mg] (c). Some effective parameters on extraction and complex formation, such as type and volume of organic solvent, pH, concentration of chelating agent and counter ion, extraction time, stirring rate and effect of salt were optimized. Under the optimum conditions, the enrichment factor and recovery were 525% and 94%, respectively. The calibration graph was linear in the range of 0.01 - 12 µg·L–1 with correla- tion coefficient of 0.9975 under the optimum conditions of the recommended procedure. The detection limit based on the 3Sb criterion was 0.0072 µg·L–1 and relative standard deviation (RSD) for ten replicate meas- urement of 0.1 µg·L–1 and 0.4 µg·L–1 lead was 4.5% and 3.8% respectively. The characteristic concentration was 0.0065 µg·L–1 equivalent to a characteristic mass of 26 fg. The results for determination of lead in refer- ence materials, spiked tap water and seawater demonstrated the accuracy, recovery and applicability of the presented method. Keywords: Lead, Liquid Phase Microextraction, Preconcentration, Graphite Furnace Atomic Absorption Spectrometry 1. Introduction Lead is one of the most ubiquitous elements in the envi- ronment and is recognized as a major health risk to hu- mans and animals [1,2]. Lead is a serious cumulative body poison [3] which enters our body system through air, water, and food. Inorganic lead binds itself with the SH group in enzymes or proteins and acts as an enzyme inhibitor [4]. Acute lead poisoning in humans causes severe damage in the kidneys, liver, brain, reproductive system and central nervous system, and even causes death. Mild lead poisoning causes anemia, headache and sore muscles and the victim may feel fatigued and irrita- ble. Chronic exposure to lead causes nephritis, scaring and the shrinking of kidney tissues [5]. It is emitted into the biosphere in considerable amounts, owing to its in- creased industrial use and its application as a fuel addi- tive [6,7]. In recent years, concern has increased over the concentration of lead in drinking and natural waters [8]. A variety of techniques such as inductively coupled plasma mass spectrometry (ICP-MS) [9], ICP-atomic spectrometry [10,11], electrothermal atomic absorption spectrometry [12] and flame atomic absorption spec- trometry (FAAS) [13-16] has been widely used for the determination of trace metal in different samples. Monitoring trace element concentrations in biological  S. NAZARI 758 materials, particularly biological fluids, might be consid- ered a difficult analytical task, mostly due to the com- plexity of the matrix and the low concentration of these elements, which requires sensitive instrumental tech- niques and often a preconcentration step. The most widely used techniques for separation and preconcentra- tion of trace lead include liquid–liquid extraction [17], cloud point extraction [18,19], solid phase extraction [20-24] and electrochemical deposition [25], etc. The solvent microextrction technique effectively overcomes these difficulties by reducing the amount of organic sol- vent and by allowing sample extraction and preconcen- tration to be done in a single step. The technique is faster and simpler than conventional methods. It is also inex- pensive, sensitive and effective for the removal of inter- fering matrices. Solvent microextraction is a form of solvent extraction with phase ratio values higher than 100 [26-30]. This technique uses simple equipment which is found in most analytical laboratories and also has been used for sample preparation of organic compo- nents and has coupled with chromatography methods. We developed this technique in our laboratory and re- ported for the first time on the coupling of liquid phase microextraction (LPME) with spectrometry to determine inorganic compounds. Using this technique, arsenic in a variety of samples was determined [33]. In this paper, we describe a new and extremely high sensitive method for extraction and determination of lead in aqueous samples by liquid phase microextraction com- bined with a graphite furnace atomic absorption spec- trometry (LPME-GF-AAS). The results indicate that the LPME is an efficient extraction technique for analyzing lead in real samples, with very high pre-concentration fac- tor, greatly increased sensitivity and low detection limit. The method is very simple and quick so that the overall time of extraction and determination for each sample is 8 minutes. 2. Experimental 2.1. Instrumentation A Shimadzu model AA-6300G atomic absorption spec- trometer (Kyoto, Japan) with GFA-EX7i graphite furnace atomizer and D2 lamp for background correction was used. A lead hollow cathode lamp (Hamamatsu photon- ics, Kyoto, Japan) was used as the radiation source ad- justed at the operating current at the wavelength of 283.3 nm with 0.4 nm spectral bandpass. All measurements were performed using peak height and gas stop mode. The measurement conditions are given in Table 1. All pH measurements were made by a Metrohm digital pH meter (model: 691, Herisua, Switzerland) with a com- bined glass electrode. A 10 µl Hamilton 7105 syringe (Hamilton, Reno, NV, USA) was used to suspend the drop of the acceptor phase and to inject it into the graphite furnace atomizer. Sam- ples were stirred in 10 ml flat-bottom vial containing Teflon-line septa using an electronic magnetic stirrer (VWR Scientific, West Chester, PA, USA). Table 1. Applied conditions for lead determination with GFA system. Optimum analytical conditions Lamp current 4 mA Wavelength 228.8 nm Spectral bandwidth 0.5 nm Spectral bandwidth peak height Purge gas Ar Back ground correction D2 GFA heating programme Stage Furnace temperature/˚C Mode Time/s Ar flow rate/L·min–1 Drying 150 ramp 15 1.5 Ashing 400 step 15 1.5 Atomization 1800 step 3 gas stop Clean up 2500 step 2 1.5 Copyright © 2011 SciRes. AJAC  759 S. NAZARI 2.2. Reagents All reagents used were at least of analytical grade. Water was deionizer to a resistivity of 18 MΩ cm in a Milli-Q system (Millipore, Bedford, MA, USA). A lead stock solution (1000 mg·L–1 Pb) was prepared dissolving high- purity Pb(NO3)2 (SPEX, Eddison, NJ, USA).Working solutions were prepared daily in 1% (v/v) HNO3 by proper dilution of the stock solution. The extraction organic phase was 1,2 dichloroethane (Merck, Darmstadt, Ger- many). 3.0% (m/v) Pyrimidine-2-thiol (Merck, Darmstadt, Germany) in ethanol was used as a complexing agent and 1.5% (m/v) ammonium tetraphenylborate (Merck, Darm- stadt, Germany) in 1,2 dichloroethane was used as counter ion. Modifiers of 0.1% (m/v) Pd in HCl 2% (v/v), 0.1% (m/v) W, 10% (m/v) Mg in water were used. 2.3. Extraction Procedure Two ml of lead solution was adjusted at pH = 5 and treated with 0.5 ml of 3.0% (m/v) Pyrimidine-2-thiol was transferred to a 10 ml vial. Lead formed a cationic com- plex with Pyrimidine-2-thiol in aqueous solution. The solution was stirred by magnetic stirrer with a 6 mm stir bar at optimized speed 600 rpm. A 4 µl of 1,2 dichloro- ethane and ammonium tetraphenylborate as counter ion was taken by the Hamilton syringe whose needle was used to pierce the vial septum. The syringe was clamped in such a way that the tip of the needle was located at a fixed position in the sample solution as shown in Figure 1. The syringe plunger was depressed to expose the drop and the stirring commenced. In the drop, the Pb-Py- rimidine-2-thiol ammonium tetraphenylborate ion asso- ciated complex was formed. The Pb-Pyrimidine-2-thiol cationic complex was extracted from aqueous solution into the 1,2 dichloroethane as extraction organic phase and formed ion associated complex with ammonium tetraphenylborate as counter ion. After the extraction, the microdrop was retracted and directly injected into the graphite furnace tube modified with [W.Pd.Mg] (c) for subsequent determinations. The different parameters affecting the technique such as sol- vent, pH, stirring rate, time of extraction, concentration of Pyrimidine-2-thiol and ammonium tetraphenylborate were optimized. 2.4. Tube Modification Mg modifier was used by injecting 0.2% Mg and sample solution with equal volumes. [(W.Pd) (c) + Pd(i)] modi- fiers were used for coating containing 40 µg of each of W and Pd from 0.1% of their solutions at temperatures of 2300˚C and 2100˚C respectively and injecting 10 µl of 0.1% (m/v) Pd on top of 10 µl sample solution (without extraction). [Pd(c) + Pd(i)] modifier was used as coating of 60 µg Pd onto the graphite tube at 1800˚C and inject- ing of 10 µl solution of 0.1% (m/v) Pd on top of 10 µl of sample solution. [W.Pd.Mg] (c) modifier was used as coating of 40 µg of each of W, Pd and Mg solution at the appropriate temperatures. Added of pyrimidine-2-thiol to lead solution in direct injection without preconcentration step has not any effect on the signal. 3. Results and Discussion In order to obtain a high enrichment factor, the effect of different parameters affecting the complex formation and extraction conditions such as type and volume of organic solvent, pH, concentration of chelating agent and counter ion, extraction time and stirring rate were optimized. One variable at a time optimization was used to obtain opti- mum conditions for liquid phase microextraction (LPME) procedure. Enrichment factor is defined as the ratio of concentra- tion of lead in the microdrop phase to concentration of lead in the aqueous sample. Concentration of lead in the microdrop phase was calculated from the calibration graph obtained by direct injection of lead into the modi- fied graphite furnace tube without any preconcentration (by compare absorbance of direct injection and after preconcentration). Addition of complexing agent to the lead solution in direct injection without preconcentration step did not any effect on the signal. 3.1. Effect of Type of Modifiers Several modifiers containing Pd, Ru, Rh, Ir, V, Mo, W, Ni, Mg, Ascorbic acid, separately or in their combina- tions, were tested. The results of best performing modifi- ers are shown in Table 2. [W.Pd.Mg] (c) modifier showed the best results in contrast to [(W.Pd) (c) + Pd (i)] and [Pd (c) + Pd (i)] for direct determination of lead. Figure 1. The schematic setup for liquid phase microextrac- tion. Copyright © 2011 SciRes. AJAC  S. NAZARI 760 3.2. Effect of Type and Volume of the Extraction Solvent The choice of organic solvent used in LPME was a major consideration. In order to promote analyte transferring from the donor solution through the organic phase to the accepter microdrop, the solubility of the neutral analytes in the organic solvent should be higher than that in the donor solution and simultaneously the solubility of ionic analytes should be lower than that in the accepter phase. Effect of five different solvents, carbon tetrachloride, dichloromethane, 1,2 dichloroethane, nitrobenzene and benzyl alcohol was evaluated for the of 2 ml lead solu- tion with concentration of 0.1 µg·L–1. The results are given in Figure 2. 1,2 dichloroethane was found to pro- vide higher extraction efficiency. This may be attributed to middle polarity of 1,2 dichloroethane, which leads to the higher solubility of the polar Pb-Pyrimidine-2-thiol cationic complex and hence higher extraction efficiency. The influence of drop size was investigated in the range of 1 - 4 µl. It was found that the absorbance in- creases with drop volume in the range of 1 - 4 µl. When drop size exceeded 4 µl, it became too unstable to be suspended at the needle tip. For this reason, 4 µl drop volume was used for further studies. 3.3. Effect of Extraction Time Extraction time is one of the most important factors in the most of extraction procedures. LPME is a type of equilibrium extraction, and the optimal extraction effi- ciency is obtained when equilibrium is established. There- fore, the extraction time plays a very essential role in the whole process. The dependence of extraction efficiency Table 2. Analytical figures of merit for lead determination using different chemical modifiers. Chemical modifier Detectiona limit (µg·L–1) Sensitivityb (µg·L–1) Linear range (µg·L–1) RSD %c Mg (i) Ni (i) 0.14 0.18 0.038 0.042 0.28 - 44 0.25 - 29 6.2 5.8 [(W.Rh) (c) + Rh (i)] 0.11 0.05 0.31 - 38 4.6 [Pd (c) + Pd (i)] 0.081 0.032 0.30 - 39 5.1 [W.Pd.Mg] (c) 0.074 0.026 0.22 - 3 3.8 a: Based on 3Sb; b: Calculated by dividing 0.0044 to the slope of calibration curve; c: For 10 replicated analysis of 0.1 µg·L–1 lead. Figure 2. Effect of type of extraction solvent on the absorbance obtained from LPME. Copyright © 2011 SciRes. AJAC 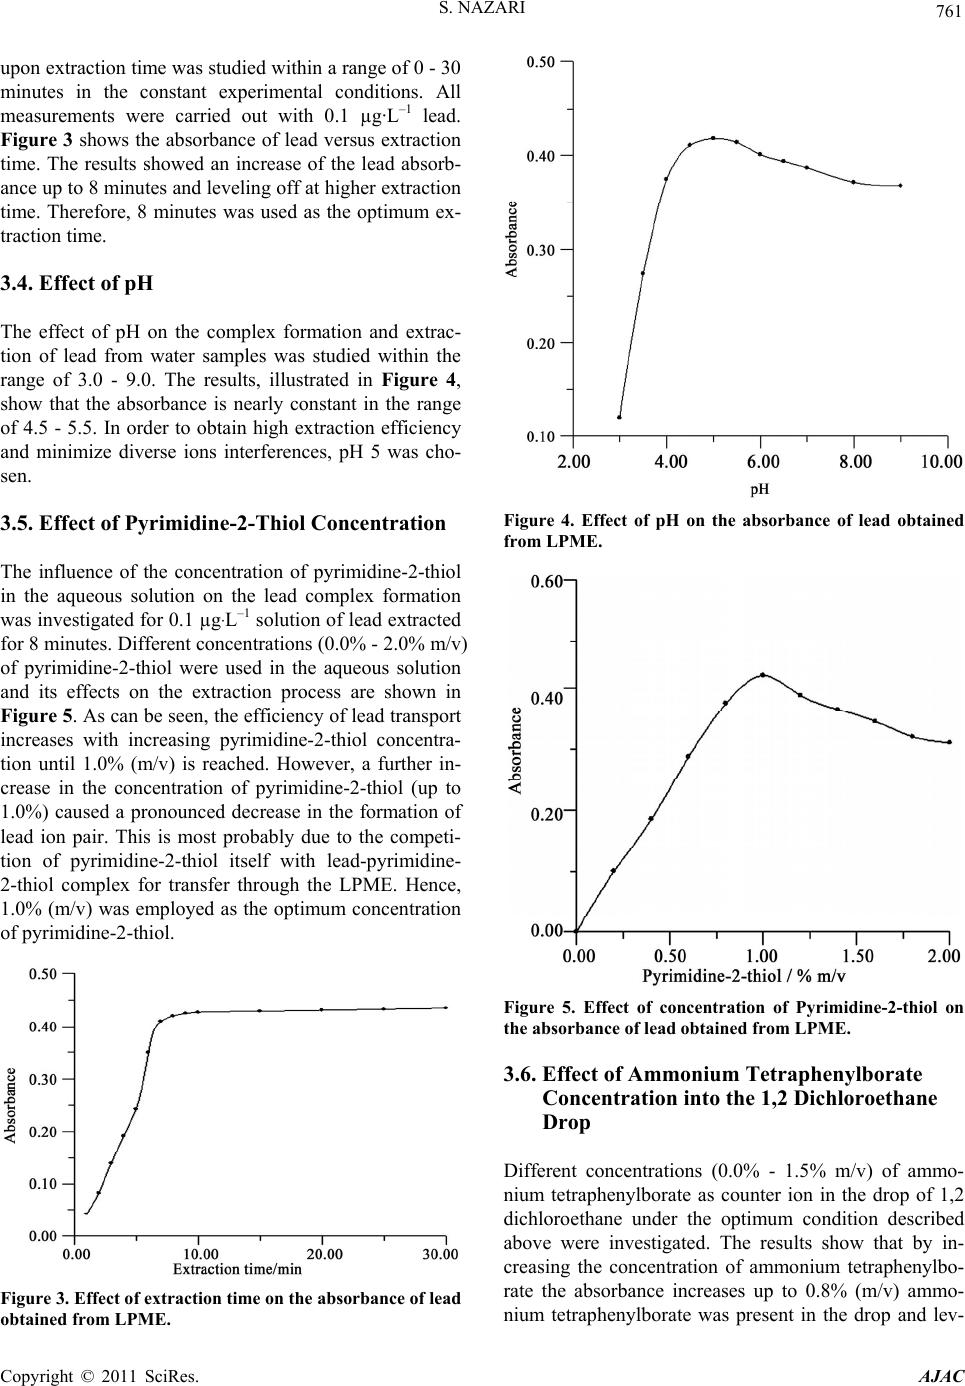 761 S. NAZARI upon extraction time was studied within a range of 0 - 30 minutes in the constant experimental conditions. All measurements were carried out with 0.1 µg·L–1 lead. Figure 3 shows the absorbance of lead versus extraction time. The results showed an increase of the lead absorb- ance up to 8 minutes and leveling off at higher extraction time. Therefore, 8 minutes was used as the optimum ex- traction time. 3.4. Effect of pH The effect of pH on the complex formation and extrac- tion of lead from water samples was studied within the range of 3.0 - 9.0. The results, illustrated in Figure 4, show that the absorbance is nearly constant in the range of 4.5 - 5.5. In order to obtain high extraction efficiency and minimize diverse ions interferences, pH 5 was cho- sen. 3.5. Effect of Pyrimidine-2-Thiol Concentration The influence of the concentration of pyrimidine-2-thiol in the aqueous solution on the lead complex formation was investigated for 0.1 µg·L–1 solution of lead extracted for 8 minutes. Different concentrations (0.0% - 2.0% m/v) of pyrimidine-2-thiol were used in the aqueous solution and its effects on the extraction process are shown in Figure 5. As can be seen, the efficiency of lead transport increases with increasing pyrimidine-2-thiol concentra- tion until 1.0% (m/v) is reached. However, a further in- crease in the concentration of pyrimidine-2-thiol (up to 1.0%) caused a pronounced decrease in the formation of lead ion pair. This is most probably due to the competi- tion of pyrimidine-2-thiol itself with lead-pyrimidine- 2-thiol complex for transfer through the LPME. Hence, 1.0% (m/v) was employed as the optimum concentration of pyrimidine-2-thiol. Figure 3. Effect of extraction time on the absorbance of lead obtained from LPME. Figure 4. Effect of pH on the absorbance of lead obtained from LPME. Figure 5. Effect of concentration of Pyrimidine-2-thiol on the absorbance of lead obtained from LPME. 3.6. Effect of Ammonium Tetraphenylborate Concentration into the 1,2 Dichloroethane Drop Different concentrations (0.0% - 1.5% m/v) of ammo- nium tetraphenylborate as counter ion in the drop of 1,2 dichloroethane under the optimum condition described above were investigated. The results show that by in- creasing the concentration of ammonium tetraphenylbo- rate the absorbance increases up to 0.8% (m/v) ammo- nium tetraphenylborate was present in the drop and lev- Copyright © 2011 SciRes. AJAC 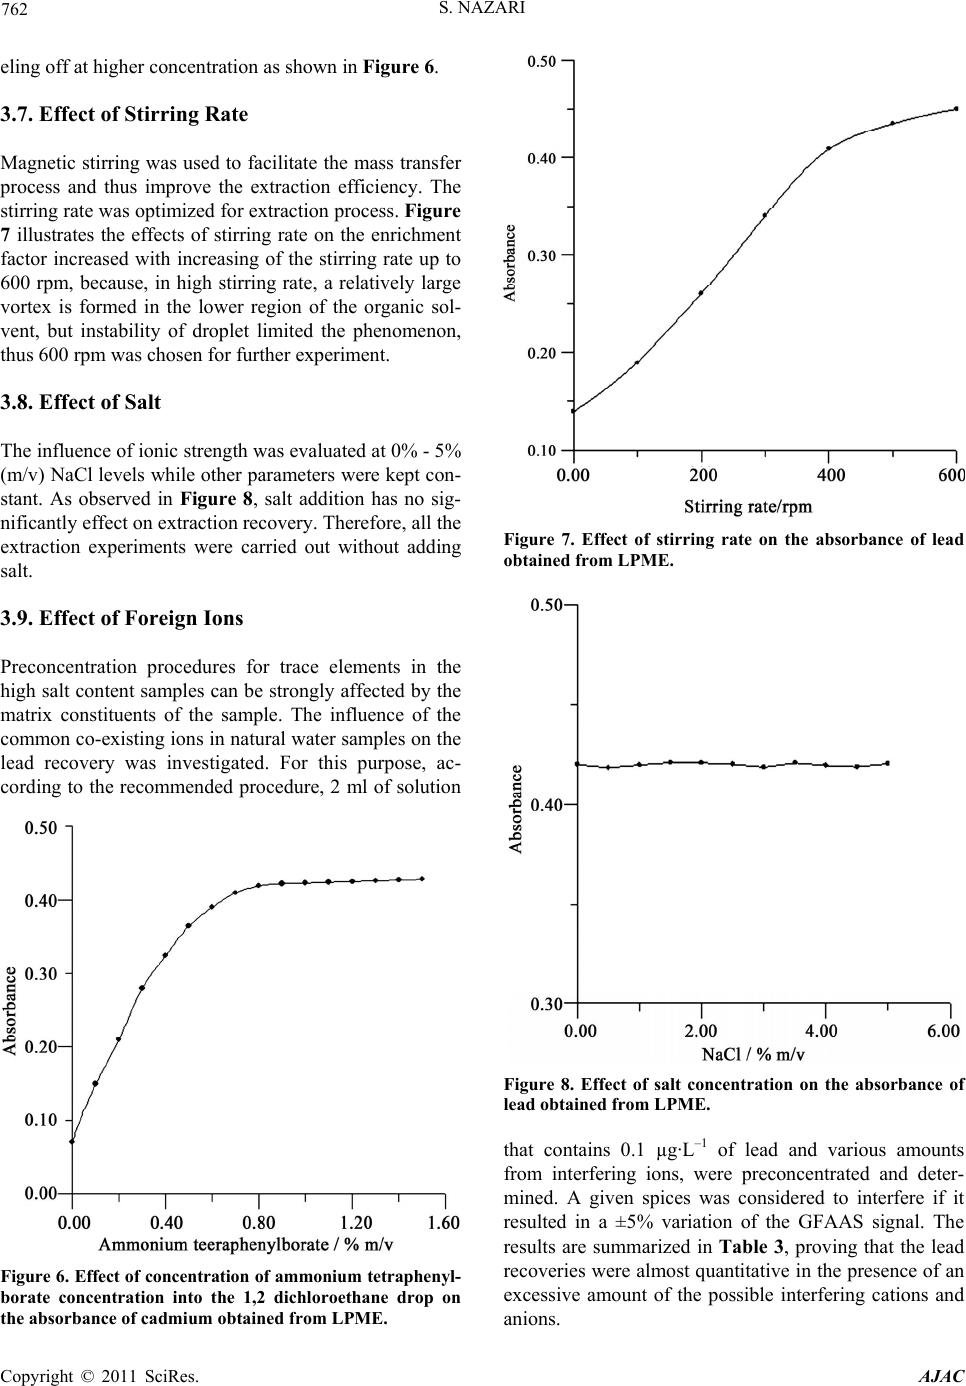 S. NAZARI 762 eling off at higher concentration as shown in Figure 6. 3.7. Effect of Stirring Rate Magnetic stirring was used to facilitate the mass transfer process and thus improve the extraction efficiency. The stirring rate was optimized for extraction process. Figure 7 illustrates the effects of stirring rate on the enrichment factor increased with increasing of the stirring rate up to 600 rpm, because, in high stirring rate, a relatively large vortex is formed in the lower region of the organic sol- vent, but instability of droplet limited the phenomenon, thus 600 rpm was chosen for further experiment. 3.8. Effect of Salt The influence of ionic strength was evaluated at 0% - 5% (m/v) NaCl levels while other parameters were kept con- stant. As observed in Figure 8, salt addition has no sig- nificantly effect on extraction recovery. Therefore, all the extraction experiments were carried out without adding salt. 3.9. Effect of Foreign Ions Preconcentration procedures for trace elements in the high salt content samples can be strongly affected by the matrix constituents of the sample. The influence of the common co-existing ions in natural water samples on the lead recovery was investigated. For this purpose, ac- cording to the recommended procedure, 2 ml of solution Figure 6. Effect of concentration of ammonium tetraphenyl- borate concentration into the 1,2 dichloroethane drop on the absorbance of cadmium obtained from LPME. Figure 7. Effect of stirring rate on the absorbance of lead obtained from LPME. Figure 8. Effect of salt concentration on the absorbance of lead obtained from LPME. that contains 0.1 µg·L–1 of lead and various amounts from interfering ions, were preconcentrated and deter- mined. A given spices was considered to interfere if it resulted in a ±5% variation of the GFAAS signal. The results are summarized in Table 3, proving that the lead recoveries were almost quantitative in the presence of an excessive amount of the possible interfering cations and anions. Copyright © 2011 SciRes. AJAC 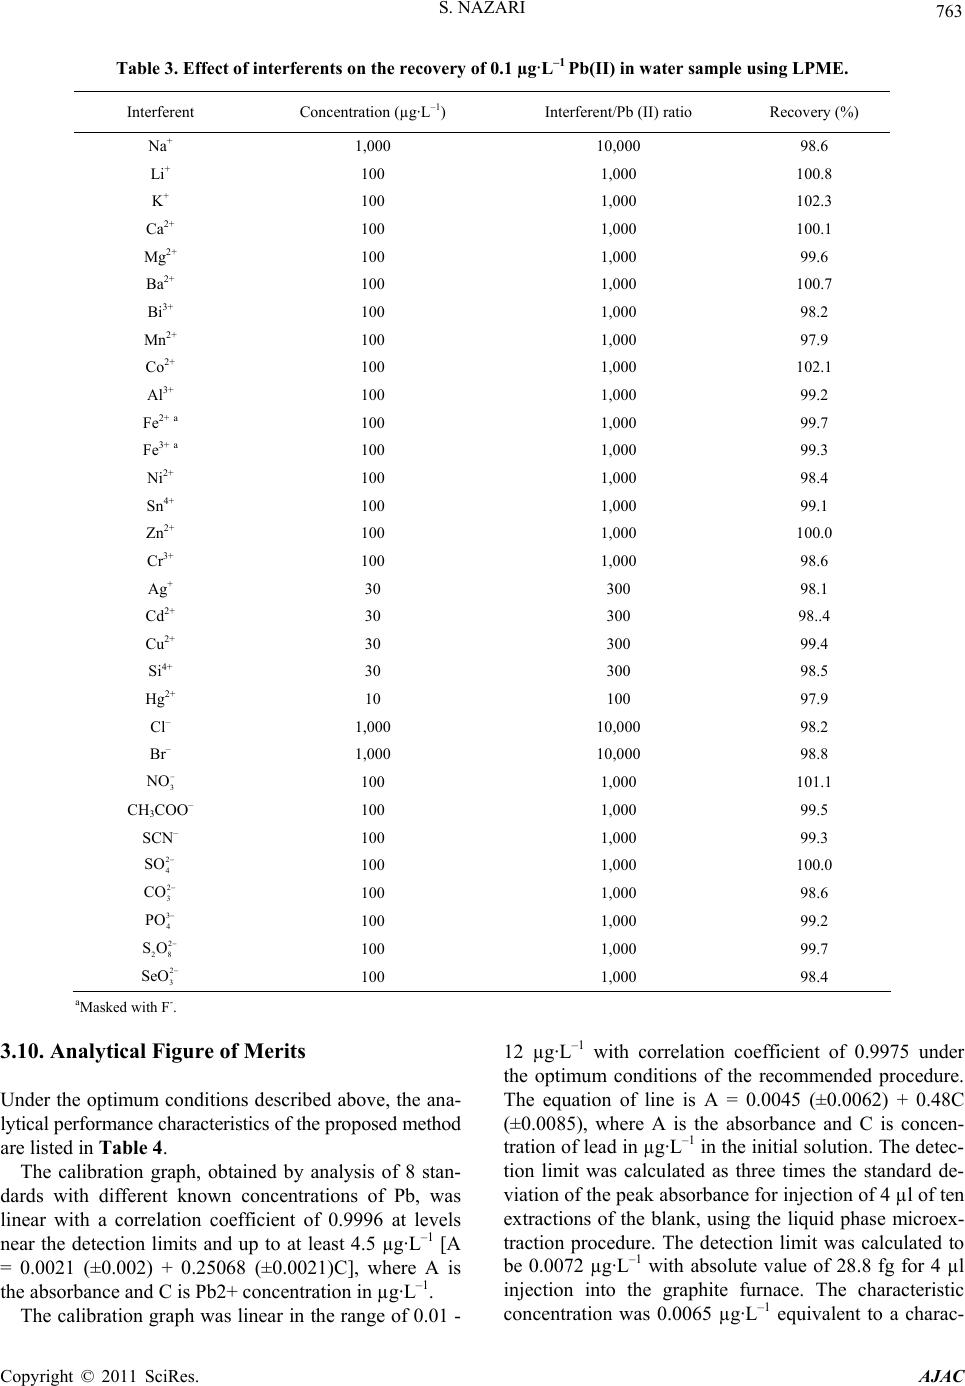 S. NAZARI Copyright © 2011 SciRes. AJAC 763 Table 3. Effect of interferents on the recovery of 0.1 µg·L–1 Pb(II) in water sample using LPME. Interferent Concentration (µg·L–1) Interferent/Pb (II) ratio Recovery (%) Na+ 1,000 10,000 98.6 Li+ 100 1,000 100.8 K+ 100 1,000 102.3 Ca2+ 100 1,000 100.1 Mg2+ 100 1,000 99.6 Ba2+ 100 1,000 100.7 Bi3+ 100 1,000 98.2 Mn2+ 100 1,000 97.9 Co2+ 100 1,000 102.1 Al3+ 100 1,000 99.2 Fe2+ a 100 1,000 99.7 Fe3+ a 100 1,000 99.3 Ni2+ 100 1,000 98.4 Sn4+ 100 1,000 99.1 Zn2+ 100 1,000 100.0 Cr3+ 100 1,000 98.6 Ag+ 30 300 98.1 Cd2+ 30 300 98..4 Cu2+ 30 300 99.4 Si4+ 30 300 98.5 Hg2+ 10 100 97.9 Cl– 1,000 10,000 98.2 Br– 1,000 10,000 98.8 3 NO 100 1,000 101.1 CH3COO– 100 1,000 99.5 SCN– 100 1,000 99.3 2 4 SO 100 1,000 100.0 2 3 CO 3 100 1,000 98.6 4 PO 2 100 1,000 99.2 28 SO 2 100 1,000 99.7 3 SeO 100 1,000 98.4 aMasked with F-. 3.10. Analytical Figure of Merits Under the optimum conditions described above, the ana- lytical performance characteristics of the proposed method are listed in Table 4. The calibration graph, obtained by analysis of 8 stan- dards with different known concentrations of Pb, was linear with a correlation coefficient of 0.9996 at levels near the detection limits and up to at least 4.5 µg·L–1 [A = 0.0021 (±0.002) + 0.25068 (±0.0021)C], where A is the absorbance and C is Pb2+ concentration in µg·L–1. The calibration graph was linear in the range of 0.01 - 12 µg·L–1 with correlation coefficient of 0.9975 under the optimum conditions of the recommended procedure. The equation of line is A = 0.0045 (±0.0062) + 0.48C (±0.0085), where A is the absorbance and C is concen- tration of lead in µg·L–1 in the initial solution. The detec- tion limit was calculated as three times the standard de- viation of the peak absorbance for injection of 4 µl of ten extractions of the blank, using the liquid phase microex- traction procedure. The detection limit was calculated to be 0.0072 µg·L–1 with absolute value of 28.8 fg for 4 µl injection into the graphite furnace. The characteristic concentration was 0.0065 µg·L–1 equivalent to a charac- 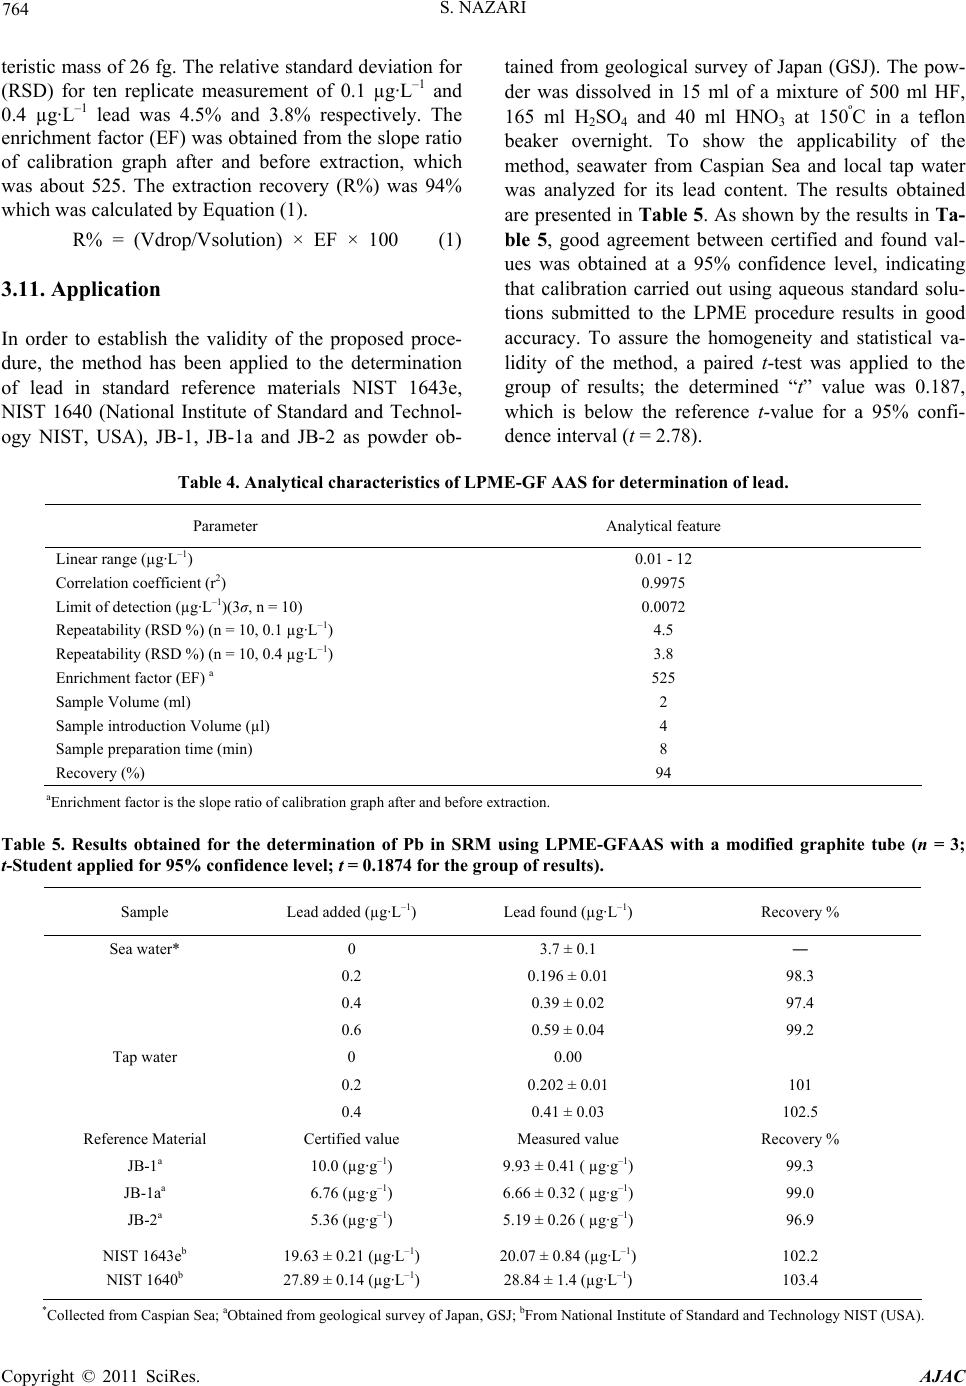 S. NAZARI 764 teristic mass of 26 fg. The relative standard deviation for (RSD) for ten replicate measurement of 0.1 µg·L–1 and 0.4 µg·L–1 lead was 4.5% and 3.8% respectively. The enrichment factor (EF) was obtained from the slope ratio of calibration graph after and before extraction, which was about 525. The extraction recovery (R%) was 94% which was calculated by Equation (1). R% = (Vdrop/Vsolution) × EF × 100 (1) 3.11. Application In order to establish the validity of the proposed proce- dure, the method has been applied to the determination of lead in standard reference materials NIST 1643e, NIST 1640 (National Institute of Standard and Technol- ogy NIST, USA), JB-1, JB-1a and JB-2 as powder ob- tained from geological survey of Japan (GSJ). The pow- der was dissolved in 15 ml of a mixture of 500 ml HF, 165 ml H2SO4 and 40 ml HNO3 at 150ºC in a teflon beaker overnight. To show the applicability of the method, seawater from Caspian Sea and local tap water was analyzed for its lead content. The results obtained are presented in Table 5. As shown by the results in Ta- ble 5, good agreement between certified and found val- ues was obtained at a 95% confidence level, indicating that calibration carried out using aqueous standard solu- tions submitted to the LPME procedure results in good accuracy. To assure the homogeneity and statistical va- lidity of the method, a paired t-test was applied to the group of results; the determined “t” value was 0.187, which is below the reference t-value for a 95% confi- dence interval (t = 2.78). Table 4. Analytical characteristics of LPME-GF AAS for determination of lead. Parameter Analytical feature Linear range (µg·L–1) 0.01 - 12 Correlation coefficient (r2) 0.9975 Limit of detection (µg·L–1)(3σ, n = 10) 0.0072 Repeatability (RSD %) (n = 10, 0.1 µg·L–1) 4.5 Repeatability (RSD %) (n = 10, 0.4 µg·L–1) 3.8 Enrichment factor (EF) a 525 Sample Volume (ml) 2 Sample introduction Volume (µl) 4 Sample preparation time (min) 8 Recovery (%) 94 aEnrichment factor is the slope ratio of calibration graph after and before extraction. Table 5. Results obtained for the determination of Pb in SRM using LPME-GFAAS with a modified graphite tube (n = 3; t-Student applied for 95% confidence le vel; t = 0.1874 for the group of results). Sample Lead added (µg·L–1) Lead found (µg·L–1) Recovery % Sea water* 0 3.7 ± 0.1 ― 0.2 0.196 ± 0.01 98.3 0.4 0.39 ± 0.02 97.4 0.6 0.59 ± 0.04 99.2 Tap water 0 0.00 0.2 0.202 ± 0.01 101 0.4 0.41 ± 0.03 102.5 Reference Material Certified value Measured value Recovery % JB-1a 10.0 (µg·g–1) 9.93 ± 0.41 ( µg·g–1) 99.3 JB-1aa 6.76 (µg·g–1) 6.66 ± 0.32 ( µg·g–1) 99.0 JB-2a 5.36 (µg·g–1) 5.19 ± 0.26 ( µg·g–1) 96.9 NIST 1643eb NIST 1640b 19.63 ± 0.21 (µg·L–1) 27.89 ± 0.14 (µg·L–1) 20.07 ± 0.84 (µg·L–1) 28.84 ± 1.4 (µg·L–1) 102.2 103.4 *Collected from Caspian Sea; aObtained from geological survey of Japan, GSJ; bFrom National Institute of Standard and Technology NIST (USA). Copyright © 2011 SciRes. AJAC 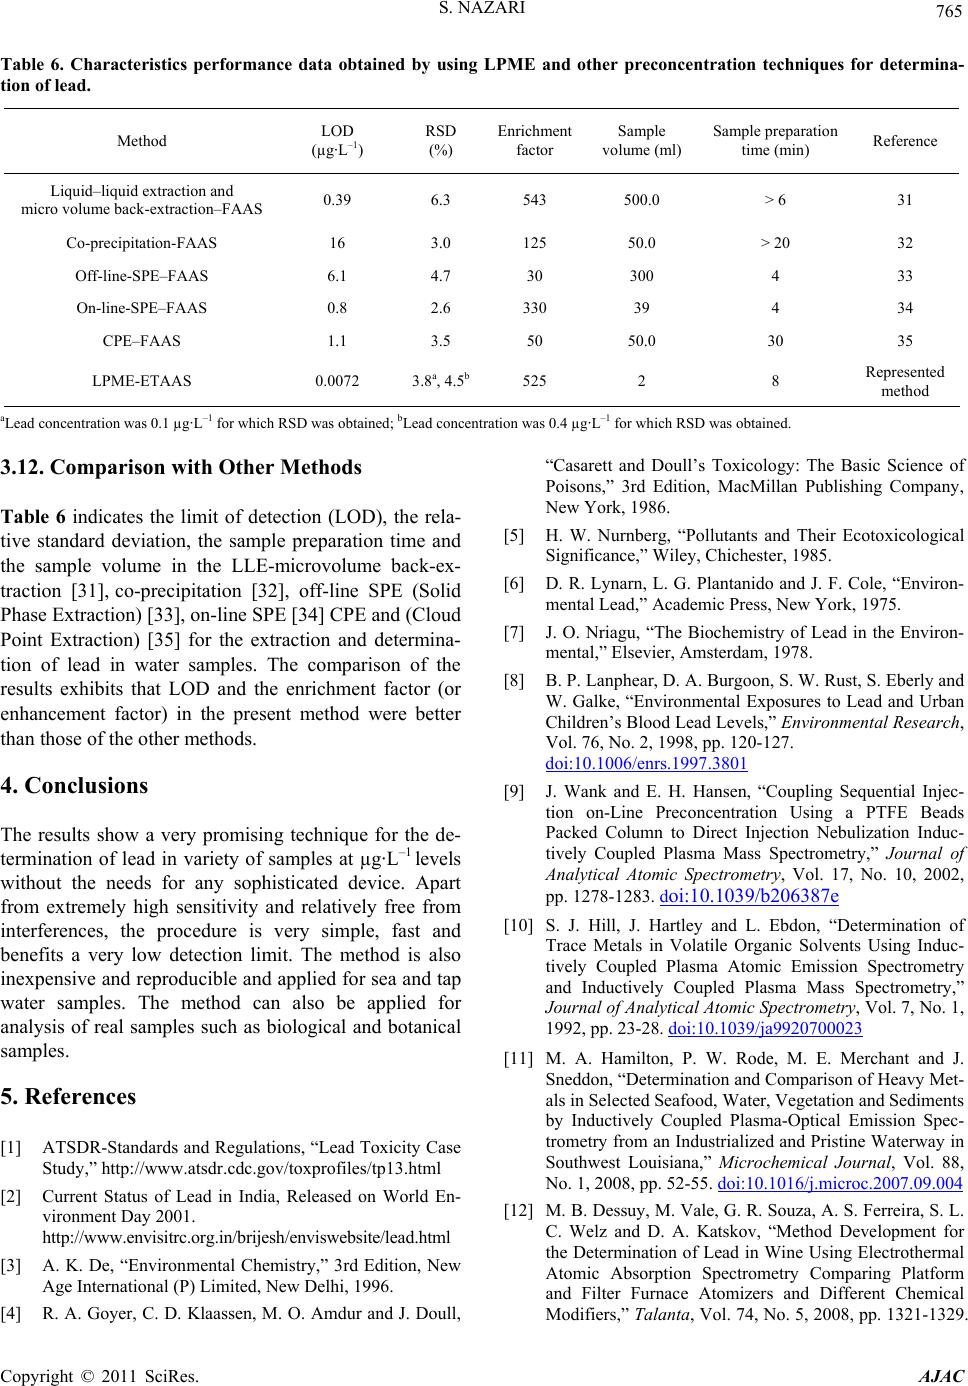 765 S. NAZARI Table 6. Characteristics performance data obtained by using LPME and other preconcentration techniques for determina- tion of lead. LOD Reference Sample preparation time (min) Sample volume (ml) Enrichment factor RSD (%) (µg·L–1) Method 31 > 6 500.0 543 6.3 0.39 Liquid–liquid extraction and micro volume back-extraction–FAAS 32 > 20 50.0 125 3.0 16 Co-precipitation-FAAS 33 4 300 30 4.7 6.1 Off-line-SPE–FAAS 34 4 39 330 2.6 0.8 On-line-SPE–FAAS 35 30 50.0 50 3.5 1.1 CPE–FAAS Represented method 8 2 525 3.8a, 4.5b 0.0072 LPME-ETAAS aLead concentration was 0.1 µg·L–1 for which RSD was obtained; bLead concentration was 0.4 µg·L–1 for which RSD was obtained. 3.12. Comparison with Other Methods Table 6 indicates the limit of detection (LOD), the rela- tive standard deviation, the sample preparation time and the sample volume in the LLE-microvolume back-ex- traction [31], co-precipitation [32], off-line SPE (Solid Phase Extraction) [33], on-line SPE [34] CPE and (Cloud Point Extraction) [35] for the extraction and determina- tion of lead in water samples. The comparison of the results exhibits that LOD and the enrichment factor (or enhancement factor) in the present method were better than those of the other methods. 4. Conclusions The results show a very promising technique for the de- termination of lead in variety of samples at µg·L–1 levels without the needs for any sophisticated device. Apart from extremely high sensitivity and relatively free from interferences, the procedure is very simple, fast and benefits a very low detection limit. The method is also inexpensive and reproducible and applied for sea and tap water samples. The method can also be applied for analysis of real samples such as biological and botanical samples. 5. References [1] ATSDR-Standards and Regulations, “Lead Toxicity Case Study,” http://www.atsdr.cdc.gov/toxprofiles/tp13.html [2] Current Status of Lead in India, Released on World En- vironment Day 2001. http://www.envisitrc.org.in/brijesh/enviswebsite/lead.html [3] A. K. De, “Environmental Chemistry,” 3rd Edition, New Age International (P) Limited, New Delhi, 1996. [4] R. A. Goyer, C. D. Klaassen, M. O. Amdur and J. Doull, “Casarett and Doull’s Toxicology: The Basic Science of Poisons,” 3rd Edition, MacMillan Publishing Company, New York, 1986. [5] H. W. Nurnberg, “Pollutants and Their Ecotoxicological Significance,” Wiley, Chichester, 1985. [6] D. R. Lynarn, L. G. Plantanido and J. F. Cole, “Environ- mental Lead,” Academic Press, New York, 1975. [7] J. O. Nriagu, “The Biochemistry of Lead in the Environ- mental,” Elsevier, Amsterdam, 1978. [8] B. P. Lanphear, D. A. Burgoon, S. W. Rust, S. Eberly and W. Galke, “Environmental Exposures to Lead and Urban Children’s Blood Lead Levels,” Environmental Research, Vol. 76, No. 2, 1998, pp. 120-127. doi:10.1006/enrs.1997.3801 [9] J. Wank and E. H. Hansen, “Coupling Sequential Injec- tion on-Line Preconcentration Using a PTFE Beads Packed Column to Direct Injection Nebulization Induc- tively Coupled Plasma Mass Spectrometry,” Journal of Analytical Atomic Spectrometry, Vol. 17, No. 10, 2002, pp. 1278-1283. doi:10.1039/b206387e [10] S. J. Hill, J. Hartley and L. Ebdon, “Determination of Trace Metals in Volatile Organic Solvents Using Induc- tively Coupled Plasma Atomic Emission Spectrometry and Inductively Coupled Plasma Mass Spectrometry,” Journal of Analytical Atomic Spectrometry, Vol. 7, No. 1, 1992, pp. 23-28. doi:10.1039/ja9920700023 [11] M. A. Hamilton, P. W. Rode, M. E. Merchant and J. Sneddon, “Determination and Comparison of Heavy Met- als in Selected Seafood, Water, Vegetation and Sediments by Inductively Coupled Plasma-Optical Emission Spec- trometry from an Industrialized and Pristine Waterway in Southwest Louisiana,” Microchemical Journal, Vol. 88, No. 1, 2008, pp. 52-55. doi:10.1016/j.microc.2007.09.004 [12] M. B. Dessuy, M. Vale, G. R. Souza, A. S. Ferreira, S. L. C. Welz and D. A. Katskov, “Method Development for the Determination of Lead in Wine Using Electrothermal Atomic Absorption Spectrometry Comparing Platform and Filter Furnace Atomizers and Different Chemical Modifiers,” Talanta, Vol. 74, No. 5, 2008, pp. 1321-1329. Copyright © 2011 SciRes. AJAC  S. NAZARI 766 doi:10.1016/j.talanta.2007.08.048 [13] L. Narin, M. Soylak, L. Elici and M. Dogan, “Determina- tion of Trace Metal Ions by AAS in Natural Water Sam- ples after Preconcentration of Pyrocatechol Violet Com- plexes on an Activated Carbon Column,” Talanta, Vol. 52, No. 6, 2000, pp. 1041-1046. doi:10.1016/S0039-9140(00)00468-9 [14] M. Ghaedi, K. Niknam, A. Shokrollahi, E. Niknama, H. R. Rajabi and M. Soylak, “Flame Atomic Absorption Spectrometric Determination of Trace Amounts of Heavy Metal Ions after Solid Phase Extraction Using Modified Sodium Dodecyl Sulfate Coated on Alumina,” Journal of Hazardous Materials, Vol. 155, No. 1-2, 2008, pp. 121- 127. doi:10.1016/j.jhazmat.2007.11.038 [15] M. Ghaedi, F. Ahmadi and A. Shokrollahi, “Simultane- ous Preconcentration and Determination of Copper, Nic- kel, Cobalt and Lead Ions Content by Flame Atomic Ab- sorption Spectrometry,” Journal of Hazardous Materials, Vol. 142, No. 1-2, 2007, pp. 272-278. doi:10.1016/j.jhazmat.2006.08.012 [16] M. Ghaedi, A. Shokrollahi,, K. Niknam,, E. Niknam, A. Najibi and M. Soylak, “Cloud Point Extraction and Flame Atomic Absorption Spectrometric Determination of Cad- mium(II), Lead(II), Palladium(II) and Silver(I) in Envi- ronmental Samples,” Journal of Hazardous Materials, Vol. 168, No. 2-3, 2009, pp. 1022-1027. doi:10.1016/j.jhazmat.2009.02.130 [17] K. Z. Hossain and T. Honjo, “Preconcentration and De- termination of Trace Amounts of Lead (II) as Thenoyl- trifluoroacetone Complex with Dibenzo-18-Crown-6 by Synergistic Extraction and Atomic Absorption Spec- trometry,” Fresenius’ Journal of Analytical Chemistry, Vol. 361, No. 5, 1998, pp. 451-454. doi:10.1007/s002160050924 [18] J. R. Chen, S. M. Xiao, X. H. Wu, K. M. Fang and W. H. Liu, “Determination of Lead in Water Samples by Graph- ite Furnace Atomic Absorption Spectrometry after Cloud Point Extraction,” Talanta, Vol. 67, No. 5, 2005, pp. 992- 996. doi:10.1016/j.talanta.2005.04.029 [19] Y. Surme, I. Narin, M. Soylak, H. Yuruk and M. Dogan, “Cloud Point Extraction Procedure for Flame Atomic Absorption Spectrometric Determination of Lead(II) in Sediment and Water Samples,” Microchimica Acta, Vol. 157, No. 3-4, 2007, pp. 193-199. doi:10.1007/s00604-006-0671-1 [20] Z. L. Fang, J. Ruzicka and E. H. Hansen, “An Efficient Flow-Injection System with on-Line Ion-Exchange Preconcentration for the Determination of Trace Amounts of Heavy Metals by Atomic Absorption Spectrometry,” Analytica Chimica Acta, Vol. 164, 1984, pp. 23-39. doi:10.1016/S0003-2670(00)85614-7 [21] M. G. Pereira, E. R. Pereira-Filho and M. A. Z. Arruda, “Determination of Cadmium and Lead at Low Levels by Using Preconcentration at Fullerene Coupled to Ther- mospray Flame Furnace Atomic Absorption Spectrome- try,” Spectrochimica Acta Part B: Atomic Spectroscopy, Vol. 59, No. 4, 2004, pp. 515-521. doi:10.1016/j.sab.2003.12.012 [22] M. G. Pereira, E. R. Pereira-Filho and M. A. Z. Arruda, “Acrylic Acid Grafted Polytetrafluoroethylene Fiber as New Packing for Flow Injection Online Microcolumn Preconcentration Coupled with Flame Atomic Absorption Spectrometry for Determination of Lead and Cadmium in Environmental and Biological Samples,” Analytica Chimica Acta, Vol. 514, No. 2, 2004, pp. 151-157. doi:10.1016/j.aca.2004.03.049 [23] M. Soylak, I. Narin, M. A. Bezerra and S. L. C. Ferreira, “Factorial Design in the Optimization of Preconcentration Procedure for Lead Determination by FAAS,” Talanta, Vol. 65, No. 4, 2005, pp. 895-899. doi:10.1016/j.talanta.2004.08.011 [24] M. Tuzen, K. Parlar and M. Soylak, “Enrichment/Sepa- ration of Cadmium (II) and Lead (II) in Environmental Samples by Solid Phase Extraction,” Journal of Hazard- ous Materials, Vol. 121, No. 1-3, 2005, pp. 79-87. doi:10.1016/j.jhazmat.2005.01.015 [25] S. Wang and R. F. Zhang, “On-Line Coupling of Elec- trochemical Preconcentration in Tungsten Coil Electro- thermal Atomic Absorption Spectrometry for Determina- tion of Lead in Natural Waters,” Spectrochimica Acta Part B: Atomic Spectroscopy, Vol. 54, 1999, pp. 1155- 1166. [26] M. Chamsaz, M. H. Arbab-Zavar and S. Nazari, “Deter- mination of Arsenic by Electrothermal Atomic Absorp- tion Spectrometry Using Headspace Liquid Phase Mi- croextraction after in situ Hydride Generation,” Journal of Analytical Atomic Spectrometry, Vol. 18, No. 10, 2003, pp. 1279-1282. doi:10.1039/b303169a [27] M. Kaykhaii, S. Nazari and M. Chamsaz, “Determination of Aliphatic Amines in Water by Gas Chromatography Using Headspace Solvent Microextraction,” Talanta, Vol. 65, No. 1, 2005, pp. 223-228. doi:10.1016/j.talanta.2004.06.019 [28] S. Nazari, “Determination of Trace Amounts of Cadmium by Modified Graphite Furnace Atomic Absorption Spec- trometry after Liquid Phase Microextraction,” Micro- chemical Journal, Vol. 90, No. 2, 2008, pp. 107-112. doi:10.1016/j.microc.2008.04.002 [29] S. Nazari, “Liquid Phase Microextraction and Ultratrace Determination of Cadmium by Modified Graphite Fur- nace Atomic Absorption Spectrometry,” Journal of Haz- ardous Materials, Vol. 165, No. 1-3, 2009, pp. 200-205. doi:10.1016/j.jhazmat.2008.09.099 [30] S. Nazari, “Determination of Gold by Electrothermal Atomic Absorption Spectrometry after Single Drop Mi- croExtraction,” Analytical Chemistry―An Indian Journal, Vol. 7, 2008, pp. 301-305. [31] E. Carasek, J. W. Tonjes and M. Scharf, “A New Method of Microvolume Back-Extraction Procedure for Enrich- ment of Pb and Cd and Determination by Flame Atomic Absorption Spectrometry,” Talanta, Vol. 56, No. 1, 2002, pp. 185-191. doi:10.1016/S0039-9140(01)00556-2 [32] G. Doner and A. Ege, “Determination of Copper, Cad- mium and Lead in Seawater and Mineral Water by Flame Atomic Absorption Spectrometry after Coprecipitation with Aluminum Hydroxide,” Analytica Chimica Acta, Copyright © 2011 SciRes. AJAC  S. NAZARI Copyright © 2011 SciRes. AJAC 767 Vol. 547, No. 1, 2005, pp. 14-17. doi:10.1016/j.aca.2005.02.073 [33] E. Matoso, L. T. Kubota and S. Cadore, “Use of Silica Gel Chemically Modified with Zirconium Phosphate for Preconcentration and Determination of Lead and Copper by Flame Atomic Absorption Spectrometry,” Talanta, Vol. 60, No .6, 2003, pp. 1105-1111. doi:10.1016/S0039-9140(03)00215-7 [34] G. A. Zachariadis, A. N. Anthemidis, P. G. Bettas and J. A. Stratis, “Determination of Lead by on-Line Solid Phase Extraction Using a PTFE Micro-Column and Flame Atomic Absorption Spectrometry,” Talanta, Vol. 57, No. 5, 2002, pp. 919-927. doi:10.1016/S0039-9140(02)00132-7 [35] J. Chen and K. C. Teo, “Determination of Cadmium, Copper, Lead and Zinc in Water Samples by Flame Atomic Absorption Spectrometry after Cloud Point Ex- traction,” Analytica Chimica Acta, Vol. 450, No. 1-2, 2001, pp. 215-222. doi:10.1016/S0003-2670(01)01367-8
|