 American Journal of Plant Sciences, 2011, 2, 527-534 doi:10.4236/ajps.2011.24062 Published Online October 2011 (http://www.SciRP.org/journal/ajps) Copyright © 2011 SciRes. AJPS 527 DNA Finger Printing of Prosopis cineraria and Prosopis juliflora Using ISSR and RAPD Techniques Khaled Elmeer, Ameena Almalki Genetic Engineering Department, Biotechnology Center, Doha, Qatar. Email: elmeer@gmail.com Received July 17th, 2011; revised August 16th, 2011; accepted September 5th, 2011. ABSTRACT Diversity within and among the populations of Prosopis cineraria and Prosopis juliflora collected from different loca- tion of Qatar were explored using Inter Simple Sequence Repeat (ISSR) and Random Amplified Polymorphic DNA (RAPD) markers. A total of one hundred and nine bands were generated from twenty nine ISSR and nineteen bands from seven RAPD primers with an average polymorphism of more than ninety nine percent across all the genotypes. ISSR techniques were capable o f distinguishing between P. cineraria and P. juliflora, through twen ty one bands. How- ever, of the seven RAPD markers, only three bands were able to distinguish between Prosopis species. The dendro- grams for the analysis of genetic similarity show that the individuals from both species can be separated in two highly related groups. Our observations suggest that genetic variations among different accessions of Prosopis are identified using ISSR and RAPD analysis. Keywords: Ghaf, Ghawiaf, Polymorphism, Dendrogram and Genetic Diversity 1. Introduction The genus Prosopis is one of the commercially important genera of legumes in arid climatic zones with multifari- ous benefits for mankind. Prosopis species are among the most important multipurpose leguminous trees, and are used for revegetation, agroforestry, apiculture, fodder timber, fuel, shade, firewood as well as affecting soil improvement and sand dune stabilization [1,2]. The ge- nus Prosopis includes about 44 species that have been described using morphological criteria and these are, in turn, grouped into five sections. Further, these five sec- tions include eight series. However, this classification does not seem to be rigid [3,4]. At the morphological level, leaves and flowers are more or less similar while in case of fruit there is a development from straight to curved and spirally coiled loments. There is also a marked vegetative diversification in the presence or ab- sence of spines, which also provides the foundation for a sectional subdivision of the genus [3]. Similarly, varia- tion of characters such as seed lipids [5], and mineral, crude protein and structural carbohydrate [6], have also been studied for distinguishing species, at least within a section and series. The accelerated and uncontrolled harvesting of this important natural resource has led to land degradation and desertification, as well as the loss of genetic diversity within and acro ss the Prosopis population. Due to multi- faceted utility of the species, the pressure for it and its diverse products is mounting. There is a vital need for thorough exploration and exploitation of all the available natural variation in Prosopis species so as to manage the available meager resources for sustainable utilization and to establish appropriate reforestation programs for the optimal exploitation of these natural resources [2,7]. Most of the approaches used to determine genetic di- versity in this genus have involved isozyme analysis. However, this method has methodological limitations because of restrictions in the number of loci examined and the possible tissue, developmental stage, or envi- ronmental specificity of gene expression [8,9]. Yet there were some concerted attempts to record natural genetic variation in various populations of P. cineraria using cytogenetical [10] and molecular markers [2]. Other than the above reports of interspecies variations, not much is known about intraspecific genetic variability in Prosopis species, especially at the molecular level. Molecular 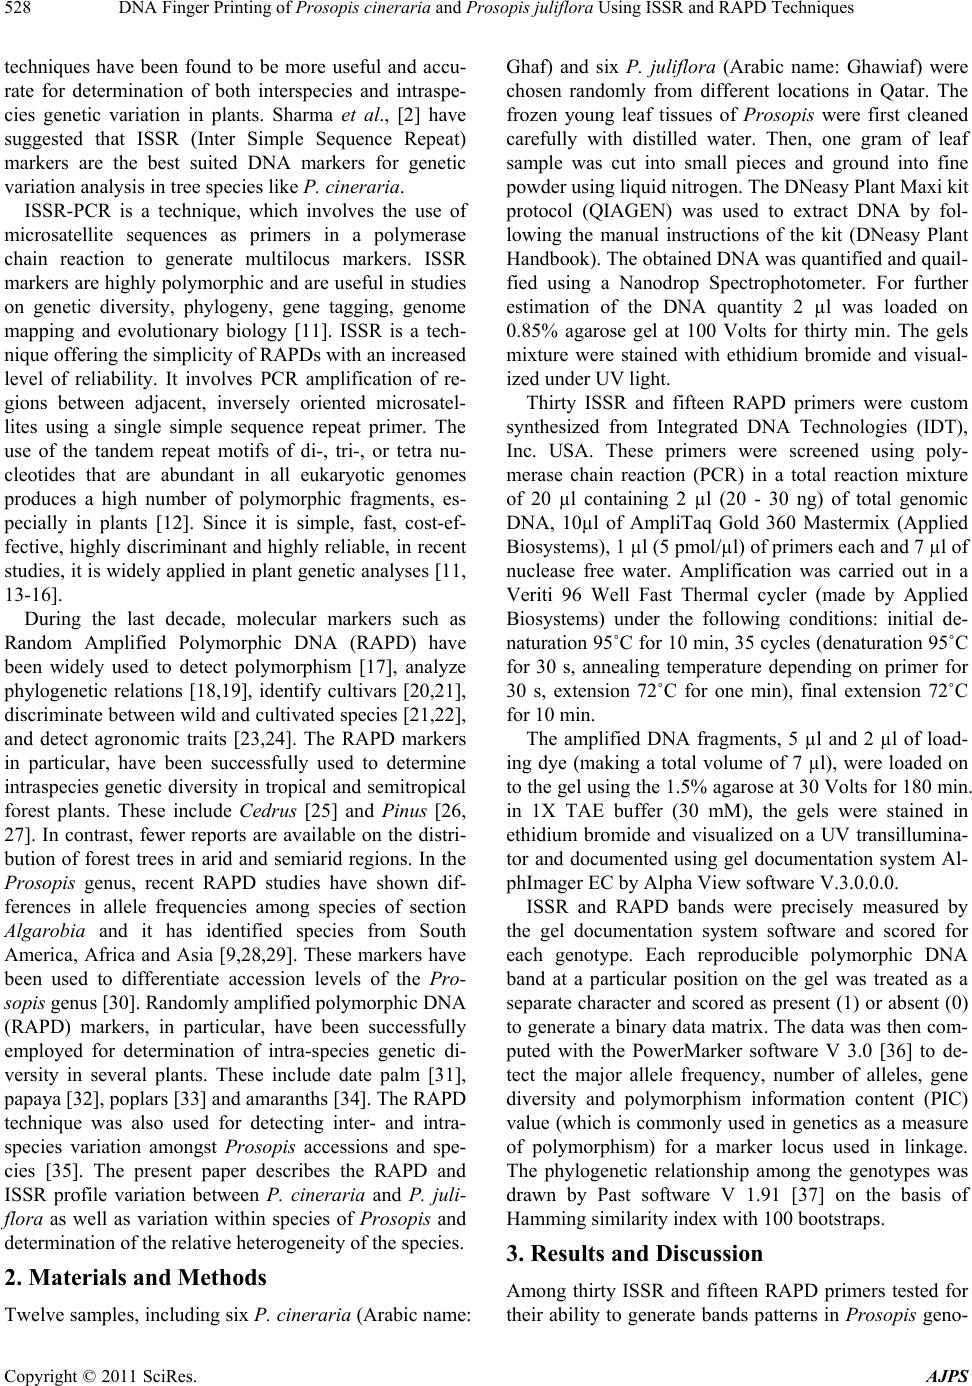 DNA Finger Printing of Prosopis cineraria and Prosopis juliflora Using ISSR and RAPD Techniques 528 techniques have been found to be more useful and accu- rate for determination of both interspecies and intraspe- cies genetic variation in plants. Sharma et al., [2] have suggested that ISSR (Inter Simple Sequence Repeat) markers are the best suited DNA markers for genetic variation analysis in tree species like P. cineraria. ISSR-PCR is a technique, which involves the use of microsatellite sequences as primers in a polymerase chain reaction to generate multilocus markers. ISSR markers are highly polymorphic and are useful in studies on genetic diversity, phylogeny, gene tagging, genome mapping and evolutionary biology [11]. ISSR is a tech- nique offering the simplicity of RAPDs with an increased level of reliability. It involves PCR amplification of re- gions between adjacent, inversely oriented microsatel- lites using a single simple sequence repeat primer. The use of the tandem repeat motifs of di-, tri-, or tetra nu- cleotides that are abundant in all eukaryotic genomes produces a high number of polymorphic fragments, es- pecially in plants [12]. Since it is simple, fast, cost-ef- fective, highly discriminant and highly reliable, in recent studies, it is widely applied in plant genetic analyses [11, 13-16]. During the last decade, molecular markers such as Random Amplified Polymorphic DNA (RAPD) have been widely used to detect polymorphism [17], analyze phylogenetic relations [18,19], identify cultivars [20,21], discriminate between wild and cultivated species [2 1,22], and detect agronomic traits [23,24]. The RAPD markers in particular, have been successfully used to determine intraspecies genetic diversity in tropical and se mitropical forest plants. These include Cedrus [25] and Pinus [26, 27]. In contrast, fewer reports are available on the distri- bution of forest trees in arid and semiarid regions. In the Prosopis genus, recent RAPD studies have shown dif- ferences in allele frequencies among species of section Algarobia and it has identified species from South America, Africa and Asia [9,28,29]. These markers have been used to differentiate accession levels of the Pro- sopis genus [30]. Randomly amplified polymorphic DNA (RAPD) markers, in particular, have been successfully employed for determination of intra-species genetic di- versity in several plants. These include date palm [31], papaya [32], poplars [33] and amaranths [34]. The RAPD technique was also used for detecting inter- and intra- species variation amongst Prosopis accessions and spe- cies [35]. The present paper describes the RAPD and ISSR profile variation between P. cineraria and P. juli- flora as well as variation within species of Prosopis and determination of the relative heterogeneity of the species. 2. Materials and Methods Twelve samples, including six P. cineraria (Arabic name: Ghaf) and six P. juliflora (Arabic name: Ghawiaf) were chosen randomly from different locations in Qatar. The frozen young leaf tissues of Prosopis were first cleaned carefully with distilled water. Then, one gram of leaf sample was cut into small pieces and ground into fine powder using liquid nitrogen. The DNeasy Plant Maxi kit protocol (QIAGEN) was used to extract DNA by fol- lowing the manual instructions of the kit (DNeasy Plant Handbook). The obtain ed DNA wa s quantif ied an d quail- fied using a Nanodrop Spectrophotometer. For further estimation of the DNA quantity 2 µl was loaded on 0.85% agarose gel at 100 Volts for thirty min. The gels mixture were stained with ethidium bromide and visual- ized under UV light. Thirty ISSR and fifteen RAPD primers were custom synthesized from Integrated DNA Technologies (IDT), Inc. USA. These primers were screened using poly- merase chain reaction (PCR) in a total reaction mixture of 20 µl containing 2 µl (20 - 30 ng) of total genomic DNA, 10µl of AmpliTaq Gold 360 Mastermix (Applied Biosystems), 1 µl (5 pmol/µl) of primers each and 7 µl of nuclease free water. Amplification was carried out in a Veriti 96 Well Fast Thermal cycler (made by Applied Biosystems) under the following conditions: initial de- naturation 95˚C for 10 min, 35 cycles (denaturation 95˚C for 30 s, annealing temperature depending on primer for 30 s, extension 72˚C for one min), final extension 72˚C for 10 mi n. The amplified DNA fragments, 5 µl and 2 µl of load- ing dye (making a total volume of 7 µl), were loaded on to the gel using the 1.5% agarose at 30 Volts for 180 min. in 1X TAE buffer (30 mM), the gels were stained in ethidium bromide and visualized on a UV transillumina- tor and documented using gel documentation system Al- phImager EC by Alpha View software V.3.0.0.0. ISSR and RAPD bands were precisely measured by the gel documentation system software and scored for each genotype. Each reproducible polymorphic DNA band at a particular position on the gel was treated as a sepa rate character and scored as presen t (1) or absent ( 0) to generate a binary data matrix. The data was then co m- puted with the PowerMarker software V 3.0 [36] to de- tect the major allele frequency, number of alleles, gene diversity and polymorphism information content (PIC) value (which is commonly used in genetics as a measure of polymorphism) for a marker locus used in linkage. The phylogenetic relationship among the genotypes was drawn by Past software V 1.91 [37] on the basis of Hamming similarity index with 100 bootstraps. 3. Results and Discussion Among thirty ISSR and fifteen RAPD primers tested for their ability to generate bands patterns in Prosopis geno- Copyright © 2011 SciRes. AJPS 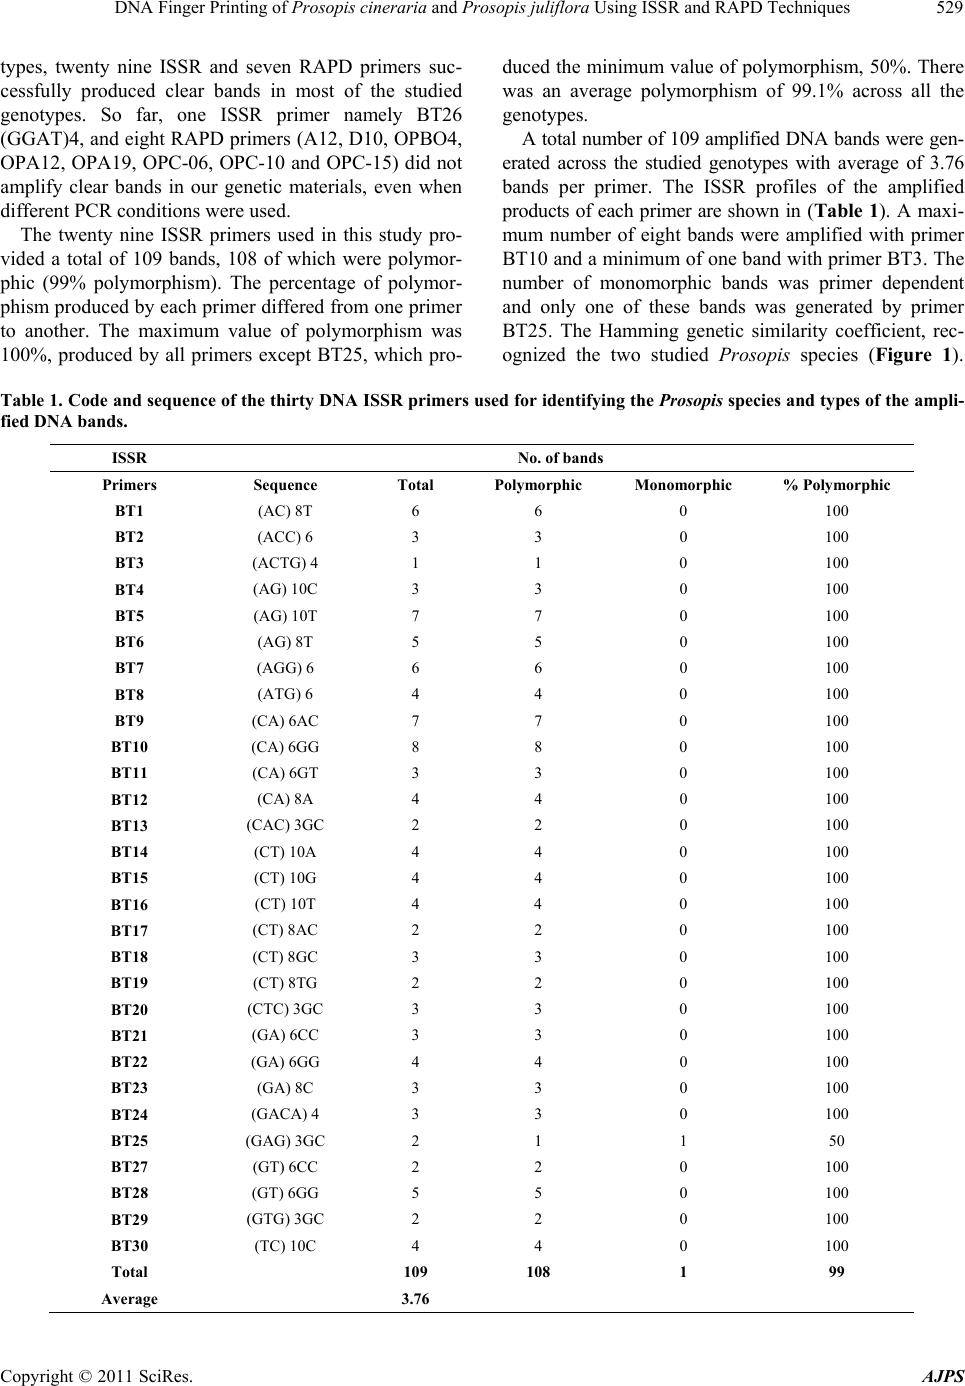 DNA Finger Printing of Prosopis cineraria and Prosopis juliflora Using ISSR and RAPD Techniques Copyright © 2011 SciRes. AJPS 529 types, twenty nine ISSR and seven RAPD primers suc- cessfully produced clear bands in most of the studied genotypes. So far, one ISSR primer namely BT26 (GGAT)4, and eight RAPD primers (A12, D10, OPBO4, OPA12, OPA19, OPC-06, OPC-10 and OPC-15) did not amplify clear bands in our genetic materials, even when different PCR conditions were used. The twenty nine ISSR primers used in this study pro- vided a total of 109 bands, 108 of which were polymor- phic (99% polymorphism). The percentage of polymor- phism produced by each primer differed from one primer to another. The maximum value of polymorphism was 100%, produced by all primers except BT25, which pro- duced the minimum value of polymorphism, 50%. There was an average polymorphism of 99.1% across all the genotypes. A total number of 109 amplified DNA bands were gen- erated across the studied genotypes with average of 3.76 bands per primer. The ISSR profiles of the amplified products of each primer are shown in (Table 1). A maxi- mum number of eight bands were amplified with primer BT10 and a minimum of one band with primer BT3. The number of monomorphic bands was primer dependent and only one of these bands was generated by primer BT25. The Hamming genetic similarity coefficient, rec- ognized the two studied Prosopis species (Figure 1). Table 1. Code and sequence of the thirty DNA ISSR primers used for identifying the Prosopis species and types of the ampli- fied DNA bands. ISSR No. of bands Primers Sequence Total Polymorphic Monomorphic % Polymorphic BT1 (AC) 8T 6 6 0 100 BT2 (ACC) 6 3 3 0 100 BT3 (ACTG) 4 1 1 0 100 BT4 (AG) 10C 3 3 0 1 00 BT5 (AG) 10T 7 7 0 100 BT6 (AG) 8T 5 5 0 100 BT7 (AGG) 6 6 6 0 100 BT8 (ATG) 6 4 4 0 100 BT9 (CA) 6AC 7 7 0 100 BT10 (CA) 6GG 8 8 0 100 BT11 (CA) 6GT 3 3 0 100 BT12 (CA) 8A 4 4 0 100 BT13 (CAC) 3GC 2 2 0 100 BT14 (CT) 10A 4 4 0 100 BT15 (CT) 10G 4 4 0 100 BT16 (CT) 10T 4 4 0 100 BT17 (CT) 8AC 2 2 0 100 BT18 (CT) 8GC 3 3 0 100 BT19 (CT) 8TG 2 2 0 100 BT20 (CTC) 3GC 3 3 0 1 00 BT21 (GA) 6CC 3 3 0 100 BT22 (GA) 6GG 4 4 0 1 00 BT23 (GA) 8C 3 3 0 100 BT24 (GACA) 4 3 3 0 100 BT25 (GAG) 3GC 2 1 1 50 BT27 (GT) 6CC 2 2 0 100 BT28 (GT) 6GG 5 5 0 100 BT29 (G TG) 3GC 2 2 0 100 BT30 (TC) 10C 4 4 0 100 Total 109 108 1 99 Average 3.76  DNA Finger Printing of Prosopis cineraria and Prosopis juliflora Using ISSR and RAPD Techniques 530 Figure 1. Dendrogram of Qatari Prosopis species based on ISSR technique according to hamming similarity coefficient. The highest similarity value was 0.02 which was re- corded between P. juliflora 5 and P. juliflo ra 6. The next highest similarity value was 0.03 between P. cineraria 1 and P. cineraria 3 and between P. cineraria 3 and P. cineraria 6. The lowest similarity value was 0.82 be- tween P. cineraria 1 and P. juliflora 5 and 6, P. cineraria 3 and P. juliflora 5 and 6 and between P. cineraria 6 and P. juliflora 5 and 6. The next lowest similarity value was 0.81 between P. cineraria 4 and P. juliflora 5 and 6. Similarity coefficient matrices were used to generate a dendrogram of Prosopis genotypes based on Hamming analysis (Figure 1). The analysis divided the twelve genotypes into two distinct clusters. The first cluster in- cluded P. cineraria, while the second cluster contained P. juliflora genotypes. The identification and characterization of species be- come possible through fingerprinting of each species since DNA is a source of informative polymorphism [38]. Based on twenty nine ISSR markers twenty one bands are capable of to distinguishing between P. cineraria and P. juliflora. Those bands were 2, 1, 1, 6, 2, 2, 1, 1, 1, 1, 2 and 1 represented in BT1, BT4, BT5, BT9, BT10, BT11, BT12, BT14, BT15, BT18, BT23 and BT30 respectively, whereas of the seven RAPD markers, only three bands are distinguishable between P. cineraria and P. juliflora. However those bands were only one band each in DO5, OPC02 and D20. The distinguishable bands in all species appe ared in P. cineraria but not in P. juliflora. Consequently, techniques of molecular genetic mark- ers have an important potential for the detection of ge- netic differences among species [39]. At the same time, it is necessary to develop better methods of characterization and evaluation of germplasm collections, to improve strategies for conservation and collection of germplasm, and to increase the utilization of plant genetic resource s. A detailed account of molecular phylogeny and the diversification history of thirty species of Prosopis were previous ly done by Catalano et al. [40]. It suggested that Prosopis is not a natural group, but one that adopted an ancient occupation of arid environments. This study in- dicated that old world species of Prosopis are not closely Copyright © 2011 SciRes. AJPS  DNA Finger Printing of Prosopis cineraria and Prosopis juliflora Using ISSR and RAPD Techniques531 related with the new world (American) species. The pre- sent investigation of P. cineraria revealed that there is a greater genetic variation of 88 .2% within the populations, whereas the variance among populations was only 11.8% only. This is in support of observations by Sharma et al. (2010) [2], who reported high natural genetic variation at the DNA level in thirty accessions of P. cineraria col- lected from different districts of Rajasthan. During recent years, different studies have supported the hypothesis that dry-adapted taxa in different regions of the world diverged concomitantly with the expansion of arid environments. That is the view of Phylica [41], Ruchoideae [42], Tiquillia [43] and Agave [44] in North America, and Rheum [45] in East Asia. Genetic differentiation depends on the scale of envi- ronmental heterogeneity and the balance of selection and higher gene flow especially amongst trees [46]. This fact supports our study that Prosopis is not a natural group, but a species that in ancient times, adopted and occupied arid environments in which its populations were adapt- able, and where they had the highest level of fitness The study of sequence variation also provides means to detect loci responsible for local adaptation [47]. When popula- tions become locally adapted to contrasting environments, alleles entering a new population may be eliminated by selection, so that the gene flow is partly restricted. The stronger the selection, the more rapid ly immigrant alleles of lower fitness will be eliminated from the population thereby reducing effective migration rates and increasing the time to coalescence [48]. The seven RAPD primers used in this study provided a total of nineteen bands; all of them were polymorphic (100% polymorphism). The total number of nineteen amplified DNA bands was generated across the studied genotypes with an average of 2.7 bands per primer. The RAPD profiles of the amplified products of each primer are shown in Table 2 . A maximum number of five bands were amplified with primer OPC11 and a minimum of two bands were amplified with primers A13, D20, A10 and D07. Using the Hamming genetic similarity coefficient, recognized the Prosopis species, the highest similarity value was 0.0, which is identically recorded between (P. cineraria 1 and P. cineraria 4) and (P. juliflora 4, 5 and 6 were identical as will), the next highe st similarity value was 0.05 between (P. cineraria 1 and P. cineraria 3) which was the same result with ISSR markers and (P. cineraria 3 and P. cineraria 4) while the lowest similar- ity value was 0.95 between (P. cineraria 1 and P. juli- flora 4, 5 and 6), (P. cineraria 4 and P. juliflora 4, 5 and 6), the next lowest similarity value was 0.89 between (P. cineraria 3 and P. juliflora 4, 5 and 6) . Similarity coefficient matrices were used to generate a dendrogram of Prosopis genotypes based on Hamming analysis (Figure 2), the analysis divided the twelve genotypes into two distinct clusters, the first cluster in- cludes P. cineraria, while the second cluster contains P. juliflora genotypes. The molecular markers obtained by the ISSR tech- nique revealed a remarkable molecular discrimination among Prosopis species more than RAPD technique. The phylogenetic analysis on the basis of ISSR (Figure 1) discriminate among P jouliflora 4, 5 and 6, while RAPD markers u sed (Figure 2) cannot revealed almost the same pattern. Also ISSR technique (Figure 1) discriminate among P cineraria 1 and 4, while RAPD markers (Fig- ure 2) did not. However, Ajibade et al. [49] and Galvan et al. [15] concluded that ISSR would be a better tool than RAPD for phylogenetic studies. Nagaoka and Ogi- hara [50] have also reported that the ISSR primers pro- duced several times more information than RAPD mark- ers in wheat. Table 2. Code and sequence of the seven DNA RAPD primers used for identifying the Prosopis species and types of the am- plified DNA bands. RPAD No. of bands Primers Sequence Total Polymorphic Monomorphic % Polymorphic DO5* TGAGCGGACA 3 3 0 100% OPC11 AAAGCTGCGG 5 5 0 100% OPC02* GTGAGGCGTC 3 3 0 100% A13 CAGCACCCAC 2 2 0 100% D20* ACCCGGTCAC 2 2 0 100% A10 GTGATCGCAG 2 2 0 100% DO7 TTGGCACGGG 2 2 0 100% Total 19 19 0 Average 2.714 100% *Band distinguish bet w e en species. Copyright © 2011 SciRes. AJPS 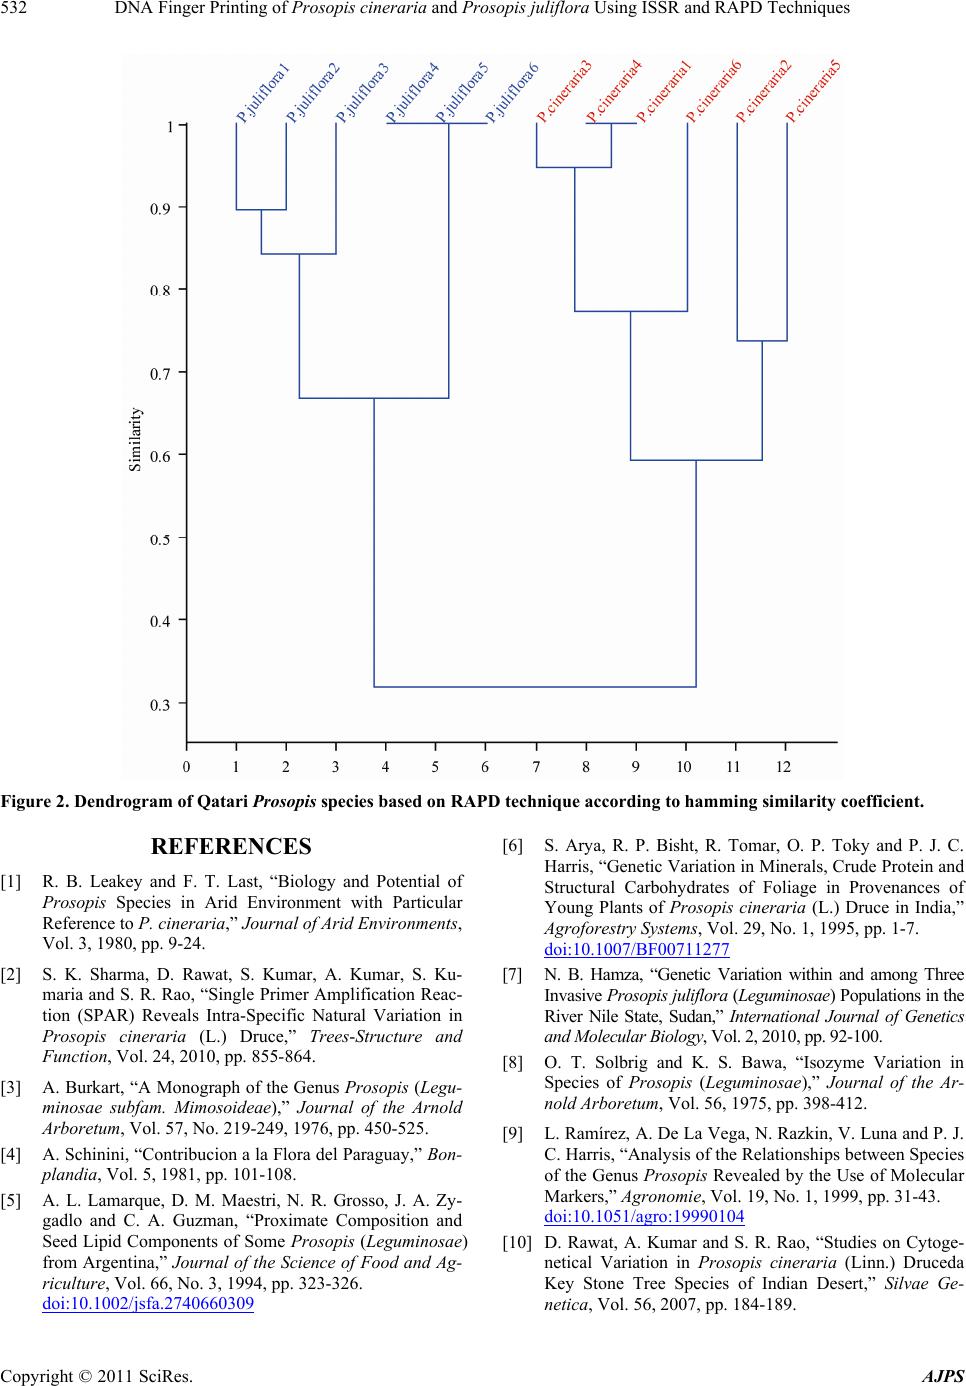 DNA Finger Printing of Prosopis cineraria and Prosopis juliflora Using ISSR and RAPD Techniques 532 Figure 2. Dendrogram of Qatari Prosopis species based on RAPD technique according to hamming similarity coefficient. REFERENCES [1] R. B. Leakey and F. T. Last, “Biology and Potential of Prosopis Species in Arid Environment with Particular Reference to P. cineraria,” Journal of Arid Environments, Vol. 3, 1980, pp. 9-24. [2] S. K. Sharma, D. Rawat, S. Kumar, A. Kumar, S. Ku- maria and S. R. Rao, “Single Primer Amplification Reac- tion (SPAR) Reveals Intra-Specific Natural Variation in Prosopis cineraria (L.) Druce,” Trees-Structure and Function, Vol. 24, 2010, pp. 855-864. [3] A. Burkart, “A Monograph of the Genus Prosopis (Legu- minosae subfam. Mimosoideae),” Journal of the Arnold Arboretum, Vol. 57, No. 219-249, 1976, pp. 450-525. [4] A. Schinini, “Contribucion a la Flora del Paraguay,” Bon- plandia, Vol. 5, 1981, pp. 101-108. [5] A. L. Lamarque, D. M. Maestri, N. R. Grosso, J. A. Zy- gadlo and C. A. Guzman, “Proximate Composition and Seed Lipid Components of Some Prosopis (Leguminosae) from Argentina,” Journal of the Science of Food and Ag- riculture, Vol. 66, No. 3, 1994, pp. 323-326. doi:10.1002/jsfa.2740660309 [6] S. Arya, R. P. Bisht, R. Tomar, O. P. Toky and P. J. C. Harris, “Genetic Variation in Minerals, Crude Protein and Structural Carbohydrates of Foliage in Provenances of Young Plants of Prosopis cineraria (L.) Druce in India,” Agroforestry Systems, Vol. 29, No. 1, 1995, pp. 1-7. doi:10.1007/BF00711277 [7] N. B. Hamza, “Genetic Variation within and among Three Invasive Prosopis juliflora (Leguminosae) Populations in the River Nile State, Sudan,” International Journal of Genetics and Molecular Biology , Vol. 2, 2010, pp. 92-100. [8] O. T. Solbrig and K. S. Bawa, “Isozyme Variation in Species of Prosopis (Leguminosae),” Journal of the Ar- nold Arboretum, Vol. 56, 1975, pp. 398-412. [9] L. Ramírez, A. De La Vega, N. Razkin, V. Luna and P. J. C. Harris, “Analysis of the Relationships between Species of the Genus Prosopis Revealed by the Use of Molecular Markers,” Agronomie, Vol. 19, No. 1, 1999, pp. 31-43. doi:10.1051/agro:19990104 [10] D. Rawat, A. Kumar and S. R. Rao, “Studies on Cytoge- netical Variation in Prosopis cineraria (Linn.) Druceda Key Stone Tree Species of Indian Desert,” Silvae Ge- netica, Vol. 56, 2007, pp. 184-189. Copyright © 2011 SciRes. AJPS  DNA Finger Printing of Prosopis cineraria and Prosopis juliflora Using ISSR and RAPD Techniques533 [11] M. P. Reddy, N. Sarla and E. A. Siddiq, “Inter Simple Sequence Repeat (ISSR) Polymorphism and Its Applica- tion in Plant Breeding,” Euphytica, Vol. 128, No. 1, 2002, pp. 9-17. doi:10.1023/A:1020691618797 [12] Horoshi Hamada, Petrino, G. Marianne and Takeo Kaku- naga, “A Novel Repeated Element with ZDNA-Forming Potential Is Widely Found in Evolutionarily Diverse Eu- karyotic Genomes,” Proceedings of the National Acad- emy of Sciences of the United States of America, Vol. 79, No. 21, 1982, pp. 6465-6469. doi:10.1073/pnas.79.21.6465 [13] B. Liu and J. F. Wendel, “Intersimple Sequence Repeat (ISSR) Polymorphisms as a Genetic Marker System in Cotton,” Molecular Ecology Notes, Vol. 3, 2001, pp. 205-208. [14] G. Arnau, J. Lallemand and M. Bourgoin, “Fast and Re- liable Strawberry Cultivar Identification Using Inter Sim- ple Sequence Repeat (ISSR) Amplification,” Euphytica, Vol. 129, No. 1, 2003, pp. 69-79. doi:10.1023/A:1021509206584 [15] M. Z. Galvan, B. Bornet, P. A. Balatti and M. Branchard, “Inter Simple Sequence Repeat (ISSR) Markers as a Tool for the Assessment of Both Genetic Diversity and Gene Pool Origin in Common Bean (Phaseolus vulgaris L.),” Euphytica, Vol. 132, No. 3, 2003, pp. 297-301. doi:10.1023/A:1025032622411 [16] K. Vijayan and S. N. Chatterjee, “ISSR Profiling of In- dian Cultivars of Mulberry (Morus spp.) and Its Rele- vance to Breeding Programs,” Euphytica,. Vol. 131, No. 1,. 2003, pp. 53-63. doi:10.1023/A:1023098908110 [17] J. G. K. Williams, A. R. Kubelik, K. J. Livak, J. A. Rafal- ski and S. V. Tingey, “DNA Polymorphisms Amplified by Arbitrary Primers Are Useful as Genetic Markers,” Nucleic Acids Research, Vol. 18, No. 22, 1990, pp. 6531-6535. doi:10.1093/nar/18.22.6531 [18] M. A. Rabbani, A. Iwabuchi, Y. Murakami, T. Suzuki and K. Takayanagi, “Genetic Diversity in Mustard (Bras- sica juncea L.) Germplasm from Pakistan as Determined by RAPDs,” Euphytica, Vol. 103, No. 2, 1998, pp. 235-242. doi:10.1023/A:1018304921526 [19] J. Juárez, G. Carrillo-Castañeda, R. Arreguín and A. Rubluo, “Inter and Intragenetic Variation of Four Wild Populations of Prosopis Using RAPD-PCR Fingerprints,” Biodiversity and Conservation, Vol. 11, No. 5, 2002, pp. 921-930. doi:10.1023/A:1015375803204 [20] C. Degani, L. J. Rowland, A. Levi, J. A. Horty nski and G. J. Galletta, “DNA Fingerprinting of Strawberry (Fragaria x ananassa) Cultivars Using Randomly Amplified Poly- morphic DNA (RAPD) Markers,” Euphytica, Vol. 102, No. 2, 1998, pp. 247-253. doi:10.1023/A:1018385715007 [21] P. V. Reddy and K. M. Soliman, “Identification of Wild and Cultivated Hordeum Species Using Tow-Primer RAPD Fragments,” Biologia Plantarum, Vol. 39, No. 4, 1997, pp. 543-552. doi:10.1023/A:1000922613713 [22] D. Kaemmer, R. Afza, K. Weising, G. Kahl and F. J. Novak, “Oligonucleotide and Amplification Fingerprint- ing of Wild Species and Cultivars of Banana (Musa sp.),” Nature Biotechnology, Vol. 10, 1992, pp. 1030-1035. doi:10.1038/nbt0992-1030 [23] P. Winter and G. Kahl, “Molecular Marker Technologies for Plant Improvement,” World Journal of Microbiology and Biotechnology, Vol. 11, No. 4, 1995, pp. 438-448. doi:10.1007/BF00364619 [24] K. Zhang, K. M. Soliman and V. T. Sapra, “Polymerase Chain Reaction Detect Polymorphisms and Trait Associa- tion in Soybean,” Biologia Plantarum, Vol. 40, No. 1, 1997, pp. 43-53. doi:10.1023/A:1000940400276 [25] B. Renau-Morata, S. G. Nebaurer, E. Sales, J. Allainguil- laume, P. Caligari and J. Segura, “Genetic Diversity and Structure of Natural and Managed Populations of Cedrus atlantica (Pinaceae) Assessed Using Random Amplified Polymorphic DNA,” American Journal of Botany, Vol. 92, No. 5, 2005, pp. 875-884. doi:10.3732/ajb.92.5.875 [26] G. E. Kandedmir, I. Kandedmir and Z. Kaya, “Genetic Variation in Turkish Red Pine (Pinus brutia Ten.) Seed Stands as Determined by RAPD Markers,” Silvae Ge- netica, Vol. 53, No. 4, 2004, pp. 169-175. [27] Z. Y. Zhang, Y. Y. Chen and Dz. Li, “Detection of Low Genetic Variation in a Critically Endangered Chinese Pine, Pinus squamata, Using RAPD and ISSR Markers,” Biochemical Genetics, Vol. 43, No. 5-6, 2005, pp. 239-249. doi:10.1007/s10528-005-5215-6 [28] B. O. Saidman, C. Bessega, L. I. Ferreyra and J. C. Vilardi, “Random Amplified Polymorphic DNA (RAPDs) Variation in Hybrid Swarms and Pure Populations of Genus Prosopis (Leguminosae). International Foundation for Schinini A. Contribucion a la¯ora del Paraguay,” Bonplandia, Vol. 5, 1998, pp. 101-108. [29] L. I. Ferreyra, C. Bessega, J. C. Vilardi, B. O. Saidman, “First Report on RAPDs Patterns Able to Differentiate Some Argentineae Species of Section Algarobia (Pro- sopis, Leguminosae),” Genetica, Vol. 121, No. 1, 2004, pp. 33-42. doi:10.1023/B:GENE.0000019925.06080.c7 [30] G. Landeras, M. Alfonso, N. M. Pasiecznik, P. J. C. Har- ris and L. Ramírez, “Identification of Prosopis juliflora and Prosopis pallid Accesions Using Molecular Mark- ers,” Biodiversity and Conservation, Vol. 15, No. 5, 2006, pp. 1829-1844. doi:10.1007/s10531-004-6682-5 [31] B. Corniquel and L. Mercier, “Date Palm (Phoenix dac- tylifera L.) Cultivar Identification by RFLP and RAPD,” Plant Science, Vol. 101, No. 2, 1994, pp. 163-172. doi:10.1016/0168-9452(94)90252-6 [32] J. I. Stiles, C. Lemme, S. Sondur, M. B. Morshidi and R. Manshardt, “Using Randomly Amplified Polymorphic DNA for Evaluating Genetic Relationships among Papaya Cultivars,” Theoretical and Applied Genetics, Vol. 85, No. 6-7, 1993, pp. 697-701. doi:10.1007/BF00225007 [33] H. D. Bradshaw, M. Villar, B. D. Watson, K. G. Otto, S. Stewart and R. F. Stettler, “Molecular Genetics of Growth and Development in Populus. III. A Genetic Linkage Map of a Hybrid Poplar Composed of RFLP, STS and RAPD Markers,” Theoretical and Applied Genetics, Vol. 89, 1994, pp. 167-178. doi:10.1007/BF00225137 [34] S. A. Ranade, A. Kumar, M. Goswami, N. Farooqui and Copyright © 2011 SciRes. AJPS  DNA Finger Printing of Prosopis cineraria and Prosopis juliflora Using ISSR and RAPD Techniques Copyright © 2011 SciRes. AJPS 534 P. V. Sane, “Genome Analysis of Amaranths: Determina- tion of Inter- and Intra-Species Variations,” Journal of Biosciences, Vol. 22, No. 4, 1997, pp. 457-464. doi:10.1007/BF02703191 [35] M. Goswami and S. A. Ranade, “Analysis of Variations in RAPD Profiles among Accessions of Prosopis,” Jour- nal of Genetics, Vol. 78, 1999, pp. 141-147. doi:10.1007/BF02934459 [36] K. Liu and S. V. Muse, “PowerMarker: An Integrated Analysis Environment for Genetic Marker Analysis,” Bioinformatics, Vol. 21, No. 9, 2005, pp. 2128-2129. doi:10.1093/bioinformatics/bti282 [37] Z. Hammer, D. A. T. Harper and P. D. Ryan, “Past: Pa- leontological Statistics Software Package for Education and Data Analysis,” Palaeontologia Electronica, Vol. 4, No. 1, 2001, p. 9. [38] H. El-Rabey, “Molecular and Biochemical Studies on Egyptian Hordium murinum L. Complex as Reveald by RAPD-PCR and Seed Storage Protein Electrophoresis. Taeckholmia, Vol. 28, 2008, pp. 145-156. [39] M. Benmoussa and A. Achouch, “Effect of Water Stress on Yield and Its Components of Some Cereals in Alge- ria,” Journal of Central European Agriculture, Vol. 6, No. 4, 2005, pp. 427-434. [40] S. A. Catalano, J. C. Vilardi, D. Tosto and B. O. Saidman, “Molecular Phylogeny and Diversification History of Prosopis (Fabaceae: Mimosoideae),” Biological Journal of the Linnean Society, Vol. 93, 2008, pp. 621-640. [41] J. E. Richardson, F. M. Welz, M. F. Fay, Q. C. B. Cronk, H. P. Linder, G. Reeves and M. W. Chase, “Rapid and Recent Origin of Species Riches in the Cape Flora of South Africa,” Nature, Vol. 412, 2001, pp. 181-183. doi:10.1038/35084067 [42] C. Klak, G. Reeves and T. Hedderson, “Unmatched Tempo of Evolution in Southern African Semi-Desert Ice Plants,” Nature, Vol. 427, 2003, pp. 63-65. doi:10.1038/nature02243 [43] M. J. Moore and R. K. Jansen, “Molecular Evidence for the Age, Origin, and Evolutionary History of the Ameri- can Desert Plant Genus Tiquilia (Boraginaceae),” Mo- lecular Phylogenetics and Evolution, Vol. 39, No. 3, 2006, pp. 668-687. doi:10.1016/j.ympev.2006.01.020 [44] S. V. Good-Avila, V. Souza, B. S. Gaut and L. E. Eguiarte, “Timing and Rate of Speciation in Agave (Aga- vaceae),” Proceedings of the National Academy of Sci- ences of the United States, Vol. 103, No. 24, 2006, pp. 9124-9129. doi:10.1073/pnas.0603312103 [45] A. L. Wang, M. H. Yang and J. Q. Liu, “Molecular Phy- logeny, Recent Radiation and Evolution of Gross Mor- phology of the Rhubarb Genus Rheum (Polygonaceae) Inferred from Chloroplast DNA trnL-F Sequences,” An- nals of Botany, Vol. 96, No. 3, 2005, pp. 489-498. doi:10.1093/aob/mci201 [46] O. Savolainen, T. Pyhajarvi and T. Knurr, “Gene Flow and Local Adaptation in Trees,” Annual Review of Ecol- ogy, Evolution, and Systematics, Vol. 38, 2007, pp. 595-619. doi:10.1146/annurev.ecolsys.38.091206.095646 [47] S. I. Wright and B. S. Gaut, “Molecular Population Ge- netics and the Search for Adaptive Evolution in Plants,” Molecular Biology and Evolution, Vol. 22, No. 3, 2005, pp. 506-519. doi:10.1093/molbev/msi035 [48] B. Charlesworth, M. Nordborg and D. Charlesworth, “The Effects of Local Selection, Balanced Polymorphism, and Background Selection on Equilibrium Patterns of Genetic Diversity in Subdivided Populations,” Genetic Research, Vol. 70, 1997, pp. 155-174. doi:10.1017/S0016672397002954 [49] S. R. Ajibade, N. F. Weeden and S. Michite, “Inter Sim- ple Sequence Repeat Analysis of Genetic Relationships in the Genus Vigna,” Euphytica, Vol. 111, No. 1, 2000, pp. 47-55. doi:10.1023/A:1003763328768 [50] T. Nagaoka and Y. Ogihara, “Applicability of Inter Sim- ple Sequence Repeat Polymorphisms in Wheat for Use as DNA Markers in Comparison to RFLP and RAPD Mark- ers,” Theoretical and Applied Genetics, Vol. 94, No. 5, 1997, pp. 597-602. doi:10.1007/s001220050456
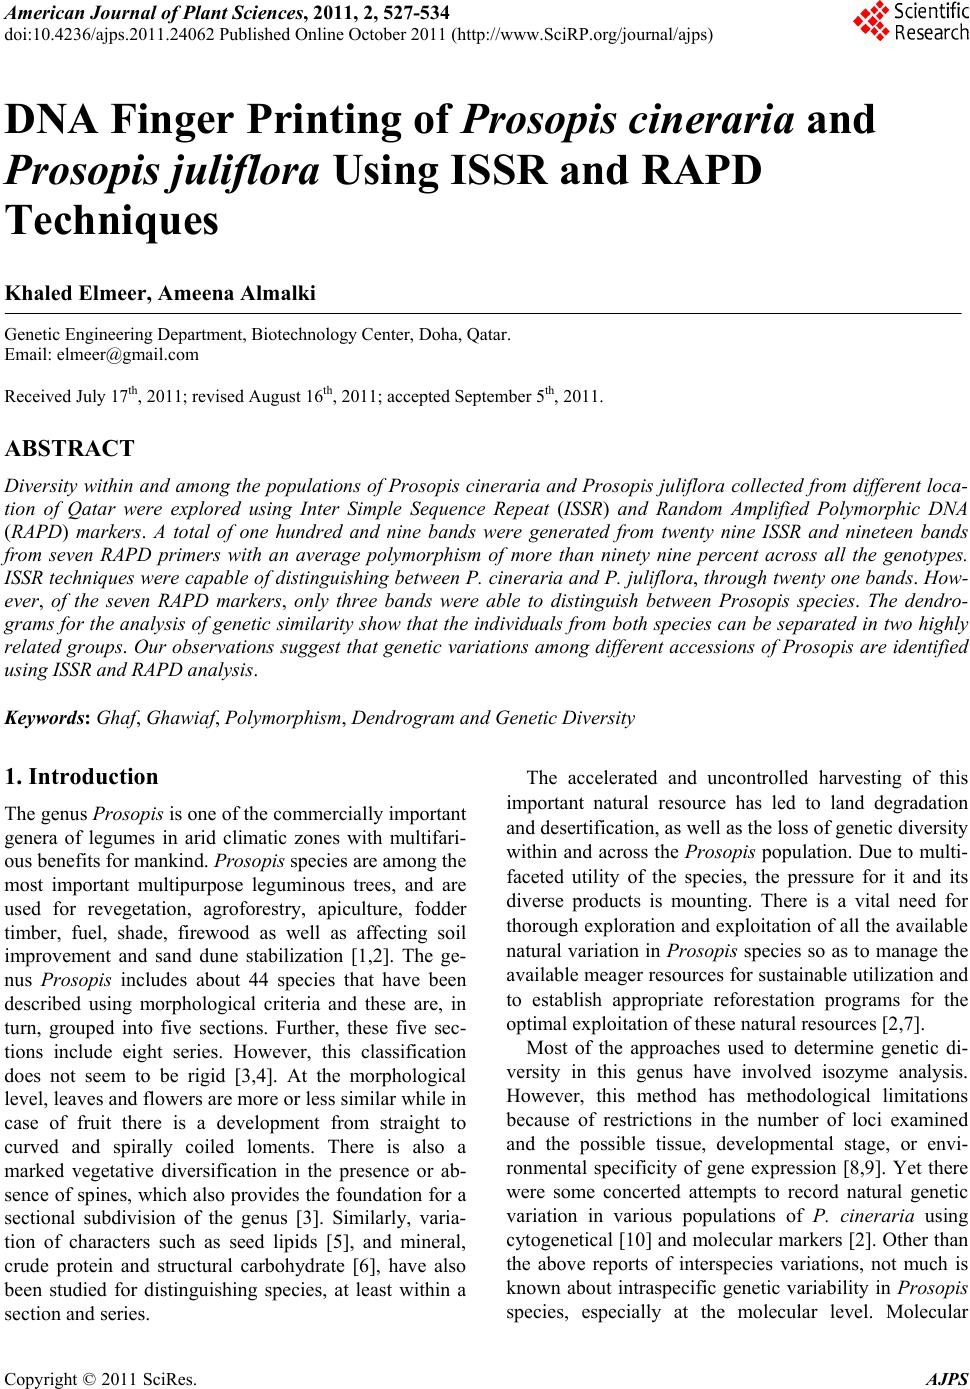
|