Advances in Chemical Engi neering and Science , 2011, 1, 289-298
doi:10.4236/aces.2011.14040 Published Online October 2011 (http://www.SciRP.org/journal/aces)
Copyright © 2011 SciRes. ACES
Determination of External Mass Transfer Model for
Hydrolysis of Jat ropha Oil Using Immobilized Lipase in
Recirculated Packed-Bed Reactor
Chong-Wan Cheng1, Rahmath Abdulla1, Rao Rampally Sridhar2, Pogaku Ravindra1*
1School of Engineering and Information Technology, University Malaysia Sabah, Kota Kinabalu, Malaysia
2Chemical Engineering Department, Chaitanya Bharathi Institute of Technology, Hyderabad, India
E-mail: *dr_ravindra@hotmail.com
Received August 11, 2011; revised August 26, 2011; accepted October 4, 2011
Abstract
In this study, a simple and effective technique for establishing an external mass transfer model in a recircu-
lated packed-bed batch reactor (RPBBR) with an immobilized lipase enzyme and Jatropha oil system is pre-
sented. The external mass transfer effect can be represented with a model in the form of Colburn factor JD =
K Re–(1–n). The value of K and n were derived from experimental data at different mass flow rates.The ex-
periment shows an average increment of 1.51% FFA for calcium alginate and 1.62% FFA for carrageenan
after the hydrolysis took place. Based on different biopolymer material used in immobilized beads, JD =
1.674 Re–0.4 for calcium alginate and JD = 1.881 Re–0.3 for k-carrageenan were found to be adequate to predict
the experimental data for external mass transfer in the reactor in the Reynolds number range of 0.2 to 1.2.
The purposed model can be used for the design of industrial bioreactor and scale up. Besides, the external
mass transfer coefficients for the hydrolysis of Jatropha oil reaction and the entrapment efficiency for the
two biopolymer materials used were also investigated.
Keywords: Pseudomonas Cepacia Lipase, Jatropha curcas L. Oil, Carrageenan, Calcium Alginate, Hydrolsis,
Packed Bed Reactor, Immobilized Enzyme, External Film Diffusion
1. Introduction
Lipases are one of the most signicant enzymes that have
been investigated for use in organic synthesis. Lipases
can be used to modify lipid to produce synthetic lipids
for various industrial applications. Lipase also has been
used as biocatalyst for variety of other reactions such as hy-
drolysis of fats, synthesis of esters and glycerides. How-
ever, free lipase is not always sufficiently stable under
operational condition and it is costly for one time usage.
Thus, enzymes immobilization is introduced. Immobili-
zation helps in elimination of enzyme recovery and puri-
fication process. Immobilized enzyme also can prevent
protein contamination of the final product. Furthermore,
immobilization helps to maintain constant environmental
conditions so that it can protects the enzymes against
changes in pH or temperature.
In this research, external mass transfer model of the
system of immobilized lipase in Jatropha oil will be es-
tablished. This model is important in designing an im-
mobilized enzyme reactor as mass transfer limitation is
one of the major concerns in utilization of immobilized
lipase enzyme for industrial purposes [1]. Reactor design
factors such as reactor types, size and operating condi-
tions can be influenced by the external mass transfer in
immobilized enzyme systems. In detail, for enzymatic
reactions, the components from the bulk phase must be
transferred to the catalytic surface and react on it. The
rate-limiting step of the process can be the chemical
reaction, but more frequently it will corresponds to
transfer of the component to the catalyst surface. For this
reason, the reactor size can be dictated by the
mass-transfer processes rather than the kinetic proc-
esses. This fact alone justifies the importance of devel-
oping the mass transfer coefficient of the system. Under-
standing the model can also assist in controlling the
global rate of a chemical process that takes place in the
reactor.
290 C.-W. CHENG ET AL.
1.1. Development of External Mass Transfer
Model
The external mass transfer model in the system of im-
mobilized lipase enzyme in Jatropha oil will be estab-
lished and the methodology is adapted from different
journals [1].
A few assumptions are made as follows:
The reaction follows a rst-order rate.
The reaction in a steady state condition.
The flow in packed bed column is plug flow and has
no axial dispersion.
The immobilized enzyme particles are spherical.
The enzyme activity throughout the particle is uni-
form.
1.1.1. Apparent Rea c tion Rate
The material balance for Jatropha oil (substrate) in the
packed bed column is as follows:
2
d610
d
HQ Cr
WZ



 (1)
where r is the reaction rate (mgg1h1), Q is the volu-
metric ow rate (mlmin1), H is the height of the column
(cm), W is the total amount of immobilized enzyme par-
ticles (g), and dC/dz is the concentration gradient along
the column length (mgl1cm1).
Assuming rst-order kinetics, the reaction rate can be
written in terms of bulk substrate concentration:
2
d610
dp
HQ CkC
WZ

 

 (2)
where kp is the apparent rst-order reaction rate constant
(lg1h1) or the observed reaction rate constant and C is
the bulk substrate concentration (mgl1).
For the boundary conditions 1 and 2, below:
Boundary condition 1: at Z = 0 of C = Cin and
Boundary condition 2: at Z = H of C = Cout
Equation (2) can be solved as follows:
2
10
ln 6
in
p
out
CWk
CQ



 (3)
where Cin is the column inlet substrate (Jatropha oil)
concentration (mgl1) and Cout is the column outlet sub-
strate (Jatropha oil) concentration (mgl1).
The concentration at the outlet of the packed-bed is
therefore can be written as:
e
N
out in
CC
(4)
with N defined as
2
10
6
p
W
Nk
Q
 (5)
Since a recycling system is involved, the inlet conc
entration to the column changes for every cycle. Ther
efore, an overall mass balance for an RPBBR is as fol
lows:
d0
d
V
t (6)
where V is the volume of the reacting solution in the res-
ervoir (ml).
The component balance in the reservoir gives
1
21
d1
d
CCC
t
 
(7)
where
is the residence time (min) in the reservoir
(V/Q), C1 is the concentration of Jatropha oil (mgl1) in
the reservoir, and C2 is the concentration (mgl1) at the
outlet of the packed-bed column to be circulated back to
the reservoir.
Based on Equation (4), C2 can be dened as follows:
21
e
N
CC
(8)
Combination of Equations (7) and (8) will give
1
1
d1e
d
N
CCC
t
 
1
(9)
Integrating Equation (9) using boundary conditions of
V = Vres and C1 = C0 when t = 0 gives the change of Jat-
ropha oil concentration in the reservoir with time as

10
e1
exp
Nt
CC

(10)
Based on Equation (10), a plot of ln (C1/C0) versus
time will give a slope term as follows:
e1
slope
N
(11)
1.1.2. Combination of Mass Transfer and Biochemical
Reaction
There are regions near the surface of the packing media
where the uid velocity is very low when uid ows
through a packed bed. In such regions around the exte-
rior of packing media, the substrate transport takes place
primarily by molecular diffusion.
The observed reaction rate can be signicantly de-
creased by the external lm diffusion since the rate may
be very slow. The local rate of lm diffusion of the Jat-
ropha oil from the bulk uid to the outer surface of the
immobilized beads is influenced by the external mass
transfer coefficient, the area for external mass transfer
and the driving force for mass transfer (i.e. concentration
difference between the bulk and the external surface of
the immobilized bead).
Copyright © 2011 SciRes. ACES
C.-W. CHENG ET AL.
291

mmm s
rkaCC (12)
where rm is the external mass transfer rate of substrate
(mgg1h1), km is the external mass transfer coefficient
(cmh1), am is the external surface area for mass transfer
(cm2mg1), C is the substrate concentration in the bulk
liquid (mgL1), and Cs is the substrate concentration at
surface of the immobilized cell (mgL1).
The value of am can be determined using the following
equation
6
m
p
p
ad
(13)
With dp as the particle diameter (cm) and ρp the particle
density (mgcm3).
The rst-order biochemical reaction rate of immobi-
lized beads can be written as:
rkC (14)
k is the “surface” rst-order reaction rate constant
(lg1h1) which takes into account both the effective
internal mass transfer and the intrinsic reaction.
The effective internal mass transfer coefficient can be
assumed constant at low substrate concentration. As the
substrate concentrations used in this study were low,
Equation (14) is valid throughout this study [1].
At steady state, the rates of external mass transfer and
overall substrate utilization by the particle will be the
same; Equations (12) and (14) are equated and rear-
ranged to give
mm
s
mm
kaC
Ckka
(15)
Substituting Equation (15) into (14) and equating with
p, the effects of external mass transfer on the ap-
parent reaction rate constant, kp is shown as follow:
rkC
mm
p
mm
kk a
kkka
(16)
or
11 1
p
mm
kkka
 (17)
1.1.3. Empirical Model
The value of k is constant as far as this particular reac-
tion is concerned and is independent of the operating
parameters such as the mass ow rate and the scale of the
system. However, the external mass transfer coefficient,
km changes with parameters such as ow rate, reactor
diameter and uid properties. This in turn changes the
apparent reaction rate.
Therefore, the external mass transfer coefficient (km)
can be expressed in terms of operational parameters and
the properties on the uid by the dimensionless group:

2
31
Re n
m
D
f
kP
J
GD





K
(18)
where JD is the Colburn factor and Re is the Reynolds
number. The symbols μ, ρ and Df are the uid viscosity
(gcm1min1), density (gml1) and diffusivity (cmmin1),
respectively. The value of n depends on the mass transfer
conditions and varies from 0.1 to 1.0 depending on the
ow characteristics.
G is the mass ux (gcm2min1) and it can be calcu-
lated using Equation (19) as follows:
c
Q
Ga
(19)
where Q is the volumetric ow rate (mlmin1), ac is the
cross-sectional area of column (cm2) and ε is the void
fraction in a packed-bed.
Equating Equation (18), the external mass transfer co-
efficient can be expressed as:
21
3n
pn
m
f
d
K
kG
D
 







(20)
or
n
m
kAG (21)
where
21
3n
p
f
d
K
AD
 







(22)
By substituting Equation (21) into Equation (17):
111
n
pm
kAa
G


1
k



 (23)
The plot 1/kp vs 1/Gn for different values of n yields
straight lines with slope (1/Aam) and intercept (1/k). The
calculated values of A and k from the graph are then used
to get the values of km (using Equation. (21)) and an es-
timated kp (using Equation (17)). A trial-and-error pro-
cedure is repeated for all n values until the estimated
value of kp matches well with the experimental kp [1-3].
2. Materials and Method
2.1. Materials
The non-edible crude Jatropha oil is produced in labora-
tory using solvent extraction method and it is stored at
low temperature to avoid rancidity of the vegetable oil.
Pseudomonas cepacia lipase is obtained from Amano
Copyright © 2011 SciRes. ACES
292 C.-W. CHENG ET AL.
Enzyme (Japan) where it is used throughout the experi-
ment. Biopolymer materials such as carrageenan and
sodium alginate powder are purchased from FMC Bio-
polymer (USA). N-Hexane is of analytical grade and is
purchased from Fisher Scientific (USA).
2.2. Extraction of Jatropha Oil from Jatropha
Seed
100 g of Jatropha seed is dried and the shells of the seeds
are removed. The seed are then ground to fine powder to
increase the efficiency of oil extraction using n-hexane.
The Jatropha powder is taken into extractor column. Sol-
vent n-hexane is filled in the solvent vessel. The extrac-
tion is done at temperature of 110˚C - 130˚C for 5 - 7
hours. After extraction completed, the round bottom
flask containing n-hexane and extracted Jatropha oil is
transferred to rotary evaporator to further evaporate the
solvent. The final extracted Jatropha oil is inserted in
air-tight bottle which is covered by aluminum foil and
kept in the refrigerator to prevent Jatropha oil from dete-
rioration by temperature, sunlight and presence of air.
The recovered n-hexane solvent may be reused for sub-
sequent extractions to prevent wastage [4].
2.3 Entrapment of Lipase in Calcium Alginate
Beads
1g lipase powder/ml phosphate buffer pH 7 is mixed
with 100 ml sodium alginate solution (1% - 2%, w/v).
The mixture is stirred thoroughly to ensure complete
mixing. As soon as the mixed solution dripped into 2%
of CaCl2 solution with a syringe, calcium-alginate beads
are formed. The CaCl2 solution is constantly stirred with
magnetic stirrer to avoid sticking between the dropped
beads. The bead size can be changed by using syringes
with different needle diameters. After 20 min of harden-
ing, the beads are separated from the CaCl2 solution and
are stored at temperature below 4˚C to minimize enzyme
leakage.
2.4. Entrapment of Lipase in k-Carrageenan
Beads
1 g lipase powder/ml phosphate buffer pH 7 will be
mixed in 100 ml κ-carrageenan solution (1% - 2%, w/v).
The mixture will be stirred thoroughly to ensure com-
plete mixing. During the mixing, the mixture should be
maintained at 35˚C - 40˚C to prevent early hardening of
k-carrageenan solution. As soon as the mixed solution
dripped into 2% of KCl solution with a syringe, the
beads will formed. The bead size can be changed by us-
ing syringes with different needle diameters. After 20
min of hardening, the beads will be separated from the
KCl solution and are stored at temperature below 4˚C to
minimize enzyme leakage [5].
2.5. Entrapment Efficiency
The samples are mixed well and 1.0 ml of the samples is
transferred to a 10 ml glass tube. 1.4 ml of Lowry solu-
tion is added to the tubes. The tubes are capped and
mixed. All the tubes are incubated for 20 minutes at
room temperature in dark. The diluted Folin reagent is
prepared. After 20 minutes of incubation, the samples are
added 0.2 ml of diluted Folinreagent to each tube. Again,
the samples are mixed and incubated for more than 30
minutes at room temperature in dark. After 30 minutes,
the samples are transferred to semi-micro disposable cu-
vettes and tested by vis-spectrophotometer at 600 nm [6].
2.6. Hydrolysis of Jatropha Oil in RPBBR
The batch stirred-tank reactor is heated with heater and is
stirred using a magnetic stirrer. A peristaltic pump was
installed in batch reactor to form a recirculated packed-
bed batch reactor (RPBBR) as shown at Figure 1.
The reaction mixture is prepared in proportion of 15
ml of Jatropha oil, 24 ml of n-hexane, 1.2 ml of water.
The mixture is incubated at 40˚C and stirred at 200 rpm.
Immobilized lipase is packed into jacketed column. Sam-
ples are taken at different time intervals and analyzed for
fatty acids.
2.7. Chemical Titration for Fatty Acid
Concentration
1 g sample of oil is dissolved into about 20 ml of mixture
Figure 1. Schematic representation of a recirculated packed-
bed batch reactor.
Copyright © 2011 SciRes. ACES
C.-W. CHENG ET AL.
293
of solvent ethanol and diethyl ether. Few drops of phe-
nolphthalein indicator solution are added into the mixture.
The mixture of solution is titrated immediately with so-
dium hydroxide solution. The mixture is well mixed by
stirring with magnetic stirrer. It is important to titrate the
mixture to the same intensity of pink color as observed.
The amount of sodium hydroxide solution used is re-
corded. Lastly, percentage of free fatty acid is calculated
using formula: [7]

Vtitrant mlsolnmoles NaOH
%FFA 10001 Lsoln
1 moleFFA282.46FFA1
1 moleNaOH1 moleweightofoil(g)
N
g
FFA


3. Results and Discussion
3.1. Solvent Extraction of Jatropha Seed
From 100 g of seed, approximately 70 to 75 ml of oil
will be extracted. For the extracted oil, the oil will be
kept in refrigerator and away from sunlight to prevent
further reaction.
3.2. Capsule Size of Entrapped Lipase
The air-dried calcium alginate beads and k-carrageenan
beads with immobilized lipase are almost spherical in
shape. The average diameter of calcium alginate bead
and k-carrageenan beads are 0.3 cm.
3.3. Surface Morphologies of Entrapped Lipase
As can be observed from the SEM diagram, the two dif-
ferent biopolymer materials used show a different struc-
ture on the surface of the beads which may caused by the
different cross linking that took place in respective beads.
From observation, there are white spherical dots located
at everywhere of the beads for both parameters (k-carra-
geenan and calcium alginate). They are presumed as the
lipase enzyme.
Figure 2. Picture of entrapped lipase .
3.4. Entr
The entrapment efficiencies of respective mixture were
that there is loss of enzymes. This
w
agitation in collection flask may
ca
apment Efficiency
determined in terms of protein coupling. From data in
Table 1, the entrapment efficiencies were found to be
87.25% and 67.45% for calcium alginate and k-carra-
geenan respectively.
This studies show
as confirmed by the protein assay performed on the
aqueous phase (hardening solution). Some of the possi-
ble reasons are the difference of structure of respective
biopolymer material.
Besides, presence of
use the loss of enzyme.
(a)
(b)
Figure 3. SEM of calcium alte beads (a) at 100× magni-
Table 1. Entrapment efficiency of immobilized lipase.
gina
fication (b) at 1000× magnification.
Calcium alginate k-Carrageenan
F First Second
run run
irst Second
run run
Amount of protein
i11 15 115115
ntroduced (mgml–1) 4.615 14.614.614.61
Amount of protein
coupled (mgml–1)
tein coupling yield (
96.923 103.077 73.84680.769
Pro %)
.2 4
84.56 89.93 64.43 70.47
Average (%) 875 67.5
Copyright © 2011 SciRes. ACES
294 C.-W. CHENG ET AL.
(a)
(b)
Figure 4. SEM of carrageeneads (a) at 100× magnifica-
he figures below show the hydrolysis prole of Jatro-
the experimental data of concentration of fatty
ac
d used to cal-
cu
action rate
co
an b
tion (b) at 1000× magnification.
.5. Establishment of External Mass Transfer 3Model
T
pha oil in the recirculated packed-bed batch reactor at
various ow rates. It can be observed that the concentra-
tion of fatty acid with respect with time is in increasing
trend for both parameters. This shows that the hydrolysis
of triglycerides took place. Different increment of fatty
acid concentration is due to the different flow rate ap-
plied.
From
id, ln C1/C0 as a function of time at different ow rates
is plotted and is shown in Figures 7 and 8.
The slope of each line was determined an
late the value of N for respective flow rate.
The value of kp, the observed rst-order re
nstant, was obtained for each ow rate based on N
value. The calculated values of kp are listed in Table 2.
For both parameter, it can be observed that as flow
rateincreases, the value of kp decrease. This trend is possi-
Figure 5. Increment of fatty acid concentration against time
by calcium alginate parameter.
Figure 6. Increment of fatty acid concentration against tim
blwhen it is attribute to low residence time at high flow
), a plot of the experimen-
ta
e
by k-carrageenan parameter.
e
rate [8], which affect the diffusion of solute to pores of
particle and may have increase short circuiting inside the
reactor. The trend low residence time at high flow rate
can be observed at Table 2.
Referring to Equation (23
lly measurable quantity of 1/kp against 1/Gn should
yield a straight line of slope 1/A am and intercept 1/k
with values of n ranging from 0.1 to 1.0. This range of
Figure 7. Plot of ln (C/C0) vs time to estimate number of
transfer unit for calcium alginate parameter.
Copyright © 2011 SciRes. ACES
C.-W. CHENG ET AL.
295
Figure 8. Plot of ln (C/C0) vs time to estimate number o
vae has encompassed all the exponential values in the
f 1/kp against 1/Gn (for n values of 0.1,
0.
her to determine the
va
model is based on the n value
w
f 0.6 would
pr
f
transfer unit for k-carrageenan parameter.
lu
Colburn-Chilton factor that have been presented in the
literature [1].
A few plots o
3, 0.6 and 1.0) are shown in Figure 9. It was found that
all values of n show a similar trend; with increasing 1/Gn
value, the 1/kp value is decreasing.
All n values were analyzed furt
lue of n that gives the best lm diffusional model in
predicting mass transfer limitations. Using the slope and
intercept of each plot, the values of k and A were calcu-
lated. With Equation (21), the value of km at each ow
rate was estimated. Based on the calculated k and km, a
value of kp was recalculated and was compared with the
kp found experimentally.
The most satisfactory
hich provides the closest kp as compared to the experi-
mental results would be by using the calculation of nor-
malized percent deviation. The percent deviation of the
calculated values and the experimental results for all
ow rates for parameter calcium alginate are shown in
Table 3 for n = 0.1, 0.3, 0.6 and 1.0. According to Table
3, model having an exponent of 0.6 has the lowest nor-
malized percent deviation which is 0.036%.
Therefore, a model having an exponent o
ovide satisfactory predictions of the external mass
transfer coefficients in immobilized lipase system for
parameter alginate. Steps are repeated for parameter
k-carrageenan and it was found the most satisfactory n
value is 0.7 with normalized percent deviation of
0.0043% as shown in Table 4.
1pexperiment pcalculation
pexperiment
%1
i
N
00
k
N

Calculation of constant of Colburn factor is done by
u
De–0.507
Table 2. Observedate constant, kp at
Calcium k-Carrageenan
kk
sing McCune and Wilhelm equation as shown at below.
This correlation has been proven by Rovito and Kittel to
be effective in predicting diffusion in immobilized en-
zyme in packed bed reactors.
J = 1.625 R
first-order reaction r
different flow rate.
Flow rate Residence time Alginate
(mlmin–1) (min) kp k
p
10 24.12 0.025 0570.047 049
20 12.06 0.005368 0.002756
30 8.04 0.003520 0.004713
50 6.43 0.01130 0.004116
Table 3. The percent deviatn of calculated values of kp
Percent deviation (%)
io
from experimental values at different n for calcium alginate
parameter.
Q
(ml)
Experimental
n = 0.1 = 1.0
min–1 kp n = 0.3 n = 0.6n
10 0.005725 –0.0812 –0.0717 –0.0587 –0.0441
20 0.005368 –0.0149 –0.0114 –0.0076 –0.0045
30 0.003520 –0.4444 –0.4557 –0.4704 –0.4864
50 0.01130 0.5387 0.5373 0.53520.5326
Avervalue of (%)age deviation 0.0469 0.0395 0.03620.0597
Table 4. The percent deviatn of calculated values of kp
Percent deviation (%)
io
from experimental values at different n for k-carrageenan
parameter.
Q
(ml)
Experimental
n = 0.1 = 1.0
min–1 kp n = 0.4 n = 0.7n
10 0.047 0490.2039 0.1914 0.17710.1616
20 0.002756 –0.4244 –0.4278 –0.4288–0.4277
30 0.004713 0.1691 0.1736 0.17900.1846
50 0.004116 0.5092 0.0624 0.07250.0808
Averalue of%)age v deviation (–0.0124 –0.0124 –0.0043–0.0165
with JD is the Colburn factor; Re is the Reynolds num-
ynolds number is calculated with respect of differ-
en
xternal mass transfer model for
Jat
external mass transfer model for Jat-
ro
3.6. Determination of Mass Transfer Coefficient
ass transfer coefficient can be calculated based of equa-
ber.
Re
t flow rate. Thus Colburn factor and k constant with
respect to different flow rate can be calculated as well
using Equation (18).
Thus the proposed e
ropha oil in entrapped lipase (calcium alginate) system
is JD = 1.674 Re–0.4
And the proposed
pha oil in entrapped lipase (k-carrageenan) system is JD
= 1.881 Re–0.3.
M
tion below:
2/3
D
m
SC
J
G
kN
where JD is the Colburn factor; G is the is the superficial
velocity (cmmin–1); ρ is the density of the oil (gml –1)
and Nsc is the Schmidt number.
Copyright © 2011 SciRes. ACES
C.-W. CHENG ET AL.
Copyright © 2011 SciRes. ACES
296
Figure 9. Plots of 1/kpvs 1/Gnfor hydrolysis of Jatropha oil in immobilized lipase (calcium alginate parameter) for various
value of n. (a) n = 0.1; (b) n = 0.3; (c) n = 0.6; (d) n = 1.0.
Figure 10. Plots of 1/kpvs 1/Gn for hydrolysis of Jatropha oil in immobilized lipase (k-carrageenan paramer) for various
It can be observed that with increasing flow rate, gen-
er
. Conclusions
mass transfer model in terms of dimensionless num-
bers and experimental data plays important roles in de-
ment effi-
ci
te
value of n. (a) n = 0.1; (b) n = 0.4; (c) n = 0.7; (d) n = 1.0.
ally the external mass transfer rate and the difference
of substrate concentrate is in decreasing trend. This can
be explain due to low retention time (proven by experi-
mental data) with increase of flow rate, the external mass
transfer is slowed down and reduced the external mass
transfer rate. In other words, diffusion limitation is pre-
dominant in the external film of the immobilized beads.
Thus, for higher flow rate, the mass transfer at the exter-
nal film is slower and caused the concentration differ-
ence between surface and bulk liquid to be lower.
sign and simulation of a bioreactor performance. Usage
of enzymes in industrial applications are gaining popu-
larity due to the milder operating condition, lesser unde-
sirable side products, better wastewater qualities and
other advantages. However, usage of free enzyme is not
economical feasible. Immobilization of enzyme will not
only increase stability of enzyme, also encourage en-
zyme recycle thus reduce production cost. Selection of
suitable immobilization matrix is important to ensure
effective usage of enzyme and sustainability.
In this study, two biopolymer material; alginate and k-
carrageenan are investigated in term of entrap
4
ency and external mass transfer. Alginate shows a
higher value which is 87.25% than k-carrageenan; 67.45% A
C.-W. CHENG ET AL.
297
in–1) D
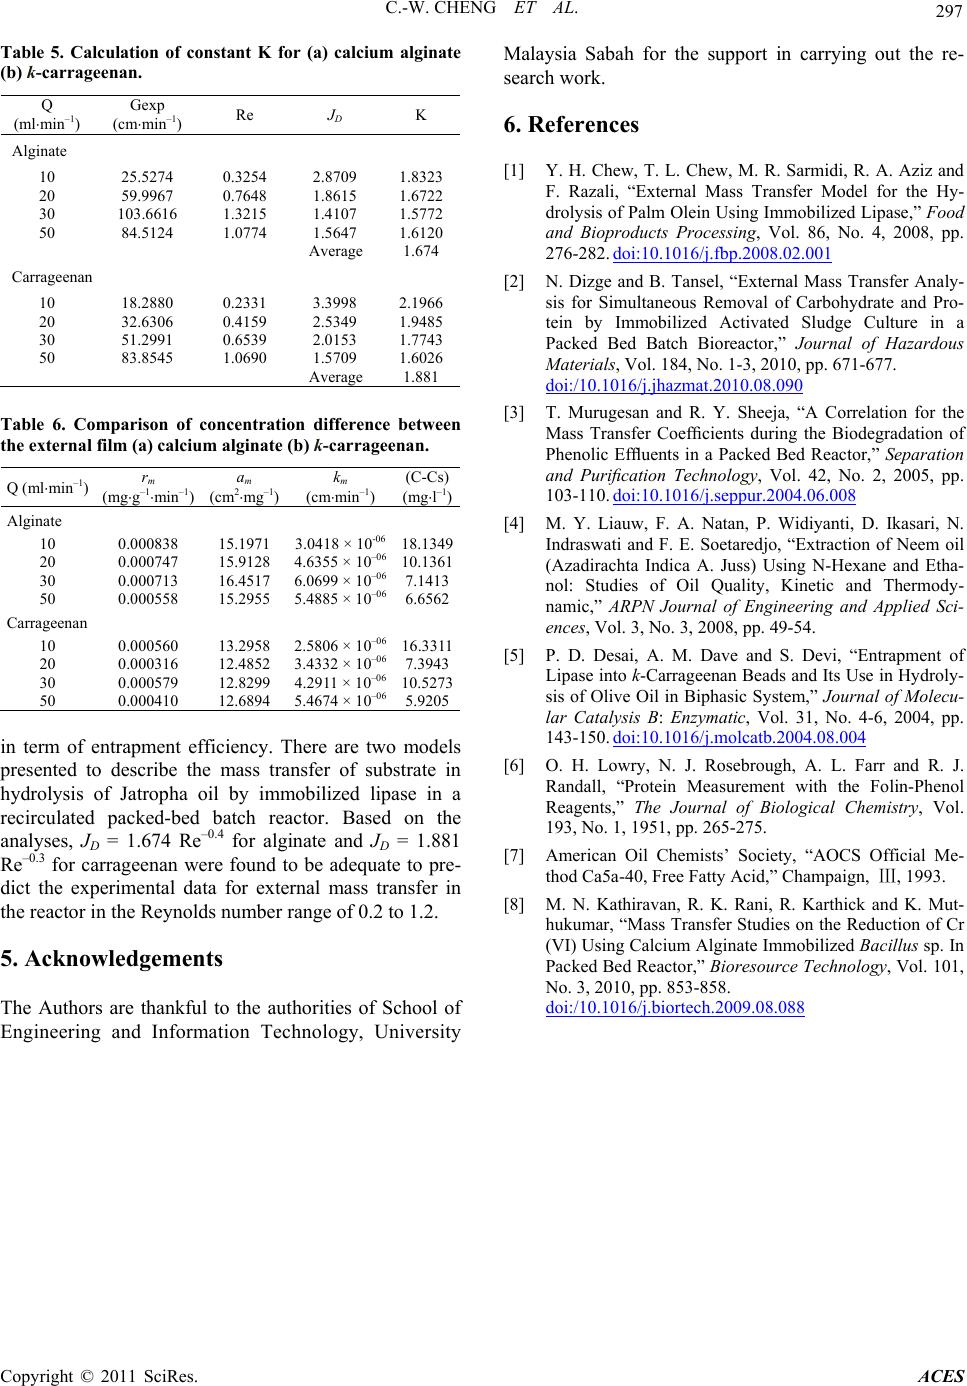
Table 5. Calculation of constant K for (a) calcium alginate
(b) k-carrageenan.
Q
(mlmin–1)
Gexp
(cmmRe J K
Alginate
10 25.5274 0.2.8709 1.83
59.9967 0.7648 1.8615 1.6
Carrageenan
10 18.2880 0.2331
32.6306 0.4159 2.5349 1.9485
3254 32
20 722
30 103.6616 1.3215 1.4107 1.5772
50 84.5124 1.0774 1.5647 1.6120
Average 1.674
3.3998 2.1966
20
30 51.2991 0.6539 2.0153 1.7743
50 83.8545 1.0690 1.5709 1.6026
Average 1.881
Table 6. Comparison of concentrationce
e external film (a) calcium alginate (b) k-carrageenan
)
differenbetween
. th
Q (mlmin–1) rm
(mgg–1min –1)
am
(cm2mg–1)
km
(cmmin–1)
(C-Cs)
(mgl–1
Alginate
10 0.000838 15.1971 3.
0.000747 15.9128 4.6355 × 10610.
–06
Carrageenan
0.000316 12.4852 3.4332 × 10–06 7.3943
–06
0418 × 10-06
–0
18.1349
20 1361
30 0.000713 16.4517 6.0699 × 10
–0
7.1413
50 0.000558 15.2955 5.4885 × 1066.6562
10 0.000560 13.2958 2.5806 × 10–06 16.3311
20
30 0.000579 12.8299 4.2911 × 10
–0
10.5273
50 0.000410 12.6894 5.4674 × 1065.9205
in teof enteffiT s
presented to describe the mss transfer of substrate in
the authorities of School of
ngineering and Information Technology, University
alaysia Sabah for the support in carrying out the re-
. References
] Y. H. Chew, T. L. Chew, M. R. Sarmidi, R. A. Aziz and
rm rapment ciency. here are two model
a
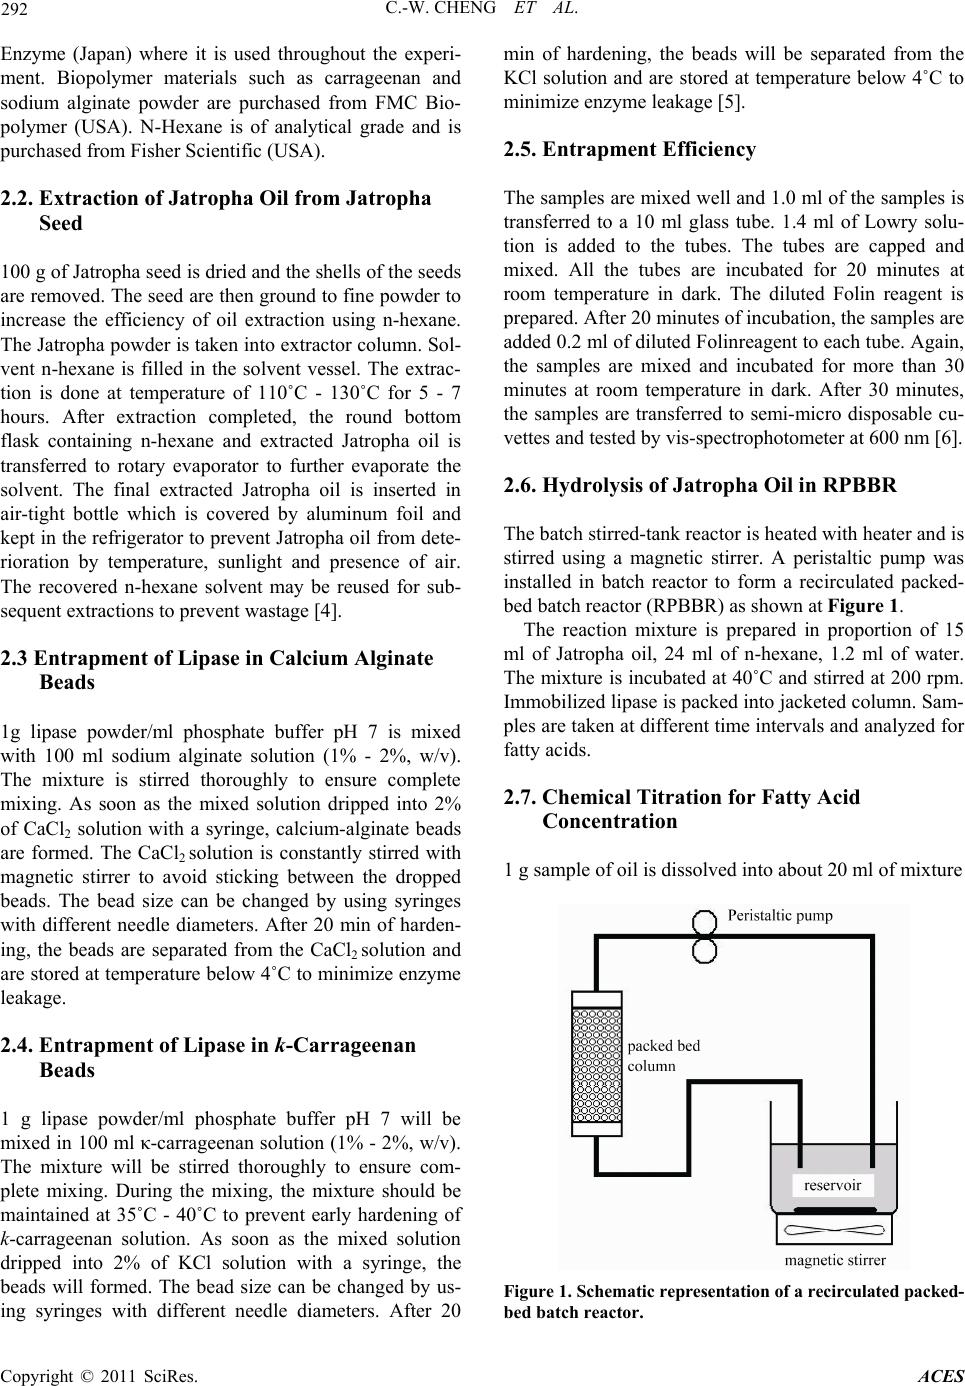
hydrolysis of Jatropha oil by immobilized lipase in a
recirculated packed-bed batch reactor. Based on the
analyses, JD = 1.674 Re–0.4 for alginate and JD = 1.881
Re–0.3 for carrageenan were found to be adequate to pre-
dict the experimental data for external mass transfer in
the reactor in the Reynolds number range of 0.2 to 1.2.
5. Acknowledgements
The Authors are thankful to
E
M
search work.
6
[1
F. Razali, “External Mass Transfer Model for the Hy-
drolysis of Palm Olein Using Immobilized Lipase,” Food
and Bioproducts Processing, Vol. 86, No. 4, 2008, pp.
276-282. doi:10.1016/j.fbp.2008.02.001
[2] N. Dizge and B. Tansel, “External Mass Transfer Analy-
sis for Simultaneous Removal of Carbohydrate and Pro-
tein by Immobilized Activated Sludge Culture in a
Packed Bed Batch Bioreactor,” Journal of Hazardous
Materials, Vol. 184, No. 1-3, 2010, pp. 671-677.
doi:/10.1016/j.jhazmat.2010.08.090
[3] T. Murugesan and R. Y. Sheeja, “A Correlation for the
Mass Transfer Coefcients during the Biodegradation of
Phenolic Efuents in a Packed Bed Reactor,” Separation
and Purication Technology, Vol. 42, No. 2, 2005, pp.
103-110. doi:10.1016/j.seppur.2004.06.008
[4] M. Y. Liauw, F. A. Natan, P. Widiyanti, D. Ikasari, N.
vi, “Entrapment of
Indraswati and F. E. Soetaredjo, “Extraction of Neem oil
(Azadirachta Indica A. Juss) Using N-Hexane and Etha-
nol: Studies of Oil Quality, Kinetic and Thermody-
namic,” ARPN Journal of Engineering and Applied Sci-
ences, Vol. 3, No. 3, 2008, pp. 49-54.
[5] P. D. Desai, A. M. Dave and S. De
Lipase into k-Carrageenan Beads and Its Use in Hydroly-
sis of Olive Oil in Biphasic System,” Journal of Molecu-
lar Catalysis B: Enzymatic, Vol. 31, No. 4-6, 2004, pp.
143-150. doi:10.1016/j.molcatb.2004.08.004
[6] O. H. Lowry, N. J. Rosebrough, A. L. Farr and R. J.
ty, “AOCS Official Me-
t-
9.08.088
Randall, “Protein Measurement with the Folin-Phenol
Reagents,” The Journal of Biological Chemistry, Vol.
193, No. 1, 1951, pp. 265-275.
[7] American Oil Chemists’ Socie
thod Ca5a-40, Free Fatty Acid,” Champaign, , 1993.
[8] M. N. Kathiravan, R. K. Rani, R. Karthick and K. Mu
hukumar, “Mass Transfer Studies on the Reduction of Cr
(VI) Using Calcium Alginate Immobilized Bacillus sp. In
Packed Bed Reactor,” Bioresource Technology, Vol. 101,
No. 3, 2010, pp. 853-858.
doi:/10.1016/j.biortech.200
Copyright © 2011 SciRes. ACES
298 C.-W. CHENG ET AL.
Nomenclatures
ac cross-sectional area of column
am external surface area for mass transfer
C bulk substrate concentration
C1 concentration of Jatropha oil in the reservoir
C2 concentration at the outlet of the packed-bed column to be
circulated back to the reservoir
Cin column inlet substrate (Jatropha oil) concentration
Cout column outlet substrate (Jatropha oil) concentration
Cs substrate concentration at surface of the immobilized cell
dC/dz concentration gradient along the column length
Df diffusivity
dp particle diameter
G mass ux
H height of the column
JD Colburn factor
k “surface” rst-order reaction rate constant
km external mass transfer coefficient
kp apparent rst-order reaction rate constant
Q volumetric ow rate
r reaction (substrate consumption) rate
Re Reynolds number
rm external mass transfer rate of substrate
τ residence time in the reservoir
V volume of the reacting solution in the reservoir
W total amount of immobilized enzyme particles
ε void fraction in a packed-bed
μ uid viscosity
ρ density
ρp particle density
Copyright © 2011 SciRes. ACES