Advances in Chemical Engi neering and Science , 2011, 1, 231-238
doi:10.4236/aces.2011.14033 Published Online October 2011 (http://www.SciRP.org/journal/aces)
Copyright © 2011 SciRes. ACES
Status and Spatial Visualization of Toxic Pollutants
(BTEX) in Urban Atmosphere
Muhannad Mansha*, Anwar Rashid Saleemi, Javed Hassan Naqvi
Department of C hemi c al Engineering, University of Engineering & Technology, Lahore, Pakistan
E-mail: *Muhammad_mansha@uet.edu.pk
Recieved March 3, 2011; revised April 24, 2011; accepted May 3, 2011
Abstract
This is a study of visualization of positive data of by Positive Modified Quadratic Shepard (PMQS) method.
This data visualization tool was implemented successfully in MATLAB using both recorded pollutants levels
and geological coordinates of data acquisition points located in different localities of the metropolitan. These
points were located in/around the potential air emissions sources like vehicular transport, industrial sector
and residential sector dispersed all around the city Field measurements were carried for 12 hour (day time) at
eight points each. An online VOC analyzer was used during field campaign to collect data of hazardous or-
ganic pollutants like benzene, toluene, ethyl benzene, xylene (BTEX). Constant concentration curves were
generated in form of contour plots showing latitude, longitude and spatial distribution of recorded atmos-
pheric pollutants.
Keywords: Spatial Distribution, Hazardous Air Pollutants, Contour Plot, Data Acquisition, Emission Sources
1. Introduction
Urbanization is taking place throughout the world, at an
unpredictable pace. Increasing urban population and
growing levels of industrialization have inevitably led to
a series of environment-related problems, one of which is
worsening air quality. The urban and industrialized cul-
ture has not only increased the sources of air pollution
but also added to types of pollutants in ambient air. Air
pollution is no longer restricted to conventional air pol-
lutants viz. sulphur dioxide and oxides of nitrogen, am-
monia, hydrogen sulphide, respirable particulate matter
and ozone. The various urban activities have added to the
list of ambient air pollutants a class of compounds, Vola-
tile Organic Compounds (VOCs). Environmental Protec-
tion Agency has identified 41 VOCs in ambient air.
Some of them are proven carcinogens and mutagens,
while some are suspected of having human health effects
ranging from carcinogenicity to neurotoxicity. VOCs
also contribute to the formation of ground level ozone
and smog [1,2] and benzene is one such VOC. study on
Air toxics related to vehicular emission [3] establishes
benzene in air as a pollutant strictly related to industrial
activities and automotive emissions. Efforts to reduce the
lead content of the fuel gasoline and to maintain the oc-
tane number has led to an increase in benzene and other
aromatic hydrocarbons in gasoline. An increase in the
concentration of these chemicals in the air as primary
pollutant and as precursors of photochemical smog is an
obvious result [4]. Most of organic pollutants are of great
concern today due to severe short term and long terms
hazardous effects [5]. The common types of these pol-
lutants include Volatile Organic Compounds (VOCs),
Poly Aromatic Hydrocarbons (PAHs) and Polychlori-
nated biphenyls (PCBs). The various aspects of aromatic
compounds such as benzene, toluene, ethyl benzene and
Xylene, present in ambient atmosphere, were studied by
the scientist/researchers all over the worlds. In these
studies, Benzene has identified as carcinogenic when
exposed to high levels in ambient air. A study conducted
in 2004, report high benzene concentrations in two Asian
cities of Bangkok and Manila [6]. In Bangladesh, the
reported ambient benzene concentration was up to
10,560 µg/m3 [7]. Benzene was also identified as major
toxic pollutants in two major Indian cities of Mumbai
(9.39 - 103.6 μg/m3) and Dehli (21 - 26 μg/m3) [8,9].
A number of air quality assessment studies have been
conducted in Lahore by various international/national
organizations such as Pakistan Space and Upper Atmos-
phere Research Commission [10-12], Japan International
Cooperation Agency and Punjab Environment Protection
Department [13]. These studies concluded that there was
M. MANSHA ET AL.
232
N
a threatening situation of deterioration of air quality in the
city. In these studies, the issues of air pollution have been
addressed regarding criteria pollutants as CO, NOx, SO2,
Suspended Particulate Matter (both PM10 & TSP) and
surface ozone O3. There was no information/data avail-
able regarding the toxic air pollutants such as benzene,
toluene, xylene and ethyl benzene. The situation become
more worsens as growing use of benzene [14] in oil (4% -
4.7% by volume) for octane enhancer by all Pakistan na-
tional refineries (Table 1).
1.1. Theoretical Overview of Modified Quadratic
Shepard (MQS) Method
Common visualization methods require an underlying
grid. For visualization of scattered data samples it is re-
quired to approximate the data at the same grid using
some interpolation technique. It is common that the data
samples are positive and representing the quantities for
which negative value is meaningless. For example mass,
volume and density are meaningless when negative.
Modified Quadratic Shepard method is a commonly used
method for gridding purposes. However it does not pre-
serve positivity for inherently positive data sets. Key
requirement for an algorithm to be used for real time
application is its predictable timing behavior. Here an
efficient and deterministic alternative Quadratic Shepard
Method as a solution to the problem of visualization of
multivariate positive data in real time [15].
1.2. An Overview of Modified Quadratic
Shepard (MQS) Method
Modified Quadratic Shepard (MQS) Method is an in-
verse distance weighted method that is based on the ap-
proach introduced by Shepard [16]. Let a set of N
non-negative data values, fi, at associated scattered sam-
pling locations,123 , where
is given. Shepard interpolant is defined as follows;
(,, ,)
iiii
Xxxx 1, 2,,i 
 

1
1
N
ii
iN
i
i
wxf
FX
wx
(1)
where
Table 1. Physical properties of gasoline in pakistan.
Parameter ARL NRL PRL DhodakPARCO
RVP (psia) 7.2 7.3 7.3 6.9 7.4
Benzene (vol%) 4.6 4.2 4.3 3.6 4.0
Total aromatics (vol%) 41 38 39 32 32
 
1
ii
wx dx

 
22
112 2iii
dxx xxx
 
and
F
X is bounded between maximum and mini-
mum values in the data set [17]. Although this interpo-
lant provides one of the solutions to the problem of visu-
alization of positive data; however it is not a suitable
choice for many visualization applications. This interpo-
lant has an unnecessary property that slop at each refer-
ence point is zero.
  

1
1
N
ii
iN
i
i
wxQx
Fx
wx
(2)
Numbers of modifications were suggested to over-
come the drawbacks of the original Shepard’s method.
The most interesting modification for data visualization
perspective is due to Frank and Neilson [18]. They im-
proved continuity of the method by replacing constant
basis function, fi, by the quadratic basis function,
i
QX, with the following characteristics:
1)
ixQ is inverse distance weighted least square fit
to the other data points. This made the method a C1 con-
tinuous method.
2)
i
Qx f
i
This constraint forces
i
Qx to in-
terpolate the corresponding data value.
The resulting interpolant called Modified Quadratic
Shepard interpolation function,

F
X, is defined as
follows:
The basic function
i
QX is defined as follows:


1
2
T
T
iiii i
Qxfg xxxxAxx 
i
(3)
The Matrix, Ai, is Hessian Matrix of the quadratic ba-
sis function and gT is the gradient vector. The modifica-
tions given above not only improve continuity of the
interpolant but also eliminate the problem of missing
data values with the original Shepard method.
The objective of the current study to determine the
baseline concentrations of toxic pollutants (BTEX) and
their spatial distribution by implementing Modified
Quadratic Shepard in urban atmosphere of Lahore (sec-
ond largest city of Pakistan) from various potential emis-
sion sources.
2. Material and Methods
Ground base data of BTEX pollutants was collected us-
ing an online analyzer (VOC Analyzer, Model: 71M-PID,
Environment SA-France) and spatial distribution of the
Copyright © 2011 SciRes. ACES
M. MANSHA ET AL.
Copyright © 2011 SciRes. ACES
233
A MATLAB program for PMQS methods to visualize
the BTEX data was executed successfully. Input data file
contains pollutants concentrations (in μg/m3) and geo-
logical coordinates (latitude and longitude) and this data
file (in MS-Excel format) is loaded in the developed
program. This program/model generate distribution plot
in form of contour plot which consists of constant con-
centration curves.
pollutants was studied by PMQS method implemented in
MATLAB. The implementation of this method in
MATLAB to visualize the collected data was novelty of
this part of our urban air quality study of metropolitan
Lahore.
The analyzer measures the concentrations of hazard-
ous air pollutants including benzene, toluene, ethyl ben-
zene, xylene by default configurations and there were
options to measure the concentrations of other pollutants
such as 1-3 Butadiene, Cyclohexane, n-heptane, n-pen-
tane, Styrene by setting manual configurations. The ana-
lyzer collect the air sample after 15 minutes (selected) in
cycle, analyze it and give the measurements on display
or could be saved in computer directly from the analyzer
in real time. The ambient concentration data of these
compounds were collected at eight different sites as
shown in Figure 1 and other relevant information is gi-
ven in Table 2.
Data quality assurance was most essential part of field
measurements. Data quality was assured by two ways, 1)
by instrument calibration and before commencing field
campaign, analyzer was calibrated by certified Zero Air
Gas having concentrations of 0.01 ppb and Span Air Gas
with concentration of 35 ppb. The analyzer read concen-
trations both calibration gases as 0.02 ppb and 34.99 ppb
respectively. Nitrogen gas (having purity of GC-grade;
99.999%) from M/s BOC Pakistan, was used as carrier
for the VOC analyzer. Moreover, the instrument has built
Figure 1. Pakistan map showing metropolitan lahore (study area).
Table 2. Selected locations and their geological coordinates.
Location Geological Coordinates
Sr. No. Location ID Site Location Site Surroundings/Major
Possible Emission Sources Latitude Longitude
1 L-1 Kotlakhpat Ind. Area Industry 31°27'36.05"N 74°18'33.03"E
2 L-2 Model Town Residential 31°28'36.50"N 74°19'16.19"E
3 L-3 Chowk Yateem Khana Vehicular Traffic 31°31'55.36"N 74°17'16.01"E
4 L-4 Azadi Chowk Vehicular Traffic 31°35'12.97"N 74°18'33.82"E
5 L-5 Eng. University Vehicular Traffic 31°34'46.93"N 74°21'21.89"E
6 L-6 Canal Road Vehicular Traffic 31°28'57.95"N 74°17'32.75"E
7 L-7 Air Port Residential 31°31'38.26"N 74°24'28.39"E
8 L-8 Ichra Vehicular Traffic 31°31'30.32"N 74°19'27.97"E
M. MANSHA ET AL.
Copyright © 2011 SciRes. ACES
234
in capability of calibration (internal calibration) during
operation. 2) Data quality was ensured through field data
log books, site visitors log book.
3. Results and Discussion
The measurements were carried out at 5 - 7 feet height
from ground at each location. The online analyzer collect
air sample for 15 minutes alternatively in two sampling
tubes. The collected sample was analyzed through gas
chromatographic technique and detected by PID detector
based retention time of each compound. Fifteen minute
data of each measuring pollutants was plotted in time
scale variation as shown in Figures 2-9. The temporal
variation plot of each pollutant indicates the behavior
during the day & night under the prevailing meteoro-
logical conditions at each site. It was observed that the
levels of each pollutants increases during the mid day
when the traffic in the city is at full swing. This also in-
creases the atmospheric ozone due to the reaction of
BTEX compounds and oxides of nitrogen in the presence
of sunlight. The average meteorological conditions are
plotted as wind rose as shown in Figure 10.
The maximum levels of benzene, ethyl benzene and
Xylene were 53.17 μg/m3, 89.10 μg/m3 and 19.6 μg/m3
respectively at Kotlaphpat Ind. Area where as Toluene
was of 33.17 μg/m3 at Ichra. The selected monitoring
sites were representatives of possible emission sources
(Table 2) like vehicular transport (Chowk Yateem
Khana, Azadi Chowk, Ichra and Engg. University), in-
dustrial sector (Kot Lakhpat Industrial Area) and resi-
dential sector (Canal View Housing Colony, Model
Figure 2. Temporal variation of BTEX at Kotlakhpat (L-1).
Figure 3. Temporal variation of BTEX at Model Town (L-2).
M. MANSHA ET AL.
235
Figure 4. Temporal variation of BTEX at Chowk Yateem Khana (L-3).
Figure 5. Temporal variation of BTEX at Azadi Chowk (L-4).
Figure 6. Temporal variation of BTEX at Engg. University (L-5).
Copyright © 2011 SciRes. ACES
236 M. MANSHA ET AL.
Figure 7. Temporal variation of BTEX at Canal Road (L-6).
Figure 8. Temporal variation of BTEX at Airport (L-7).
Figure 9. Temporal variation of BTEX at Ichra (L-8).
Copyright © 2011 SciRes. ACES
M. MANSHA ET AL.
Copyright © 2011 SciRes. ACES
237
Figure 12. Spatial distribution of toluene over lahore.
Figure 10. Meteorological data (Temp, Humidity & Wind
Speed) of five monitoring site measured by Mini Met Sys-
tem.
Town & Air Port). The maximum levels of the pollutnats
are given in Table 3.
Plots in Figures 11-14 show the spatial distribution of
Benzene, Toluene, Ethyl benzene and Xylene respect-
Table 3. Maximum levels of btex compounds at measuring
sites.
Recorded Measurements (μg/m3)
Location
ID
Location
Name BenzeneToluene Ethyl
benzene Xylene
L-1 Kotlakhpat Ind.
Area 53.17 19.2 55.0 17.7
L-2 Model Town 8.1 3.5 10.7 4.7
L-3 Chowk Yateem
Khana 32.6 13.9 12.0 8.5
L-4 Azadi Chowk 38.9 21.3 36.10 8.5
L-5 Engg. University 15.4 8.1 17.1 8.9
L-6 Canal Road 12.3 13.9 13.7 0.0
L-7 Air Port 4.3 2.6 3.7 2.7
L-8 Ichra 44.2 33.17 20.1 14.15
Figure 13. Spatial distribution of ethyl benzene over lahore.
Figure 14. Spatial distribution of xylene over lahore.
tively. In these plots, Latitudes and Longitudes of se-
lected locations were taken in X-axis and Y-axis respec-
tively. The lines in the contour plots show he constant
concentration line. There is narrows space between high
value concentration lines (for each of BTEX compounds)
in surrounding of Location L-1 (Kotlakhpat Ind. Area)
with Latitude of 31°27'36.05"N and 74°18'33.03"E. This
Figure 11. Spatial distribution of benzene over lahore.
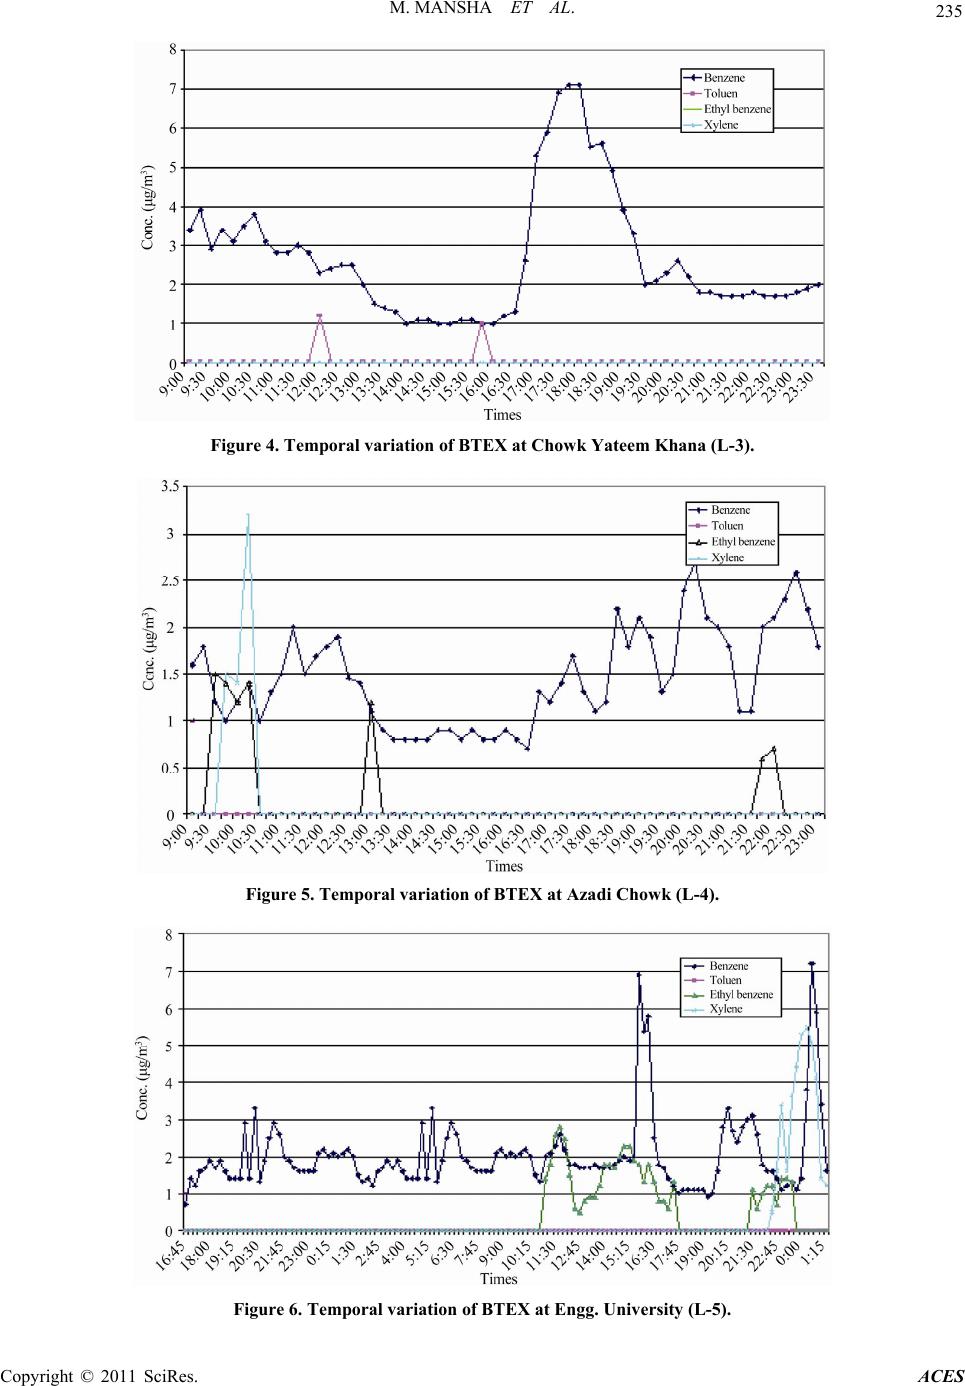
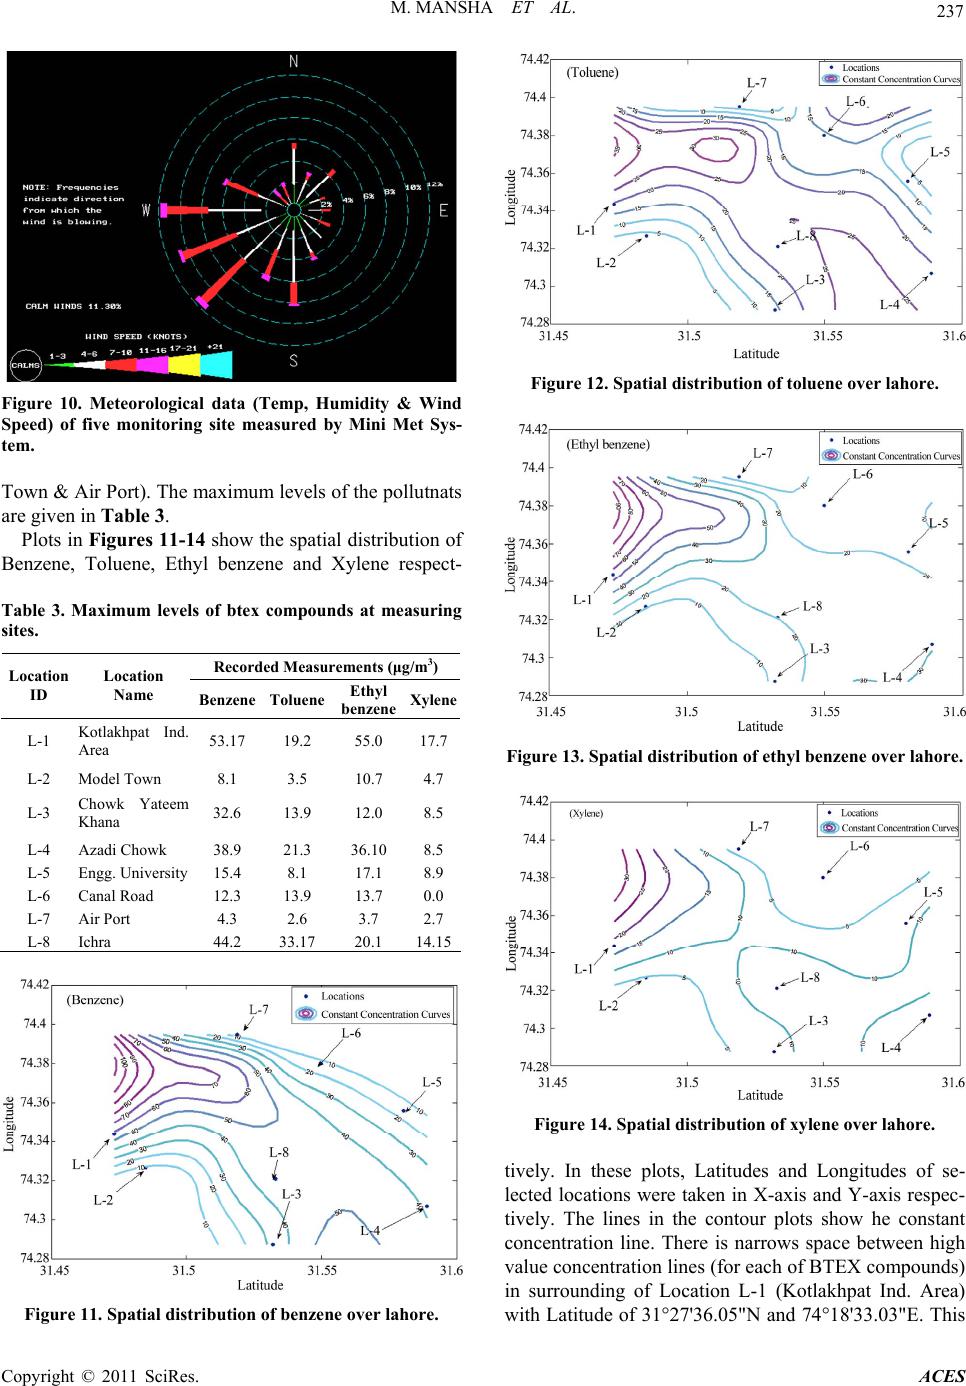
238 M. MANSHA ET AL.
may be correlated with prevailing meteorological condi-
tions.
4. Conclusions
The recorded data reveals that Benzene, Toluene, ethyl
benzene and Xylene were present at the selected loca-
tions. MATLAB developed scheme for Modified Quad-
ratic Shapered Method was successfully run for the Con-
strained Visualization of BTEX spatial distribution.
5. Acknowledgements
The authors are thankful to Higher Education Commis-
sion (HEC) of Pakistan for sponsoring this study through
Indigenous PhD Scholarship scheme.
6. References
[1] Y. Verma, et al., “Biological Monitoring of Exposure to
Benzene in Traffic Policemen of North India,” Industrial
Health, Vol. 41, No. 3, 2003, pp. 260-264.
doi:10.2486/indhealth.41.260
[2] J. Lynch, T. Bernath, et al., “Benzene in the Workplace,”
American Industrial Hygiene Association, Vol. 41, No. 9,
1980, pp. 616-623. doi:10.1080/15298668091425392
[3] US Environmental Protection Agency Office of Mobile
Sources (USEPA), “Motor Vehicle Related Air Toxic
Study EPA-420 (R-93-005),” US Environmental Protec-
tion Agency Office of Mobile Sources, Ann Arbor, 1993.
[4] S. E. Edgerton, et al., “Determination of Aromatic Hy-
drocarbons in Urban Air of Rome,” Atmospheric Envi-
ronment, Vol. 31, No. 4, 1989, pp. 557-566.
[5] T. R. Lewis and W. J. Moorman, “Long Term Exposure
to Auto Exhaust and Other Pollutant Mixtures,” Archives
of Environmental Health, Vol. 29, No. 2, 1974, pp. 2-6.
[6] A. Srivastava, et al., “Ambient Levels of Benzene in
Mumbai City,” International Journal of Environmental
Health Research, Vol. 14, No. 3, 2004, pp. 215-222.
doi:10.1080/0960312042000218624
[7] A Hussam, et al., “Solid Phase Micro Extraction: Meas-
urement of Volatile Organic Compounds (VOCs) in
Dhaka City Air Pollution,” Journal of Environmental
Science and Health, Part A, Vol. 37, No. 7, 2002, pp.
1223-1239. doi:10.1081/ESE-120005982
[8] P. K. Srivastava, et al., “Ambient Levels of Benzene and
Other Aromatic Hydrocarbons in Mumbai,” Proceedings
of Nature on Environment, B’lore Univ, June 2000, pp.7-
10.
[9] D. K. Biswas and G. D Pandey, “Strategy and Policy
Adopted in Air Quality Management in India,” Proceed-
ings of Better Air Quality in Asian and Pacific Rim Cities
(BAQ 2002), Hong Kong, 16-18 December 2002.
[10] G. Badar, et al., “Development of Baseline (Air Quality)
Data in Pakistan,” Environmental Monitoring and Asse-
ssment, Vol. 127, No. 1-3, 2007, pp. 237-252.
doi:10.1007/s10661-006-9276-8
[11] L. Husain, et al., “Application of the 2
4
SO /Se Tracer Te-
chnique to Study SO2 Oxidation in Cloud and Fog on a
Time Scale of Minutes,” Chemosphere, Vol. 54, No. 2,
2004, pp. 177-183. doi:10.1016/S0045-6535(03)00531-9
[12] S. Hameed, et al., “On the Widespread Winter Fog in
Northeastern Pakistan and India,” Geophysical Research
Letters, Vol. 27, No. 13, 2000, pp. 1891-1894.
doi:10.1029/1999GL011020
[13] N. F. Qadir, “Air Quality Management in Pakistani Cities:
Trends and Challenges,” Better Air Quality in Asian and
Pacific Rim Cities (BAQ 2002), Hong Kong, 16-18 De-
cember 2002.
[14] United Nations Development Program Pakistan (UNDP)/
World Bank Energy Sector Management Assistant Pro-
gram, “Pakistan Clean Fuels,” Pakistan, October 2001.
[15] G. Mustafa, et al., “Gridding Multivariate Positive Data
for Real Time Visualization,” Proceedings of the Interna-
tional Conference on Computer Graphics, Imaging and
Visualization, Sydney, 26-28 July 2006, pp. 496-502.
[16] D. Shepard, “A Two-Dimensional Interpolation Function
for Irregularly Spaced Data,” Proceedings of 23rd ACM
National Conference, New York, 1968, pp. 517-523.
doi:10.1145/800186.810616
[17] W. J. Gordon and J. A. Wixom, “Shepard’s Method of
‘Metric Interpolation’ to Bivariate and Multivariate In-
terpolation,” Mathematics of Computation, Vol. 32, No.
141, 1978, pp. 253-264. doi:10.2307/2006273
[18] R. Franke and G. Neilson, “Smooth Interpolation of
Large Set of Scattered Data,” International Journal of
Numerical Methods in Engineering, Vol. 15, No. 11,
1980, pp. 1691-1704. doi:10.1002/nme.1620151110
Copyright © 2011 SciRes. ACES