 Open Journal of Forestry 2011. Vol.1, No.2, 11-26 Copyright © 2011 SciRes. DOI: 10.4236/ojf.20 11.12003 Community Structure, Diversity, Biomass and Net Production in a Rehabilitated Subtropical Forest in North India Bajrang Singh1, Karunakar Prasad Tripathi2, Kripal Singh1 1National Botanical Research Institute, Council of Scient ific and Ind ustrial Resea rch, Rana Pratap Marg, Lucknow, India; 2Dolphin (PG) Institute of Biomedical a nd Natural Sciences , Manduwala, Dehradun, India. Email: {bsingh471, tripa thikp2001}rediffmail.com, kripalsingh04@gmail.com Received Augus t 20th, 2011; revised October 19th, 2011; ac cepted October 28th, 2011. Gangetic alluvial plain in north India constitutes significant proportions of barren sodic lands. A representative site, where afforestation was carried out during 1960s to rehabilitate the site under forest ecosystem, was se- lected t o as ses s th e r est ora t i on su cc ess . Th ree st an d s (S 1, S2, an d S 3) wer e sel ec t ed in a semi -natural subtropical forest at Banthra, Lucknow (26˚45'N, 80˚53'E) on the basis of different vegetation morphology and basal area gradient. Species composition and their growth forms were studied in overstory, understory and ground layer vegetation, in which dominants were assorted. Among the dominants few species were common in the three stands as also in different strata, which perhaps indicate their natural regeneration. Classification of individuals among the different si ze c la ss es i nd ica t ed “L” shape distribution in which most of the individuals remained con- fined in youn ger group s. Bi omass increas ed from the stan d S1 to S3 stand in overstory, a nd vi se versa for under- story. St and S2 consi sted of pred ominan ce of groun d layer bi omass over t he oth er stands . Bioma ss allocation in different plant components differed significantly between the overstory and understory for aerial woody com- ponents (stem and branch). Annual litter fall did not differ significantly among the stands, where as fine root biomass (up to 45 cm soil depth) decreased from S1 to S3 stands. Rainy and summer seasons contributed to two-third proportion of total annual fine root production. The state of this rehabilitated forest when compared with the degraded and reference forest of the region indicated that structural complexity, biomass and production leve l s hav e been achieved to 70% of the reference fores t site even after having a different speci es compositio n . Keywords: Diversity, Community Structure, Concentration of Dominance, Biomass, Production, Litter, Fine Root Introduction Tropical forests are disappearing at an alarming rate of 13.5 million hectare per year globally Kobayashi (2004). In India about 20% of the geographical area is under forest in which tropical forests contribute nearly 83% of the forest area. Almost half of t he forest area is classified as degraded forest with poor population density and species abundance. Deforestation and forest degradation are widely recognized as major threats to environmental stability, economic prosperity and social welfare and also to perform the statutory function of biodiversity con- servation and ecos ystem servi ces. Often th e forest management considers primarily commercially important monoculture spe- cies and rehabilitation of site for ecosystem/landscape man- agement/species conservation or societal services assumes sec- ondary importance. When the degraded and desolated lands do not turn out an economic yield, many sites are abandoned where natural succession proceeds and over a period of time several b io ti c communit ies co lo nize th ere an d p erform a vari et y of ecosystem function (Jha & Singh, 1991). The widespread degradation of alluvial soil in the Indo-Gangetic plain s affected by varying degree of sodicity or salinity has received priority attention for afforestation during past few decades. It has been emphasized in the Indian forest policy to enhance the forest cover, biodiversity conservation and to provide the multiple goods and services to the ever-increasing human population of the country. Forest area is shrinking day by day and new forests are not being developed proportionally. It is estimated that about 53% of the total geographical area of the country is sub- jected to erosion and land degradation problems. Intensive af- forestation efforts are required to rehabilitate such sites under productive forest ecosystems. Both exotic and native species may be planted to rehabilitate degraded lands depending on site conditions (Singh et al., 2002; Dat ta & Agar wal, 2003; Singh et al., 2004; Singh & Singh, 2004; Shukla et al., 2011). Natural succession remains arrested on sodic land s, and does not proceed automatically without some anthropogenic inter- ventions. As a consequence, these sites do not have any sig- nificant vegetation growing on them except sporadic patches of some salt tolerant grasses. Creation of new forest on barren sodic land is therefore a critical task due to several soil con- straints restricting the growth and development of plants. Mainly, an exotic Prosopis juliflora has been planted success- fully (Bhojwaid & Timmer, 1998) which showed a fairly good adaptability to generate fuel wood quickly, but the drawback with this invasive alien species (exotic) is that Prosopis julifora does not accommodate the native species in their niche and overrides on the native species diversity. There is strong evi- dence that plantations can facilitate forest succession in their understories through modification of both physical and bio- logical site conditions. Changes in light, temperature and mois- ture at the soil surface enable germination and growth of seeds transported to the site by wildlife and other vectors from adja- cent forest remnant s. I t h as been ob served t hat at th e stand level mixed speci es performed well for volu me, basal area, biomass, and carbon sequestrations in comparison to pure monoculture stands (Piotto et al., 2003ab; Ali ce et al., 2004; Petit & Montaz- inimi, 2004, 2006). Economically viable and adoptable tech- nology for afforestation of sodic land has been under experi- mentati on for a lo ng time (Shar ma et al., 1992). Sandhu & Ab-  B. SING H ET AL. rol (1981) studied the method of site preparation using augur hol es and effect of establi s hment on Eucalyptus tereticornis and Acacia nilotica on sodic soil sites. Later on, these plantations suffered with the girdling, stress growth, and poor yield. Sodic soils contain exchangeable sodium in excess quantity which interferes with the growth of most crop plants and trees. The pH of such soils usually ranges from 8.5 to 10, which disturbs the ionic equilibrium of soil solution limiting to the growth of plants (Kelley, 1951). Such soils are generally poor in organic matter and nitrogen contents (Abrol & Bhumbla, 1971; Agraw- al & Gupta, 1968; Khanduja et al., 1986; Pandey et al., 2011) and therefore its enhancement is vital for better growth and productivity (Shukla & Misra, 1993; Singh, 1996, 1998). Addi- tionally the encrustation of calcium carbonate gravels and iron granules into a hard cemented bed in sub soil impedes not only root developments but water permeability too. Such characte- ristic properties resulting in root deformations, growth reduc- tions and ultimately significantly lower yields do not support and pro- mote the extension of production forestry on sodic lands in commensuration with their inputs (Gupta & Abrol, 1990). However, (Abrol & Joshi, 1986) reported the economic viability of utilizing highly alkaline soil for the plantations of Acacia nilotica, Eucalyptus tereticornis but it could not gather enough momentum due to high initial investments and a large gestation period. Afforestation with salt tolerant species was initiated from 1980 onwards (Sissay, 1986; Totey et al., 1987; Sharma, 1988). The afforestation trials those have been succeeded led to the identification and selection of tolerant species in situ on the basis of their growth performance (Khan & Yadav, 1962; Pan- dey, 1 96 6; Sr iva sta va, 1970 ; Yadav & Si n gh, 1970; Ahuja et al., 1979; Yadav 1980; Khoshoo 1987). Tolerance limit of several species was evaluated for sodic soils in pot culture experi- ments (Singh et al., 1994). Performance of trees at varying sodicity levels was also observed (Ashwathappa et al., 1986). Since t he characteristi cs of salt affected soils vary greatly from place to place ranging from low to high ESP (exchangeable sodium percent) tolerant species were assorted accordingly (Yadav & Singh, 1970; Toth, 1981). Tolerance of Dalbergia sissoo in varying sodicity conditions was studied at different sites (Singh et al., 1990). Tree species ar e supp osed to be more tolerant to adverse soil conditions, particularly Prosopis and Acacias (Garg & Jain, 1992). Prosopis juliflora can survive well on the calcarious soils which h ave on the average a maxi- mum pH value of 9.5. Acacia nilotica was also found to be more resistant to soil salinity and sodicity (Yadav & Sin gh, 1970; Garg & Khanduja, 1979; Tomar & Yadav, 1980; Singh et al., 1986). Abrol (1986) suggested that, apart from identifying appropriate species and cultural practices, there is a need to evaluate the social and economic consequences of planting on saline land with fuel and forage species. A standardized silvi- cultural technology for afforestation on sodic lands was devel- oped thereafter (Chaturvedi, 1985; Prasad & Sharma, 1990). Earlier studies have been limited to the growth observations in height and diameter of the plants. Though some account is available for biomass and productivity of few trees grown on sodic soils (Chaturvedi, 1 985; Dogra , 1989; Singh, 19 91, 1998 ; Chaturvedi et al., 1991, Chaturvedi & Behl, 1996; Jain and Singh, 1998) that too pertains to juvenile stage of plant growth with a very little applicability to understand the community development process on a degraded land. Many previous trials failed to rehabilitate the sodic bare lands under tree cover due to lack of proven technology, proper financial support and dedi cation (Yad av, 1975, 1980; Abrol, 19 86). A man-made for- est developed on sodic land at Banthra Research Station of the National Botanical Research Institute, Lucknow, India is the oldest successful endeavor of afforestation with multiple spe- cies. Very little information is available to our understanding in restoration of sodic land under forest ecosystem. Srivastava (1987) described the occurrence of species in this forest in which some were introduced, while others invaded naturally and colonized by the induced succession. Verma et al. (1982) reported that a mixed canopy cover was more effective in the reduction of pH than that of individual species. This is a good indication to diversify the monocultures with various indige- nous species which also aid to counter the effects of epidemic and al lelopathy. A gener alized impact of soil reclamation in this forest was assessed by (Singh, 1996, 1998). The tolerant tree and shrub species made the soil hospitable for less tolerant species. Thus a portion of land that was once totally barren and desolate is now recognized as a functional forest ecosystem with a top story of trees, middle story of small trees and shrubs; and a ground layer of herbs and seedlings of the perennials. Structure and composition of overstory trees determine the understorey vegetation diversity and their com- plexity (Barbier et al., 2008). Basic changes in demography, tree size and growth comprise classic descriptors of stand de- velopment (Brinkley, 2004). Efforts were made to observe the relationships between vegetation productivity and species di- versity (Sculze & Mooney, 1993; Huston, 1997; Chapin et al., 2000; Loreau et al., 2003; Liang et al., 2007). Such forest in- ventories are useful to rehabilitate the other barren sites in an efficient way as well as to ensure a desired composition and structure of the developing forest which could be self sustaina- ble even after rational extraction or mild disturbances from environmental perturbations. This study was carried out in a 40-yr-old rehabilitated forest on sodic land to identify the development of community struc- ture and productivity levels, their diversity, dominance and compatibility with natural forest of the region. An attempt was made to characterize the various species performance and their interrelations in the constitution and development of new “bio- tope”. Methods and Materials Site The forest was established on abandoned sodic soil during the 1960s at Banthra, Lucknow, situated in a subtropical, se- miarid region of north India (26˚45'N, 80˚53'E). Geographically, this region is classified as Gangetic alluvial plains of the Uttar Pradesh state due to transported deposition of minerals from the Himalayan rocks by the Ganga River. A large tract of this re- gion consists of cultivated land interspersed with barren sodic land measured about 1.3 million hectares (Figure 1). The pre- historic natural forests in this region were sparse and most of them were r eplaced by Sal (Shorea robusta Gaertn. f.) an d Teak (Tectona grandis L. f.) forests in the middle of the nineteenth century. A few patches of those forests are still available in Katarni aghat Wild life Sanctu ary, in Behrai ch (lat 27˚55'N, lon g 81˚25'E) district of U.P. The natural dry tropical forests of Va- ranasi (lat 24˚55'N, long 83˚3'E) and Mirzapur (lat 24˚55'N, lon g 82˚32'E) were compared as degraded forest sites. Average annual rainfall at Lucknow ranged from 840 to 980 mm during the past 10 years, which is slightly less than that at the  B. SING H ET AL. Figur e 1. Distribution of plant population in different size classes in three vegetation layers in three stands of 40 yr old man-made forest. Overstory classes Girth (cm): 1 =20 - 40, 2 = 40 - 60, 3 = 60 - 80, 4 = 80 - 100, 5 = 100 - 120, 6 = 120 - 140, 7 = 140 - 160, 8 = 160 - 180, 9 = 180 - 2 00, 10 ≥ 200. Understory classes Diameter (cm): 1 = 0 - 1, 2 = 1 - 2 , 3 = 2 - 3, 4 = 3 - 4, 5 = 4 - 5, 6 = 5 - 6 , 7 = 6 - 7, 8 = 7 - 8 , 9 = 8 - 9, 10 = 9 - 10, 11≥ 10. Ground layer classes Height (cm): 1 = 0 - 10, 2 = 10 - 20, 3 = 20 - 30, 4 = 30 - 40, 5 = 40 - 50, 6 = 50 - 60, 7 = 60 - 70, 8 = 70 - 80, 9 = 80 - 100, 10 = 100 - 110, 11 ≥ 110. reference si te (1057 mm/year). More than 80% of the precipita- tion occurs in the monsoon season (July-September), and the remainder of the year is dry. Average minimum and maximum temperature differ significantly from winter (8˚C, night; 20˚C, day) to summer (27˚C, night; 40˚C, day), indicating a seaso- nally distinct climate. Average relative humidity was 63% dur- ing the last 10 years. The site soil is an Inseptisol (Typic Natrustalf) with silty clay loam texture. A compact layer of indurated pan comprising CaCO3 gravels and iron granules exists between 0.4 m and 0.8 m depths in these sodic soils. Structural degradation of the heavy (high bulk density) and impervious soil leads to crusting in winters and waterlogging condition during rainy seasons. During summer, efflorescence of NaCO3 salt occurs as a pow- dery layer on the soil surface. Consequently, suspended parti- culate matter is quite high in the atmosphere during the day. The soil was characterized by a high pH (>10) and exchangea- ble sodium percentage (ESP) (>50) and low electrical conduc- tivity (EC) (<1.0 dS/m) and organic carbon content (<0.2 %) prior to planting (Garg , 1987). Carbonate and bicarbon ate of Na  B. SING H ET AL. and Ca were the dominant ions. When the content of soluble salts (EC ) is lo w and exchangeab le Na h igh , the physical co nd i- tion of the soil is usually unfavorable for the tillage as well as establishment and growth of desired plants. As a consequence, only a few grasses, viz Sporobolus and Desmostachia, are found sporadically under natural conditions. Attempts were made to rehabilitate such barren land through afforestations as well as other land use systems over an area of about 50 ha ac- quired during the 1960s. The entire area was demarcated with barbed wire fencing and designated as Banthra Research Sta- tion (BRS). Some of the native tree species commonly occur- ring in tropical forests of north India (Acacia nilotica, Albizia lebb eck, Albizia procera, Bauhinia variegata, Ficus bengalen- sis, F. rumphii, Syzygium heyneanum, Syzygium cumini, Ter- minalia arjuna, Derris indica) were planted in plantation pits of 1 m3 that had been filled with a mixture of soil, compost ma- nure, and decomposed leaf litter in 2:1:1 proportion on a 5-ha site. They were also planted along the marked boundary of the BRS. The initial population density was around 1,000 trees/ha. A drainage channel 1.5 m deep and 2 m wide was developed around the plantation site to prevent water logging, which was intensively observed during the rainy season for a proper drai- nage of sta gnating water. Mortality during the initial years was greater th an 50 %, and trees were rep lanted in consecuti ve years. Several species invaded and colonized this area over time thr ough natural succession process due to changes in microre- lief. Seed dispersal and natural regeneration of trees and many other species gradually extended to cover about 17 ha of total forest area in the 2010. Vegetation Analysis Three stands were selected in this forest according to gross morphology and a basal area gradient within the original 5-ha revegetated area. Sample plots, each 1 ha, were marked in all three st and s deno ted as S 1, S2 , and S 3. Vegetat io n an alysis was carried out on belt transects (10 m wide). The method and qua- drat size were standardized using a species–area- curve rela- tionship. Thirty-four quadrats of 10 × 10 m along three tran- sects spaced 10 m apart were laid out contiguously in each stand. Plants were enumerated and measured for growth para- meters. Ninety-five percent of the species were identified through the use of the National Botanical Research Institute's herbarium records. Girth of trees (>20 cm·gbh) was measured at 137 cm above the ground for overstory species, whereas diameter of young trees and shrubs occupying less than 10 cm dbh was measured 50 cm above the ground, using an electronic vernier caliper. These were classified as understory species. Height of small seedlings less than 50 cm and of herbaceous species were measured and p laced in the ground layer co mmu- nity. Species structure (frequency, density, abundance, basal area/cover, importance value index (IVI), etc.) was determined from the field data (Misra, 1968). The cross-sectional area of the stem at measured levels is the basal area of all woody spe- cies. Leaf area cover (basal cover) for the ground layer was computed by specific leaf area ratio, which is defined as area per unit weight of the leaf (Misra, 1968). Species having great er than 10 IVI or >10% of the total basal area were considered dominant species i n each stratum. Species Diver s i ty Index Species diversity index (H) for overstory, understory, and ground layer vegetations were determined separately from the Shannon Wiener’s information function (Shannon & Weaver, 1963). where: ni = importance value for each species, N = total of importance values pi = importance probability for each species = ni/N Concentration of Dominance Concentration of dominance (Cd) was measured by Simp- son’s index which is also known as index of dominance (Simpson’s 1949). Index of dominance (Cd) = Σ (ni/N)2 where: ni = importance value for each species, N = total of importance value Equitabi lity or Evenness (e) Equitability refers to the degree of relative dominance of each species in that area. Following Pielou (1966), equitability or eveness index was calculated as: Equitability (e) = H/logs Where: S = number of species and H = Shannon Wiener index Productivity Assessment All the stems were classified in 7 girth/diameter classes in overstory and understory vegetations and 7 height classes in ground layer. Overstory biomass was estimated by a common regression equ ation alr eady develo ped fro m 13 tree sp ecies in a MAB project at BHU, Varanasi, because the permission for harvesting of green trees was not granted by the UP Forest Department in view of the felling restrictions on the trees planted under restoration programmes. Harvesting of sample plants of the understory could be possible and therefore three representatives from each size classes were sampled for stem, branch, and leaf and root biomass. Species of ground layer were sampled according to the height classes for stem, leaf and root components. Regression equations were developed with the help of data of sample plants for diameter (cm) on “x” axis and oven dry weight (g) of the particular component on “y”. The form of regression was: ln Y = a + b ln x A software programme “SYSTAT 9.0 SPSS” was used for regressions. With the component biomass, total biomass of all species p er unit ar ea was comput ed as per th eir respecti ve pop- ulation density. The ground layer species biomass was com- puted with their equation where “x” variable was heights of plant in cm. Net productions were obtained as the differences i n biomass during the two consecutive years (2007 to 2009. Bio- mass of ground layer was assumed to net production in view of their little contribution in total forest ecosystem productivity. Litter Litter fall was collected monthly in 1 m2 trays during the year. Four trays were placed in each of the three stands. Com- ponents of litter were separated out as leaf, twig, flower-fruits and bark. Apart from, six quadrats of 1 m2 were laid on under- neath each stand to sample forest floor litter layers as L, F and H fractions. Fine Root Fine root biomass was extracted by wet sieving of ten soil cores o f 100 cm3 in each stan d at two dep ths (0 cm - 15 cm and 15 cm - 30 cm) in five seasons. Similarly fine root production was estimated by establishment of root free in-growth cores in each season and extraction of root by wet sieving. These roots  B. SING H ET AL. were classified into three diameter classes (<0.5, 0.5 mm - 1 mm and 1 mm - 2 mm). The li ve and dead r oots wer e separated on the basis of gross morphology and degree of cohesion be- tween cortex and periderm according to Vogt and Persson (1991). Both f rac ti ons w e re ov e n-dried at 80˚C to cons ta nt weight . Results Community Structure and Dive rsity There were only a few species which contributed more than 10% of the total basal area in each stand; therefore, dominants were assorted including >10 IVI (Table 1 ). On the basis of IVI and relative basal area, S1 stand constituted more dominant species in comparison to other two stands. Among the domi- nants few species were common in all the three stands such as Syzygium cumini, Syzygium heyneanum, Streblus asper, Azadi- rachta indica, Albizia lebbeck in overstory vegetations. In un- derstory the common dominants among the stands were Lan- tana camara, Streblus aspe r, Syzygium cumini. Besides, some of th e species were found common in all th e three vegetation strata viz. Leucaena leucocephala, Sterculia alata, Streblus asper, Syzygium cumini, Syzygium heyneanum. But Clerodendrum vescosum, Ichnocarpus frutescens, and Putranjiva roxburghii remained confined to under stay & ground layer vegetation. Species distribution pattern and their natural associations provide the clues for rehabilitation of barren sodic land under forest ecosystems. Basal area increased from S1 to S3 stand in overstory, whereas in understory it was decreased in same order. In ground layer, maximum basal cover was found in S2 stand. In overstory vegetation of S1 stand, dominant species covered 44.2% of the total basal area which indicates that o ther species have no less importance in organization of plant communities occup ying rest of the 56% of the total basal area. In S2 stand other species contributed relatively less with the proportions of dominants contributing to 72% of the total basal area of overs- tory vegetation. S3 stand had almost similar value to that of S1 stand. In S1 stand, Albizia lebbeck and Azadirachta indica had 30% of the total basal area. In S2 stand Albizia lebbeck, Syzy- um heyneanum and Terminalia arjuna hold about 51% of the total basal area. In S3 stand Albizia lebbeck, Albizia procera, Ficus rumph ii consisted of about 45% of the total basal area. In understory vegetation, Leucaena leucocephala had greatest IVI in S1 stand. Dominant understory vegetation constituted 61%, 72% and 52% of the total understory basal area of the respec- tive S 1, S2 and S3 s tands. In gr ound layer vegetatio n, S1 sta nd had more dominant species in comparison to other stands with greatest IVI in S2 stand. In S1 stand ground layer vegetation of the dominants occupied 87% of the total basal cover. S2 and S3 stands had 89% and 95% basal cover of dominants. Population s iz e of ov e rs tory a nd understory trees was largest in S1 stand, whereas S2 stand consisted of the greatest number of individuals of the ground layer (Table 2). However, population size on the basis of number of individuals per unit area does not contribute much in ecosystem function, as it does not give any additional weight to the size of individuals. Basal area is a composite function of the number and size of the individuals Table 1. Class ific a tion o f s pe c i e s as a perce nt of t he total s peci es r epres e nte d by thei r populati o ns from un it to thous a nd s in respec tive vegetation st rata. Strata Unit Tens Hundreds Thousands Total Overstory 37 38 23 2 100 Understory 36 36 23 5 100 Ground layer 25 37 25 13 100 Table 2. Population size and plant diversity in a 45-yr old r e h a b il itat e d f orest co m mun ity de veloped on bar ren so dic la n d. Parameter Form Stands Mean SE S1 S2 S3 Population density (No. ha–1) Overstory 610 517 535 554 ± 28 Understory 5554 2871 2759 3728 ± 913 6813 ± 4558 Basal area (m2·ha–1) Overstory 25.8 30.5 33.6 29.9 ± 1.9 Understory 7.25 3.13 2.31 4.20 ± 1.2 111.6 ± 66.4 Spec ies ri c h ness ( n umber ) Overstory 35 27 28 30 ± 2 Understory 38 40 30 36 ± 1.6 15 ± 0.47 Equitability (e) ± Understory 0.72 1.06 0.99 0.9 ± 0.08 0.7 ± 0.08 Shannon Wiener’s index (H) ± Understory 2.65 3.80 3.35 3.3 ± 0.27 1.8 ± 0.19 Concentration of dominance ± Understory 0.40 0.14 0.15 0.23 ± 0.07 0.40 ± 0.05  B. SING H ET AL. per unit area (1 ha) which shows the relative contribution of the species in structure and function of the forest ecosystems. On the basis of basal area, three stands contributed in different proportions for each vegetation types. The predominance of overstory basal area in S3 stand and understory in S1 stand and a relatively large basal cover of ground layer vegetation in S2 stand differentiates these stands each other in the community structure and its organization during developmental process. However, t hese sites di fferen ces do not appear t o be significant in species richness. It is because of the fact that various tree species planted initially are now representing presently the overstory. Whereas, understory and ground layer mainly consist of the progeny of same species along with the few natural in- vaders. Measurement of biodiversity in a specific area (local scale) on the basis of richness does not provide a complete under- standing about the individuals of the species as it suffers from the lack of evenness or equitability (e). Richness index de- creased from overstory to understory by 50% followed by the ground layer. It ranged from maximum 2.47 (S1 stand) in over- story, to minimum 0.43 (S2 stand) in ground layer vegetation. Equitability (e) was greatest in S1, S2 and S3 stands, for over- story, understory and ground layer vegetations respectively. Both indices decreased from overstory to ground layer on av- erage of stands. The species were more evenly distributed in ground layer showing lowest in comparison to the overstory vegetation, so it was decreased from overstory to ground layer vegetation. Shannon Wiener’s index (H) is one of the most popular measures of general species diversity in a forest. This index decreased from overstory to ground layer in accordance with the richness index. In this forest, Shannon Wiener’s diver- sity index ranged from 3.99 (S1 stand) in overstory, to least 1.45 (S2 stand) in ground layer vegetation (Table 2). Although S2 stand had greatest ground flora even then their diversity index was lowest for the ground flora which indicates that the ground flora consisted of only few abundant species such as Barleria prionitis, Blepharis maderaspatensis and C leroden- drum vescosum. Concentration of dominance (c) = Σ pi2 indi- cates that the dominance was more concentrated with fewer species in the ground layer in comparison to overstory vegeta- tion where dominance was shared by multiple species. It showed an opposite pattern with the diversity index among the three vegetation types. Entire plant population of the three vegetation strata were classified over a range of size classes according to girth (over- story), diameter (understory) and height for ground layer (Fig- ure 2). In general, these stands appear to be still immature and ecosystem has not yet reached equilibrium. Their configuration and st ructure indicate a “L” shape positively skewed as ymmet- rical distribution of plant populations with increasing size of girth and diameter for both overstory and understory vegetation, respectively. Population of the understory vegetation was near- ly half in S2 and S3 stands in comparison to S1 stand, whereas S2 stand predominated in ground layer vegetation. Population of ground layer vegetatio n was almost evenl y distrib uted acro ss the height class in S2 and S3 stands, whereas in S1 stand most of the population was confined to first few groups only. It was observed that the number of species decreased with increasing plant size in each of the three vegetation forms. In overstory, maximum number of species occurred in initial girth class (20 cm - 40 cm) in all th e thr ee stands. S imilarly in understory spe- cies richness was greatest in initial diameter class. Such types of species composition depicted that species diversity reduced among older individuals with the growth and developments of plants. The pattern of species area relations was almost similar for each o f the three stands. Figur e 2. Biomass of three vegetation layers along with proportional contribution in different components in three stands of 40 year old man made forest.  B. SING H ET AL. Stand Biomass Overstory biomass increased from 292.8 Mg·ha–1 (S1 stand) to 386.2 Mg·ha–1 (S3 stand) corresponding to increase in 30% basal area from S1 stand to S3 stand (Figure 3). The contribu- tion of plant components in total biomass was 28% stem, 58% branch es, 3% l eaf and 11%root. Typically branches cover more biomass than boles in most of the tropical forests. The contri- bution of root in this forest was relatively low in comparison to an average root proportions of about 20% of total biomass found in most of the natural forests. It may be due to the soil compactness and presence of a calcic compact (calcium car- bonate gravels) layer in subsoil. As a consequence roots do not spread and proliferate freely. The understory biomass slightly decreased from 4.5 Mg·ha–1, (S1 stand) to 3.12 Mg·ha–1 (S3 stand) corresponding to decrease in basal area (Figure 3). The percent contribution of the total biomass in different compo- nents of understory vegetation showed about 55% in stem, 18% in branches, 8% in leaf, and 19% roots. Biomass distribution pattern among the components in understory vegetation changed to that of overstory vegetation. Besides, pattern of stand biomass also reversed among stands showing a decrease from S1 to S3 stand. Total biomass of ground layer vegetation decreased fro m 82. 3 kg·ha–1 (S2 stand) to 8.4 kg·ha–1 (S1 stand) corresponding to decrease in basal cover from 271.49 m2·ha–1 (S2 stand) to 5.39 m2·ha–1 (S1 stand). The percent contribution of different components of ground layer vegetation in stem, leaf and root was 44%, 26% and 30% respectively. The root/shoot ratio increased considerably from overstory (0.12) to understory (0.23) and ground layer (0.42) vegetations. Net Production Mean annual increment in biomass (MAI) of overstory ve- getation had little difference within stands, but current annual incremen t (CAI) and n et primary p roduction (NPP) were great- est in S2 stand (Figure 3). Thus, a stand superior in total bio- mass (S3) could not succeed as well in net production although with minor reduction, which may be due to the fact that S3 stand would have been optimized maximum production during 45 yr. However, at the same time MAI, CAI and NPP of un- derstory vegetation were in the order of S1 > S2 > S3 stand in accordance with their biomass. Overstory production contrib- uted to 95% of total forest production in a year. Understory and ground layer contributed to 4% and 1% of the total forest pro- duct io n, respectively. Figur e 3. Annual increment in dry matter of overstory and understory in three forest stands. MAI = mean annual increment, CAI = curren t annual incr ement, NPP = net primary production.  B. SING H ET AL. Litter a nd Fine Root Litter Fall Litter fall is an important flux to transfer the organic matter and nutrients from trees to the soil which maintains soil sustai- nability in general and reclamation of sodic soils in this partic- ular case. About 8 Mg·ha–1·yr–1 - 9 Mg·ha–1·yr–1 litter fall oc- curred among the stands of the 40 yr-old forest under study (Table 3). Maximum input of litter to the soil was recorded in S2 stand and minimum in S3 stand although these were not significantly different. In all stands, lit ter was separated in fou r components in varying proportions. On stand mean basis leaf, twig, flower-fruits and bark contributed to 68%, 20%, 9% and 3% of the total litter fall, respectively. Earlier, a relatively high annual litter fall of 11.2 Mg·ha–1·yr–1 was reported in the same forest (Singh, 1996). Thus annual litter fall decreased slightly with further maturity of forest. Since the forest constituted both deciduous and evergreen species, litter fall occurred throughout the year with its maximum quantity in March due to more de- ciduous species. Seasonal variation in litter fall indicated a relatively high proportion in summer and spring seasons, each about 25% of the annual flux. Generally the wind velocity in- creases in these seasons which promote the abscission of ma- ture and old leaves and dead twigs and branch es. Least amoun t of litter fall was observed in autumn season (12% of annual). Forest Floor Litter Although litter fall and decomposition are instantaneous proc esses but entire litter fall during one year does not decompose completely during the next year and a substantial amount re- mains to be decomposed in subsequent years. The residue ac- cumulated on the forest floor was estimated as 6.3 Mg·ha–1 under different stage of decay forming ecto-o rgan ic la yers (L, F and H) on mineral soil. The magnitude of forest floor was rela- tivel y large i n S3 s tand co rresp ondi ng to th eir stan din g biomass and small in S2 stand (Table 3). The distribution of organic matter in these layers varied in different proportions such as 38% (L), 29% (F) and 33% (H) of the total forest floor litter on the basis o f seasonal mean. This litt er serves as ‘nutrien t bank’, checks evaporation and conserves soil moisture to optimize the microbiological activity in the underlying mineral soil. Fine Root Biomass Fine roots play a crucial role in water and minerals uptake and moisture retention in the soil. On account of their ephemer- al nature, fine roots may also contribute to soil organic matter and carbon sequestration. Besides, fine roots act well in recla- mation of sodic soil by reducing the pH, improving the soil structure, porosity and water permeability of heavy impervious sodic soils. Fine root biomass in different season (rainy, autumn, winter, spring and summer) was extracted with respect to soil depth, intermittently at 15 cm intervals up to 45 cm. Total fine root biomass (live and dead) was 532 g·m–2 up to 0 cm - 45 cm depth in which live and dead proportions were classified as 93% and 7% respectively (Table 4). Fine root biomass de- creased with depth up to 45 cm. Total fine root biomass varied significantly (P < 05) between the stands with maximum in S1 stand and minimum in S3 stand. About 47% of total fine root biomass occurred in superficial 0 cm - 15 cm depth. Fine root biomass decreased significantly from rainy to summer season. Total fine and small roots were classified into 5 diameter classes from < 1 mm to 25 mm. Bi omass of fine roots incr eased with size class in all the three stands accounting maximum in 10 mm - 25 mm size class ranging from 27% (S3 stand) to 42% (S1 stand) and minimum in the 1 mm - 2 mm class with 7% (S1 stand) to 12% (S2 stand). Table 3. Annual litter fall in a rehabilitated forest on sodic land at Banthra, Lucknow (Mg·ha–1). Components Stands S1 S2 S3 Mean SE Leaf 6.18 5.43 5.57 5.73 ± 0.230 Twig 1.49 2.02 1.71 1.74 ± 0.154 7.57 ± 0.238 2.30 ± 0.115 8.45 ± 0.182 ± Table 4. Fine root biomass in a rehabilitated forest on sodic land (g·m–2). Dep th (cm) State Sta nds S1 S2 S3 Mean SE 0 - 15 ± ± ± ± 17 ± 2.63 33 ± 17.14 17 ± 8.15 22 ± 5.33 15 - 30 Live 283 ± 134.7 2 23 ± 84.73 140 ± 55.14 2 15 ± 41.45 5 ± 1.53 16 ± 9.57 4 ± 1.24 8 ± 3.84 30 - 45 Live 93 ± 37.3 47 ± 13.14 30 ± 11.22 57 ± 18.8 Total (0 - 45) ± Dead 26 51 24 34 ± 8.68 Total 675 516 404 532 ± 79.22  B. SING H ET AL. Fine Root Production Fine root production was less than half (233 g·m–2·yr–1) to that of their biomass up to a depth of 30 cm (Table 5). About two third i.e. 67% of the annual fine root production was meas- ured during rainy and summer season. Corresponding to bio- mass, fine ro ot produ ctio n was also less in lower strat a of 15-30 cm depth (101 g·m–2) in comparison to surface soil of 15 cm (132 g·m–2). It appears that about 70% of the total annual pro- duction of fine roots undergoes to mortality. However, in the periodic in-growth core extractions, fractions of dead roots were found to only 20% of the total annual production during different seasons, but cumulative mortality during the year would be many more times. Fine root production differed sig- nificantly between the stands and it decreased from S3 to S1 stand. Discussions Rehabilitation of barren sodic land under forest almost per- forms the same ecological functions to that of their natural allies despite of in different species composition plant commu- nity stru cture and sp ecies abundance might be different, yet the degraded state was renewed to an extent where life support systems could be operated by the several tropical biotas. How- ever, the process was enough difficult to create a healthy eco- system on account of many soil constraints commonly found in sodic soils which inhibit the establishment and growth of plants (Gupta & Abrol, 1990; Sumner, 1993; Naidu & Rengasami, 1993; Garg, 1998), nevertheless it was successful effort to ac- commodate a wid e range of species in the new biotope. Know- ledge of the species adaptation to such sites and process in- volved in succession can be utilized for rehabilitating the other similar sites in general and sodic ones in particular. This study, however, does not indicate temporal changes, yet it examines the diversity of a rehabilitated forest from several angles whi ch exerts a strong influence to restore stability and resilience of rehabilitated ecosystem. Forest developed in such a way under protection forestry programs is important to determine the rate of restoration, structural and ecological diversities, establish- ment of steady state in biogeochemical cycle and patterns to- wards the cl imax communities. Any major disturban- ces may destabilize the building of niche (composition, aggrega- tion and org a ni z a ti on) whic h may ex tend the r e s tor a tion pr ocess. Community Structure A semi natural forest developed on sodic soil constituted 74 species belonging to 35 families. These species were classified in overstory (44), understory (19), ground layer (8) and climber (3). Several species of overstory are also found in understory and ground layer vegetation which are supposed to be offspring of the parents at different growth stage. Several parameters of this rehabilitated forest have been compared with a degraded and reference forest of the region (Table 6). Plant population density decreased from degraded, rehabilitated to reference forest, respectively for overstory species but understory popula- tion in our rehabilitated forest was exceedingly high due to biotic protection.The average basal area (30 m2·ha–1) of the forest studied li es in between th e degraded (Jha & Singh , 1990, Singh & Singh, 1991) and reference (Tripathi & Singh, 2009) forests. It appears that the carrying capacity for supporting the tree stock on sodic soils differs with species ranging from 12 to 38 m2ha–1 basal area in Acacia nilotica and Eucalyptus camal- dulensis plantations at same age (Singh et al., 2000). These values compar e fairl y well with 17 m2·ha–1 - 40 and 20 m2·ha–1 - 75 m2·ha–1 for dry and wet forests of the world, respectively (Murphy & Lugo, 1986b). The basal area of our rehabilitated forest is also well comparable to that of deciduous and ever- green forest (16 m2·ha–1 - 33 m2·ha–1) of Brazil (Haase 1999), beech forest 28 m2·ha-1 of Japan (Nagaike et al., 1999). Basal area of hardwood forest in USA was relatively high in the range of 40 m2·ha–1 - 45.5 m2·ha–1 (Gilliam et al., 1995) which might be expected with bet ter silvicultural management on a good soil type. The species richness of overstory vegetation was relatively high from understory and ground layer. Number of species in overstory can also be compared well with rainforest (43), moist forest (45), temperate forest (45) in one hectare plot area (Brockway, 199 8). The classi ficati on of species as a p ercent of the total species in respective vegetation strata according to their population in numerals revealed t hat there were only a few species representing their populations in thousands and a high percent of total species had their individuals either in units or tens as under (Table 1). Table 5. Fine roo t production in a 45-yr o ld rehabilitate d f or e st on so dic soil (g·m–2). Depth (cm) State Rainy (%) Autumn (%) Winter (%) Spring (%) Summer (%) Total annual 0 - 15 Live 35(33) 11(10 ) 8(8) 10(9) 43(40) 107 Dead 7(28) 5(20) 2(8) 3(12) 8(32) 25 15 - 30 Live 31(38) 13(16 ) 6(8) 6(8) 24(30) 80 Total (0 - 30) Grand tota l 76(33) 39( 17) 18(7) 21(9) 79(34) 233  B. SING H ET AL. Table 6. Com parat iv e evalu a tion of vege tation struct ure an d prod uc t i vity i n degra ded, re h a bili ta ted a nd refere nce forest. Parameters Vegetation strata Degraded forest* Reha bilitated fore st** Reference forest*** Population density (No/ha) Understory 343 ± 121 3728 ± 913 245 ± 116 Ground layer - 6813 ± 456 4015 ± 730 Basal area (m2·ha–1) Understory 1.34 ± 0.47 4.2 ± 1.2 14.00 ± 8.20 Ground layer - 112 ± 66.4 274 ± 61 Spec ies ri c h ness Understory 8 ± 0.28 18 ± 1.6 25 ± 2.5 Ground layer - 12 ± 0.72 21±5.78 Richness index Understory 0.67 ± 0.09 1 ± 0.1 1.50 ± 0.57 Ground layer - 0.8 ± 0.1 0.91 ± 0.21 Equitability Overstory 0.72 ± 0.11 1.1 ± 0.07 0.93 ± 0.0 3 Understory 1.06 ± 0.05 0.9 ± 0.08 0 .77 ± 0.02 Ground layer - 0.7 ± 0.08 0.73 ± 0.06 Shanna Wiener’s Index Understory 1.98 ± 0.09 3.3 ± 0.27 2 .27 ± 0.17 Ground layer - 1.8 ± 0.19 2.2 3 ± 0.18 Concentrate of dominance Understory 0.31 ± 0.04 0.23 ± 0.07 0.15 ± 0.02 Ground layer - 0.40 ± 0.05 0.186 ± 0.01 Biomass (Mg·ha–1) Understory 4.28 ± 0.34 3.8 ± 0.4 70 ± 5 Ground layer 0.82 ± 0.15 0.04 ± 0.02 5 ± 0.2 Net production (Mg·ha–1·yr–1) Understory 0.9 ± 0.15 1.2 ± 0.15 15 ± 1.6 Ground layer 1.1 ± 0.17 0.05 ± 0.01 7 ± 1.1 *A fter S ingh and Misra (1979) and Singh and Singh (1991). **Present st udy. ***Tripathi and Singh (2009). About 28 species were found naturally regenerating in this forest which was about 64% of the total species listed in the forest. All these species may be considered to be well adopted in sodic soils viz. Aegle mar melos, Alangium salvifolium, Albizia lebbe ck, Azadirachta indica, Bauhinia variegata, Cassia siamea, Cassia fistula, Cordia dichotoma, Callistemon lanceolatus, Dal- bergia sissoo, Dryopteris embryopteris, Ficus glomerata, Holop- telea integrifolia, Leucaena leucocephala, Mangifera indica, Phoen ix syl vest ris, Pithecellobium dulce, Derri s in dica, Putranjiva roxburghii, Streblus asper, Sterculia alata, Syzygium cumini, Syz y- gium heyneanum, Tamarindus indica, Thevetia peruviana, Termi- nalia arjuna, Zizi phus nummularia etc. Importan ce value index (IVI) of this forest in general ran ged from 10 to 77 including 10 to 48 for overstory species. These values match with the range of 11 to 52 for sub-tropical tree species o f a wet hill forest, India (Rao et al., 1990). The IVI of tree species of a protected forest in Orissa (India) ranged from 12 to 55 (Verma et al. , 1997), and trees of dry tropical forest of Vindhyan region constituted 3 to 32 IVI (Singh & Singh, 1991). Thus, our estimate for a rehabilitated forest compares fairly well with the natural forests in India. Shannon Wiener’s index (H) of general diversity obtained from 1.8 (ground layer) to 3.6 (Overst o r y vegetation ) indicated that the variability of trees was apparently higher in comparison to ground flora. Since many tree species were planted in this forest, tree diversity index exceeded from dry tropical forests of India, whereas ground layer diversi ty was almost similar to that of other native forests (Jha, 1990; Singh & Singh, 1991). Shannon Wiener’s diversity index of this forest was relatively low from tropical rainforests (3.8 to 4.8) of Silent Valley, India, (Singh et al., 1984). A more generalized relation of the species diversity is derived when stands were pooled together for certain correlations. For in-  B. SING H ET AL. stance, the Shannon Wiener’s index increased positively with the in crease in IV I and th e correlatio n was high ly signi ficant (P < 01). The Shannon Wiener’s index was negatively correlated with the concentration of dominance, and redundancy, wherea s; it had a direct relation with equitability and richness index. Successional patterns on plant species diversity during reha- bilitation of barren land in India are not known and thus the species recruitment/replacement rate is yet to be understood with temporal scale from the initial establishments. The way through which the succession approaches to attain equilibrium, alike to that of natural forests of this region and is stabilized might be interesting to understand for creating a new biotope of our own choice. Manipulation at time to time may be made to divert the ecological processes in the best interest of the entire organism associated with the forests. However, most of the natural forests are disturbed to various degrees on account of a high population pressure for timber, industrial pulp and fuel- wood which affect the species diversity significantly. For in- stance a dry tropical forest of Vindhyan region in India con- sisted of lower species diversity and basal area in comparison to our study due to several biotic disturbances (Singh and Singh, 1991). However, if a forest is not disturbed during the devel- opment of dominant species, then also the species richness is reduced (Odum, 1960). Therefore moderate disturbance may be in favor of high species richness. The studies made elsewhere on species diversity with succession reported the conflicting patterns. McCormick (1968) and (Nicholson & Monk, 19 74) found that diversity increased with succession, while Shafi and Yarantan (1973) reported decline in diversity with age. A few noted the highest diversity in the early stages of succession (Habeck, 1968; Long, 1977; P eet, 1978), whereas, several oth- ers have dep icted a polyno mial increase follo wed by a decrea se during succession (Margalef, 1963, 1968; Loucks, 1970; Auc- lair & Goff, 1971; Schoonmaker & Mackee, 1988). In some cases diversity may show multiple peaks during succession as found by (Halpern & Spies, 1995). Therefore, no generalized trend is maintained and such variations if examined along the site quality gradients would be useful in modeling of diversity patterns. The different theories of the community organization stated that the diversity is a structural concept which relates to stabil- ity, maturity, productivity and evolutionary time, predation pressure and spatial heterogeneity (Hill, 1973). Species diver- sity (richness) and dominance (Simpson index) were inversely related to each other in agreement with Zobel et al. (1976). Most of these studies suggest that major diversity changes oc- cur during early forest formation and time of species saturation during succession varies greatly in different forests (Nicholson & Monk, 1974). The trends of equitability with succession has not been yet resolved as the high diversity of undisturbed trop- ical forest implies high equitability levels for mature tropi- cal forest communities (Janzen, 1970; Shafi & Yaranton, 1973), whereas other data indicate a strong decrease in equitability with forest age in USA (Loucks, 1970; Auclair & Goff, 1971; Nicholson & Scott, 1972). It might be possible that a high scale catastrophic perturbation would have reduced the equitability in mature forest vegetation. In general diversity indices (richness, Shannon Wiener’s and equitability) tend to stabilize from ground layer to overstory vegetation. Nicholson & Monk (1974) expressed a b asic change in t he strategy of th e plant communi- ties in initial forest formation from a low to high equitability. The young communities (0 yr - 20 yr.) are characterized by plentiful resources and growing space with low equitability, whereas older communities, highly competitive in space and resource, exhibited a high equitability. Thus rapid increase and stabilization of plant equitability early in succession is viewed as a necessary adjustment to resource scarcity. These findings entail that the community structure and species diversity are related to several environmental factors which lead to specific changes at var ious scale ( r egi on, landscape, bio me). Productivity Standing biomass and net primary production (NPP) are the aggregate response of the plant species in a particular set of environmental conditions. Climatic and edaphic factors across the region along with the species intrinsic potential determine the limits of ecosystems productivity. Forest productivity dif- fers considerably with environmental conditions from arid to humid climates (8 Mg·ha–1·yr–1 - 40 Mg·ha–1·yr–1) , st an d ing bio- mass and net primary production are generally found to be closely associated with each other. Forest established on de- graded land tends to acquire the climate based yield in a par- ticular habitat. B i oma s s Total biomass of the three stands varied about 12% - 14 % from their mean in this rehabilitated forest. Our mean value (347 Mg·ha–1 ± 27 Mg·ha–1) is supposed to be far better from the other dry tropical forests (degraded) of India, however it is yet to ach ieve the st atus of a reference forest of this region (Ta- ble 6). Murphy & Lugo (1986b) have reported the global pat- tern of biomass of dry tropical forests (78 Mg·ha–1 - 320 Mg·ha-1), in which the biomass of this rehabilitated forest was relatively higher, but it was lower to that of wet tropical forest (269 to 1186 Mg·ha–1) The total biomass of our rehabilitated forest was less than half of the humid sal forest of India (Singh & Singh, 1989). It was also below by 24% and 37% from the trop ical rain for est of Sarawak an d Karnataka, I ndia (Pr octor et al., 1983; Rai & Proctor, 1986). In a particular habitat biomass depends much on the composition of the t ree species i n a forest because species to species variations, even on the sodic soil sites have been found to be quite high ranging from 202 (Aca- cia nilotica) to 405 Mg·ha–1 (Eucalyptus) on the same site at same age (Si ngh et al., 2000). The average biomass of our reha- bilitated forest was less (43%) than the mixed dry deciduous forest at Haryana India (Gupta & Bhardwaj, 1993). Such varia- tions may be considered as the proportional responses of the site quality interactions to various species in order to perform the forest ecosystem functioning as efficiently as it can opti- mize the cl imate based yield. Biomass Alloca tio n Above ground biomass in this study was low in comparison to some tropical forests including wet forests. Biomass in above ground plant parts was 88% of the total (stem 28%, branch 57% and leaf 3%), indicating that allocation in root was below the average of 20% observed in most of the natural forests. This might be expected due to soil compactness and presence of “Kankar pan ” (a st on y layer of C aCO3 gravels) in sub so il. As a consequence, root could not spread and proliferate freely. In this rehabilitated semi-natural forest the mean root biomass contributed about 12.4% of total forest biomass in which coarse root contributed 11% and fine roots contributed to 1.4% of total forest biomass. The contribution of roots in total forest biomass was comparatively low from dry tropical forests supporting 12% - 18% of total biomass (Singh & Misra, 1979; Murphy & Lugo, 1986a; Singh & Singh, 1991). The contribution of coarse 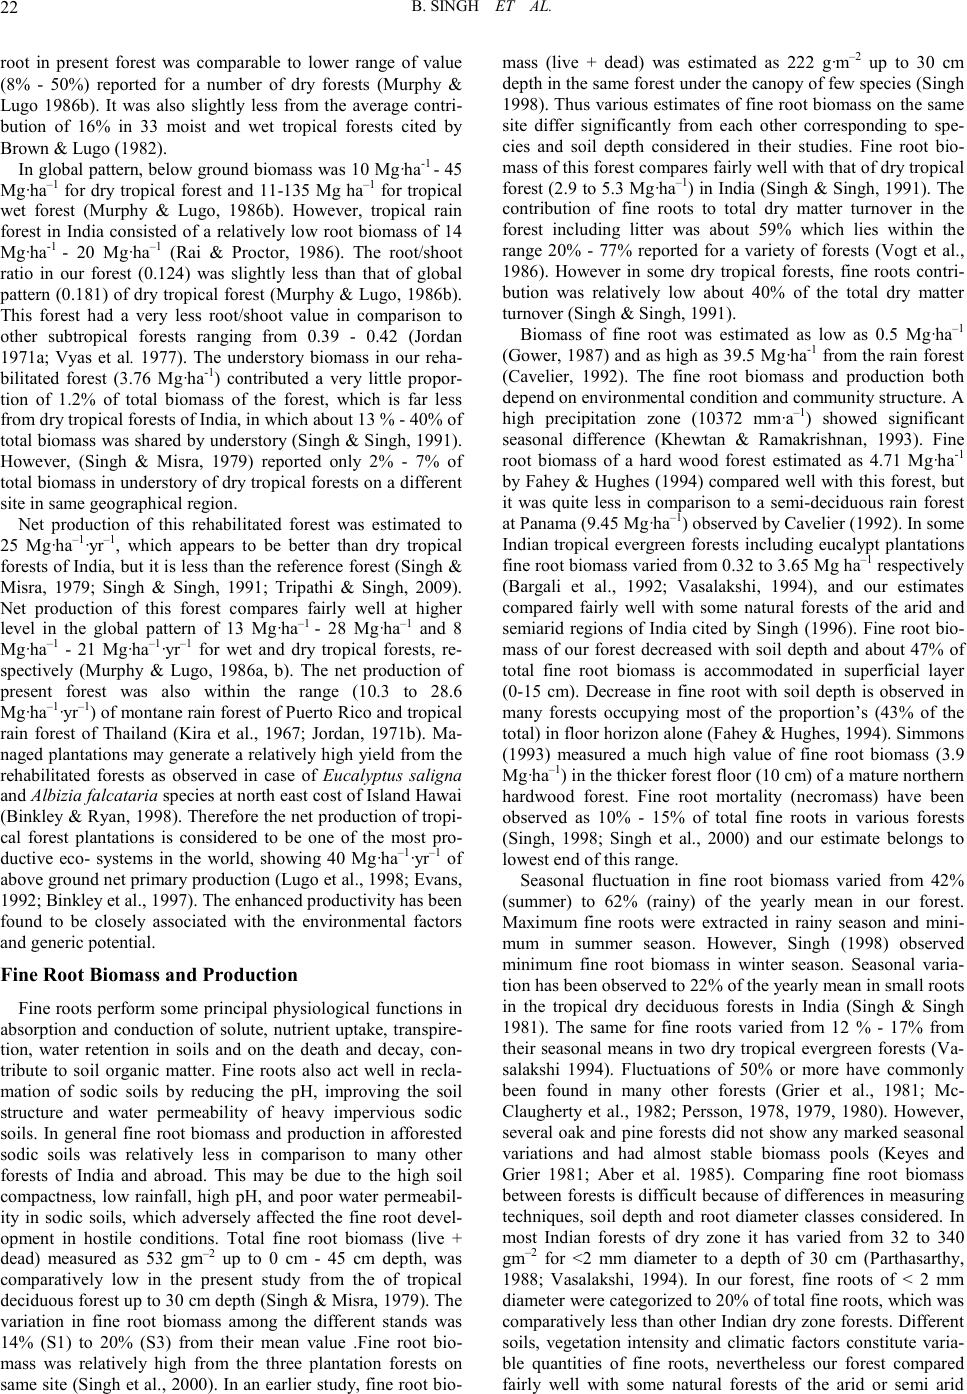 B. SING H ET AL. root in present forest was comparable to lower range of value (8% - 50%) reported for a number of dry forests (Murphy & Lugo 1986b). It was also slightly less from the average contri- bution of 16% in 33 moist and wet tropical forests cited by Brown & Lugo (1982). In global pattern, below ground biomass was 10 Mg·ha-1 - 45 Mg·ha–1 for dry tropical forest and 11-135 Mg ha–1 for tropical wet forest (Murphy & Lugo, 1986b). However, tropical rain forest in India consisted of a relatively low root biomass of 14 Mg·ha-1 - 20 Mg·ha–1 (Rai & Proctor, 1986). The root/shoot ratio in our forest (0.124) was slightly less than that of global pattern (0.181) of dry tropical forest (Murphy & Lugo, 1986b). This forest had a very less root/shoot value in comparison to other subtropical forests ranging from 0.39 - 0.42 (Jordan 1971a; Vyas et al. 1977). The understory biomass in our reha- bilitated forest (3.76 Mg·ha-1) contributed a very little propor- tion of 1.2% of total biomass of the forest, which is far less from dry tropical forests of India, in which about 13 % - 40% of total biomass was shared by understory (Singh & Singh, 1991). However, (Singh & Misra, 1979) reported only 2% - 7% of total biomass in understory of dry tropical forests on a different site in same geographical r egi on. Net production of this rehabilitated forest was estimated to 25 Mg·ha–1·yr–1, which appears to be better than dry tropical forests of Ind ia, but it is l ess than the reference forest (Sin gh & Misra, 1979; Singh & Singh, 1991; Tripathi & Singh, 2009). Net production of this forest compares fairly well at higher level in the global pattern of 13 Mg·ha–1 - 28 Mg·ha–1 and 8 Mg·ha–1 - 21 Mg·ha–1·yr–1 for wet and dry tropical forests, re- spectively (Murphy & Lugo, 1986a, b). The net production of present forest was also within the range (10.3 to 28.6 Mg·ha–1·yr–1) of montane rain forest of Puerto Rico and tropical rain forest of Thailand (Kira et al., 1967; Jordan, 1971b). Ma- naged p lantation s may generate a rel atively high yiel d from the rehabilitated forests as observed in case of Eucalyptus saligna and Albizia falcataria species at north east co st o f Islan d Hawai (Bin kley & R yan, 1998). Therefore the net production of tropi- cal forest plantations is considered to be one of the most pro- ductive eco- systems in the world, showing 40 Mg·ha–1·yr–1 of above ground net primary production (Lugo et al., 1998; Evan s , 1992; Binkley et al., 1997). The enhanced productivity has been found to be closely associated with the environmental factors and gen eric potent ial. Fine Root Biomass and Production Fine roots perform some principal physiological functions in absorption and conduction of solute, nutrient uptake, transpire- tion, water retention in soils and on the death and decay, con- tribute to soil organic matter. Fine roots also act well in recla- mation of sodic soils by reducing the pH, improving the soil structure and water permeability of heavy impervious sodic soils. In general fine root biomass and production in afforested sodic soils was relatively less in comparison to many other forests of India and abroad. This may be due to the high soil compactness, low rainfall, high pH, and poor water permeabil- ity in sodic soils, which adversely affected the fine root devel- opment in hostile conditions. Total fine root biomass (live + dead) measured as 532 gm–2 up to 0 cm - 45 cm depth, was comparatively low in the present study from the of tropical deciduous forest up to 30 cm depth (Singh & Misra, 1979). The variation in fine root biomass among the different stands was 14% (S1) to 20% (S3) from their mean value .Fine root bio- mass was relatively high from the three plantation forests on same site (Singh et al., 2000). In an earlier study, fine root bio- mass (live + dead) was estimated as 222 g·m–2 up to 30 cm depth in the same forest under the canopy of few species (Singh 1998). Thus various estimates of fine root biomass on the same site differ significantly from each other corresponding to spe- cies and soil depth considered in their studies. Fine root bio- mass of thi s forest compares fairly well with that of dry tropical forest (2.9 to 5.3 Mg·ha–1) in India (Singh & Singh, 1991). The contribution of fine roots to total dry matter turnover in the forest including litter was about 59% which lies within the range 20% - 77% reported for a variety of forests (Vogt et al., 1986). However in some dry tropical forests, fine roots contri- bution was relatively low about 40% of the total dry matter turnover (Singh & Singh, 1991). Biomass of fine root was estimated as low as 0.5 Mg·ha–1 (Gower, 1987) and as high as 39.5 Mg·ha-1 from the rain forest (Cavelier, 1992). The fine root biomass and production both depend on environmental condition and community structure. A high precipitation zone (10372 mm·a–1) showed significant seasonal difference (Khewtan & Ramakrishnan, 1993). Fine root biomass of a hard wood forest estimated as 4.71 Mg·ha-1 by Fahey & Hughes (1994) compared well with this forest, but it was quite less in comparison to a semi-deciduous rain forest at Panama (9.45 Mg·ha–1) observed by Cavelier (1992). In some Indian tropical evergreen forests including eucalypt plantations fine root biomass varied from 0.32 to 3.65 Mg ha–1 respectively (Bargali et al., 1992; Vasalakshi, 1994), and our estimates compared fairly well with some natural forests of the arid and semiarid regions of India cited by Singh (1996). Fine root bio- mass of our forest decreased with soil depth and about 47% of total fine root biomass is accommodated in superficial layer (0-15 cm). Decrease in fine root with soil depth is observed in many forests occupying most of the proportion’s (43% of the total) in floor horizon alone (Fahey & Hughes, 1994). Simmons (1993) measured a much high value of fine root biomass (3.9 Mg·ha–1) in the thicker forest floor (10 cm) of a mature northern hardwood forest. Fine root mortality (necromass) have been observed as 10% - 15% of total fine roots in various forests (Singh, 1998; Singh et al., 2000) and our estimate belongs to lowest end of this range. Seasonal fluctuation in fine root biomass varied from 42% (summer) to 62% (rainy) of the yearly mean in our forest. Maximum fine roots were extracted in rainy season and mini- mum in summer season. However, Singh (1998) observed minimum fine root biomass in winter season. Seasonal varia- tion has been observed to 22% of the yearly mean in small roots in the tropical dry deciduous forests in India (Singh & Singh 1981). The same for fine roots varied from 12 % - 17% from their seasonal mean s in two dry t ropical evergreen forests ( Va- salakshi 1994). Fluctuations of 50% or more have commonly been found in many other forests (Grier et al., 1981; Mc- Claugherty et al., 1982; Persson, 1978, 1979, 1980). However, several oak and pine forests did not show any marked seasonal variations and had almost stable biomass pools (Keyes and Grier 1981; Aber et al. 1985). Comparing fine root biomass between forest s is difficult b ecause of differences in measur ing techniques, soil depth and root diameter classes considered. In most Indian forests of dry zone it has varied from 32 to 340 gm–2 for <2 mm diameter to a depth of 30 cm (Parthasarthy, 1988; Vasalakshi, 1994). In our forest, fine roots of < 2 mm diameter wer e catego rized to 20% of to tal fine roo ts, which was comparativ ely less than other Indian d ry zone forests. Di fferent soils, vegetation intensity and climatic factors constitute varia- ble quantities of fine roots, nevertheless our forest compared fairly well with some natural forests of the arid or semi arid  B. SING H ET AL. zone of India (Singh 1998). Fine root production was measured as 2.33 Mg·ha–1·yr–1 in this for est, which was nearl y half to that of fine root biomass to a depth of 30 cm. Live fine root production ranged from 2.5 Mg·ha–1·yr–1 in chir pine forest to 3.61 Mg·ha–1·yr–1 in banj oak evergreen forest (Usman & Rawat, 1999). According to Satoo (1971) the fine root production in evergreen bro ad leaved forest ranged between 3.7 to 5.3 Mg·ha–1·yr–1. The fine root produc- tion in this study lies within the range of 1.4 to 11.5 Mg·ha–1·yr–1 report ed for various tropi cal and temperate forests (Keys & Grier, 1981; Fogel, 1985; Santantonio & Hermann, 1985; Santantonio & Santantonio, 1987; Adhikari, 1992; Gar- koti, 1992; Fahey & Hughes, 1994). In Indian forests, fine root production ranged from 0.5 Mg·ha–1·yr–1 of tropical dry deci- duous forest to 3.2 Mg·ha-1·yr-1 in humid tropical forest (Singh & Singh, 1981; Khewtan & Ramakrishnan, 1993). Fine root production in tropi- cal evergreen forest in In dia ranged from 1 to 1.17 Mg·ha–1·yr–1 Vasalakshi (1994). Fine root production differed with seasons and maximum production occurred dur- ing rainy season and summer season of about 67% of the an- nual production. Fine root production of <2 mm diameter oc- curred about 90% of total size classes studied which decreased with increasing root size in this forest. Litter Litter fall is an important flux of nutrient cycle to maintain the soil sustainability for perpetual production. Besides, it also contributes significantly in reclamation of sodic soil. Litter constitutes several parts i.e. leaves, twigs, bark, dead branches, flower, frui ts, seed etc in whi ch leaf litter generally contributes more than 50% of the total litter. Littoral and swamp forest and tropical moist deciduous forest had the highest total as well as leaf litter fall, while tropical dry deciduous forest had lowest total and leaf litter fall. While comparing in four contrasting forest types in India, Singh et al. (1992) also reported that dry deciduous forest had lower litter fall than other types. The rela- tively low net primary productivity of dry deciduous forests might be one of the reasons. The litter quantity also depends on the population density, age and species of the forest. Since most of these forests are degraded ones, the litter fall was relatively low. Annual litter fall of 8.5 Mg·ha–1·yr–1 was esti mated in the rehabilitated forest which was greater than the litter fall (5.8 Mg·ha–1·yr–1) of dry tropical forest in India (Singh & Misra, 1979; Singh & Singh, 1991). Mean litter fall of 6.4 Mg·ha–1·yr–1 was reported for tropical montane forests (Vitousek & Sanford, 1986). A review of 44 published studies of Indian forests do- cumented total and leaf litter fall in the range of 4.3 to 8.5 Mg·ha-1·yr-1 and 3.4 to 6.9 Mg·ha-1·yr-1 respectively (Dadhwal et al., 1997). Vogt et al. (1986) compiled a range of 2.44 to 9.44 Mg ha-1yr-1 for various forest types of the world. The range of litter for a variety of tropical and dry forests of the world was reported to be 0.8 Mg·ha–1·yr–1 - 15.3 Mg·ha–1·yr–1 (Vitousek, 1984; Murphy & Lugo, 1986b; Dantas & Phillipson, 1989 ). So our data lie in the middle of the said range. Leaf litter in the present study contributed 68% of total litter fall which is com- parable to that of (75%) tropical dry deciduous forests of India (Singh & Misra, 1979). In our forest, of the total annual litter fall, summer season contributed maximum (25%) and autumn minimum (12%). Corresponding figures in deciduous forest may reach to 42% of the total annual in summer and 18% in rainy season (Singh & Misra, 1979). The data generated here with on plant community students, species diversity, biomass, net production, litter fall and fine roots indicated that the restoration of barren sodic land in a new forest ecosystem has acquired most of the characteristics prop- erties of natural forests of this region, even after differing in species composition. This case study suggests the adoption of the most su ccessful species for the resto ratio n of oth er identi cal sites in amore efficient way. If we could control the fire, live- stock grazing and invasive alien species, organization of new plant communities, succeeds with the little anthropogenic ef- forts. Mixed plantation with native species, particularly legu- minous, has become more successful. It would be better to in- troduce the medicinal herbs, found in natural forests to develop amore useful and compatible ground layer in the rehabilitated forest. Acknowledgements Authors are grateful to the Director, National Botanical Re- search Institute, Lucknow for extending the necessary support to carryout the said work at an institutional site. References Aber, J. D., Melillo, J. M., Nadelhoffer, K. J., McClaugherty, C. A., & Pastor, J. (1985). Fine root turnover in forest ecosystems in relation to quantity and form of nitrogen availability: A comparison of two methods. Oecologia , 66 , 317-321. doi:10.1007/BF00378292 Abrol, I. P. (1986). Fuel and forage production from salt affected was- tel an d i n India. Reclamation Revegetation Research, 5, 65-74. Abrol, I. P., & Bhumbla, D. R. (1971). Saline and alkali soils in In- dia—their occurrence and management. Rome: World Soil Resour- ces, FAO Rep o r t. Abrol, I. P., & Joshi, P. K. (198 6). Econom ic vi abili ty of recla mati on of alk al i l and s wi th spec ia l ref er en c e to agri c u ltu re an d f ores t ry. In H. R. Yadav (Ed.), Wasteland diagnosis and treatment (pp. 149-168). New Delhi: Concept Publishing Co. Adhikari, B. S. (1992). Biomass productivity and nutrient cycling of Kharsu Oak silver fir forests in central Himalaya. Ph.D. Thesis, Naintial: Kumau n University. Agrawal, R. R., & Gupta, R. N. (1968). Saline alkali soils in India . New Delhi: ICAR Technical Bulletin (Agricultu re Series). Ahuja, P. S., Singh, .K. N., & Rana, R. S. (1979). Evaluation of forages and other plants for utilization of salt affected soils. Karnal: Trees Annu al R e p o r t CSS IR . Alice, F., Montagnini, F., & Montero, M. (2004). Productividad en plantacionespuras y mixtas de especies forestales nativas en La Estaciόn Biolόgica La Selva, Sarapiquí. Agronomy Costarricen s e, 28, 61-71. Auclair, A. N., & Goff, F. G. (1971). Diversity relations of upland forests in western Great Lakes area. American Naturalist, 105, 499- 528. doi:10.1086/282742 Bar bier, S., Gosseli n, F., & Balan dier, P. (200 8). Influen ce of tr ee spe- cies on understory veg etati on diversity and mechanism s involved—A critical review for temperate and boreal forests. Forest Ecology & Manage ment, 254, 1-15 . doi:10.1016/j.foreco.2007.0 9.038 Bargali, S. S., Singh, S. P., & Singh, R. P. (1992 ). Structure and fun c- tion of an age series of eucalypts plantations in Central Himalaya. I. Dry matter dynamics. Annals of Botany, 69, 405-411. Bhojvaid, P. P., & Timmer, V. R. (1998). Soil dynamics in an age se- quence of Prospis juliflora planted for sodic soil restoration in India. Forest Ecology & Management, 106, 181-193. doi:10.1016/S0 378-1127(97)00310-1 Binkley, D., O’Connel, A. M., & Sankaran, K. V. (1997). Stand growth: pattern and controls. In E. K. S. Nambiar and A. Brown (Eds.), Management of soil, water nutrients in tropical plantation forests (pp. 719-442). Canberra: ACIAR Monograph 43. Binkley, D., & Ryan, M. G. (1998). Net primary production and nu- trient cycling in replicated stands of Eucalyptus saligna and Albizia facaltaria. Forest Ec ology & Management, 112, 79-85. doi:10.1016/S0 378-1127(98)00331-4 Brinkley, D., White, S. C., & Gosz, J. R. (2004). Tree biomass and net increment in an old aspen forest in New Mexico. Forest Ecology &  B. SING H ET AL. Manage ment, 203, 407-410. doi:10.1016/j.foreco.2004.08.010 Brockway, D. G. (1998). Forest plant diversity at local and landscape sca les in the ca sc ad e mou nt ai n s of sou th -wester n Washington. Forest Ecology & Managemen t, 109, 323-341. doi:10.1016/S0 378-1127(98)00266-7 Brown, S. , & Lugo, A. E. (1982). The st orage and p roduction of orga n- ic m atter in trop ical fores ts and their role in the glob al carbon cycle. Biotropica, 14, 161-187. d oi:10.2307 /2388024 Cavelier, J. (1992). Fine root biomass and soil properties in a semide- ciduous and lower montane rain forest in Panama. Plant and Soil, 142, 187-201. doi:10.1007 /BF00010965 Chapin, F. S. III, Vitousek. P. M., & Cleve, K. V. (1986). The nature of nutrient limitation in plant communities. The American Naturalist, 127, 48-58. doi:10.1086/284466 Chapin, F. S., Zavaleta, E. S., Eviner, V. T., Naylor, R. L., Vitousek, P. M., Lavourel, S., Reynolds, H. L., Hooper, D. U., Sala, O. E., Hobbie, S. E., Mack, M. C., & Diaz, S. (2000). Consequences of changing biotic dive r s ity. Nature, 405, 234-242. doi:10. 1038/350122 41 Chaturvedi, A. N. (1985). Firewood farming on degraded lands in the gangetic plain. Uttar Prad esh: Forest Bulletin. Chatu rvedi, A. N., & Beh l, H. M. (1996 ). Biomass produ ction tria ls on sodic sit e. The Indian For est er , 1 22 , 439-455. Chaturvedi, A. N., Bhatia, S., & Behl, H. M. (1991). Biomass assess- ment for shrubs. The In dian F or ester, 11 7, 1032-1035 . Dadhwal, V. K., Shukla, N., & Vora, A. B. (1997). Forest litter fall in India: A review and an estimate of litter fall carbon flux. The Ind ian Forester, 123, 45-52. Dan tas , M., & Phi lli ps on , J. (198 9 ). Li tt er fa ll and lit t er nutrient content in primary and secondary Amazonian terra firm rain forest. Journal Tropical Ecology, 5, 27-36. doi:10.1017/S026 6467400003199 Dogra, P. D. (1989). Fuel wood production potential in India through short rotation intensive culture (SRIC) system applied to tree grow- ing for fu el wood on reduced land a rea or on wastela nd sit es. The In- dian Forester, 115, 11-16. Dutta, R. K., & Agrawal, M. (2003). Restoration of opencast coal mine spo il by plant ing exoti c tree sp ecies: A case s tudy in dry trop ical re- gion. Ecologica l Engineering, 21, 143-151. doi:10.1016/j.ecoleng.2003.10.002 Evans, J. (1992). Plantation forestry in the tropics (2nd ed., p. 403). Oxford: Oxf ord Science. Fahey, T. J., & Hughes, J. W. (1994). Fine root dynamics in a northern hardwood forest ecosystem, Hubbard Brook Experimental Forest, N.H. Ecology, 82, 533-548. doi:10 .2307/226126 2 Fogel, R. (1985). Roots as primary producers in below ground ecosys- tems. In A. H. Fitter et al., (Eds.), Ecological interaction in soil plants, microbes and animals (pp. 23-26). Special Bulletin Number 4 of the British Ecological Society. Oxford: Blackwell Scientific Pub- lication. Garg, V. K. (1998). Interaction of tree crops with a sodic soil environ- ment: Potential for rehabilitation of degraded environments. Land Degradation Development, 9, 81-93. doi:10.1002/(SICI)1099-145X(199801/02)9:1<81::AID-LDR267>3. 0.CO;2-R Garg, V. K., & Jain, R. K. (1992). Influence of fuel wood trees on sodic soils. Canadia n Journal of Fo rest Research, 22, 729-735 . doi:10.1139/x92-098 Garg, V. K., & Khanduja, S. D. (1979). Minera l composi tion of leaves of some forest t rees grown on alkali soils. The In dian Forester, 105, 741-745. Garkoti, S. C. (1992). High altitude forests of central Himalaya: prod- uctivity and nutrient cycling. Ph.D. Thesis, Nainital: Kumaun Uni- versity. Gilliam, F. S., Turrill, N. L., & Adams, M. B. (1995). Herbaceous-layer and overstory species in clear-cut and mature central applachian hardwood forests. Ecological Applications, 5, 947-955. doi:10.2307/2269345 Grier, C. C., Vogt, K. A., Keys, M. R., & Edmonds, R. L. (1981). Bio- mass distribution, above and below ground production in young and mature Abies amabilis zone ecosystem of the Washington cascades. Canadian Journal Forest Research, 11, 155-167. doi:10.1139/x81-021 Gupta, R. K., & Abrol, I. P. (1990). Reclamation and management of alkli soils . Indian Journal of Agr icul t ur a l Sc i e nces, 60, 1-60. Gupta, S. R., & Bhardwaj, B. B. (1993). Biomass and productivity of forest ecosystems of Shivalik hills. Journal of Tree Sciences, 12, 57-63. Haase, R. (1999). Litterfall and nutrient return in seasonally flooded and non-flooded forest of the Pantanal, Mato Grosso, Brazil. Forest Ecology & Managemen t, 117, 129-147. doi:10.1016/S0 378-1127(98)00477-0 Habeck, J. R. (1968). Forest succession in the Glacier Peak Ce- dar-hemlock forests. Ecology, 49, 872-880. doi:10.23 07/1936539 Halpern, C. B., & Spies, T. A. (1995). Plant species diversity in natural and managed forests of the pacific northwest. Ecological Applica- tions, 5, 913-934. doi:1 0.2307/2269 343 Hara, T. (1988). Dynamics of size structure in plant populations. Trend s in Ecology & Evol ution, 3, 129-133. doi:10.1016/0169-5347(88)90175-9 Hill, M . O. (1973). Di versity and Even ness: A uni fying notat ion and its consequences. Ecology, 54, 427-432. doi:10.2307/1934352 Hurlbert, S. H. (1971). The non concept of species diversifies: a criti- que and alternative parameters. Ecology, 52, 577 -586. doi:10.2307/1934145 Huston, M. A. (1997). Hidden treatments in ecological experiments: re-evaluat ing th e ecosystem f un c tion of bi odivers it y. Oecologia, 110, 449-460. doi:10.1007/s004420050180 Jain, R. K., & Singh, B. (1998 ). Biomass product ion and soil ameliora- tion in a high density Terminalia arjuna plantation in sodic soils. Bio mass & Bioenergy , 1-6. Janzen, D. H. (1970). Herbivores and the number of tree species in tropica l forests . American Naturalist, 104, 501-528. doi:10.1086/282687 Jha, C. S. (1990). Landuse and vegetation analysis of a dry tropical forest region. Ph.D. thesis, Varanasi: Banaras Hindu University. Jha, C. S., & Singh, J. S. (1990). Composition and dynamics of dry tropical forest in relation to soil texture. Journal of Vegetation Science, 1, 60 9-614. Jorda n, C. F. (1971a ). Produ cti vity of tr opi cal forest and it s rela ti on t o a world pattern of energy storage. Journa l of Ecol ogy, 59, 127-142. doi:10.2307/2258457 Jordan, C. F. (1971b). A world pattern in plant energetic. American Sci entis t, 59, 425 -433. Kelley, W. P. (1951). Alkali soils: their formation, properties and rec- lamation. New York: Reinhold Publishing Corporation. Keyes, M. R., & Grier, C. C. (1981). Above and below ground net produc ti on in 40 year old Dou glas fi r stand s on high an d low produc- tivity sites. C anadian J o ur n al of Fore s t Re s e ar ch, 11, 599-605. doi:10.1139/x81-082 Khan, W. M. A., & Yadav, J. S. P. (1962). Characteristics and affore- station problems of saline alkali soils. The Indian Forester, 88, 259-271. Khanduja, S. D., Chandra, V., Srivastava, G. S., Jain, R. K., Misra, P. N., & Garg, V. K. (1986). Utilization of alkali soils in the plans of northern India—A case stud y (p. 54). New Delh i: Com mon w ealth Sc i - enc e Council. Khiewtan, R. S., & Ramakrishnan, P. S. (1993). Litter and fine root dynami c s of a relic t sac red grove for e st at Ch erapunj i in nort hea stern India. Forest Ecology & Management, 60, 327-344. doi:10.1016/0378-1127(93)90087-4 Khoshoo, T. N. (1987). Ecodevelopmen t of alkalin e land. A case st udy (pp. 141). New Delhi : P ublication and Inform ation D irectorate, CSIR, on beha lf of D irector NB RI, Lucknow. Kira, T., Ogawa, .H, Yoda, K., & Ogino, K. (1 967). Comparat ive eco- logical studies on three main types of forest vegetation in Thailand. Dry matter production with special reference to the Khaochong rain forest (4th ed.). Kyoto: Na ture and Life in South East Asia. Kobayashi, S. (2004). Landscape rehabilitation of degraded tropical forest ecosyst ems. Ca se study of th e CIFROR /Japan p roject in Indo- nesia and Pe ru. Forest Ec o logy and M an agement, 20 1, 13-22. doi:10.1016/j.foreco.2 004.06.009 Kohyama, T., Hara, T. (1989). Frequency distribution of tree growth in natural forest stands. Annals of Botany, 64, 47-57. Liang, J., Buongiorno, J., Monserud, R. A., Kruger, E. L., & Zhou, M. (2007). Effect of diversity of tree species and size on forest basal area growth, recruitment and mortality. Forest Ecology and Man- agemen t, 243, 116-127. doi:10.1016/j.foreco. 2007.02.028  B. SING H ET AL. Long, J. N. (1977). Trends in plant species diversity associated with development in a series of Pseudotsuga menziesiil, Gaultheria shal- lon stands. Nort hwest Science, 5 1, 119-130. Loreau, M., Mouquet , N., & Gonzalez, A. (2003). Biodiversity as spa- tial insurancein heterogeneous landscapes. Proc eedings of National Academ y of Sciences, 10 0, 12765-12 770. doi:10.1073/pnas.2235465100 Louck s, O. L. (1970) . Evolution of diversit y, efficienc y, and communi- ty stability. American Zoology, 10, 17-25. Lugo, A. E., Clark, J. R., & Child, R. D. (1998). Ecological develop- ment in the humid tropics: guidelines for planners. Morilton, Arkan- sas: Winrock International Institute of Agriculture Developm ent. Margalef, R. (1963). On certain unifying principles in ecology. Ameri- can Naturalist, 97, 357-374. doi:10.1086/28228 6 Margalef, R. (1968). Perspectives in ecological theory. Chicago: Uni- versity of Chica go Pr ess. McClaugherty, C. A, Aber, J. D., & Melillo, J. M. (1982). The role of fine root s in th e organic matt er and nit rogen budget s of two forest ed ecosystems. Ecology, 63, 1481-1490. doi :10.2307/1 938874 Misra, R. (1968). Ecology work book. Calcutta: Oxford and IBH Pub- lishing Company. Murphy, P. G., & Lugo, A. E. (1986a). Ecology of tropical dry forests. Annu al Review of E co logy , E v oluti o n and Sys t emat ic s, 17, 67-88. doi:10.1146/annurev.es. 17.110186 .000435 Murphy, P. G., & Lugo, A. E. (1986b). Structure and biomass of a subt ropical dry forest in Puert o Rico. Biotropica, 18, 89-96. doi:10.2307/2388750 Nagaike, T., Kamitani, T., & Nagashizuka, T. (1999). The effect of shelter wood logging on the diversity of plant species in a beech (Fagus crenata) forest in Japan. Forest Ecology and Management, 118, 161-171. doi:10.1016 /S0378-1127(98)00500-3 Naidu, R., & Rengasamy, P. (1993). Ion interactions and constraints to plant nutrition in Australian sodic soils. Australian Journal of Soil Research, 31, 801-819. doi:10.1071/SR9930801 Nich olson, S. A., & Monk, C. D. (1974). Pla nt species di versity in old field succession on the Georgi a Piedmont. Ecology, 55, 1075-1085. doi:10.2307/1940357 Nicholson, S. A., & Scott, J. T. (1972). Successional trends in plant communities in the Lake George drainage basin. Bulletin of E colog- ical S ociet y o f Am eric a, 53, 17. Odum, E. P. (1960). Organic production and turnover in old-field suc- cession. Ecology, 41, 34-49. doi:10.2307/1931937 Odum, E. P. (1969). The strategy of ecosystem development. Science, 164, 262-270. doi:10.1126 /science.164.3877.262 Pandey, G. C. (1966). A short not on introduction of tree species on wild “Usar” lands of Uttar Prad esh (p. 377). Proceedings of XI Si lva Conference, Dehradun. Pandey, V. C., Singh, K., Singh, B., Singh, R. P., (2011). New ap- proaches to enhance eco-restoration efficiency of degraded sodic Lands: critical research needs and future prospects. Ecological Res- toration, 29, 322-325. doi:10 .3368/er.29.4.322 Parthsarthy, N. (1988). Seasonal dynamics of fine roots in a tropical forest in south India. Journal of Indian Botanical Society, 66, 338- 345. Patt en, B. C. (1962 ). Species Di versity in net phytoplank ton of Raritan Bay. Jour na l o f M arine Res earch, 20 , 57-75. Peet, R. K. (1978). Forest vegetation of the Colorado Front Range: Patterns of species diversity. Vegetation, 37, 65-78. doi:10.1007/BF00126830 Persson, H. (1979). Fine root production, mortality and decomposition in forest ecosystems. Vegetation, 41, 101-109. doi:10.1007/BF00121422 Persson, H. (1980). Structural properties of the field and bottom layers at Ivantjarnsheden. In T. Person (Ed.), Structure and function of northern coniferous forest—An ecosystem study (pp. 153 -163). Sto- ckholm: Swedish Natural Sci enc e Resarch Council. Persson, H. A. (1978). Root dynamics in a young Scots pine stand in central Sweden. O ikos, 3 0, 508-519. doi :10.2307 /3543346 Petit, B., & Montagnini, F. (2004). Growth equations and rotation ages of ten native tree species in mixed and pure plantations in the humid Neotropics. Forest Eco logy & Management, 199, 243-257. Pielou, E. C. (1966). The measurement of diversity in different types of biologi cal collect ions. Journal of Theoratical Biology, 13, 131-144. doi:10.1016/0022-5193(66)90013-0 Piotto, D., Montagnini F., Ugalde, L., & Kanninen, M. (2003a). Growth and effects of thinning of mixed and pure plantations with native trees in humid tropical Costa Rica. Forest Ecology and Management, 177, 427-439. doi:10.1016 /S0378-1127(02)00445-0 Piotto, D., Montagnini, F., Ugalde, L., & Kanninen, M. (2003b). Per- formance of forest plantations in small and medium-sized farms in the Atlantic lowlands of Costa Rica. Forest Ecology and Manage- ment , 175, 195-204. doi:10.1016/S0378-1127(02)00127-5 Prasad, K. G., & Sharma, S. D. (1990). Status report on afforestation of salt affected soils in India. Proc. National Seminar on Technology for Afforestation of Wastelands (pp. 41). Dehradun, Uttar Pradesh: For- est Research Institute. Proctor, J., Anderson, J. M., Chai, P., & Vallack, H. W. (1983). Eco- logical studies in four contrasting lowland rain forests in Gunung Mulu National Park, Sarawak. I. forest environments structure and floristics. Journal of Ecology, 71, 237-260. doi:10.2307/2259975 Rai, S. N., & Proctor, J. (1986). Ecological studies on four rainforests in Karn ataka, India. I. Environment, structure, floristic and biomass. Journal of Ecology, 74, 439-454. d oi:10.230 7/2260266 Rao, P., Barik, S. K., P and ey, H. N. , & Tripa thi , R. S . (199 0). C ommu- nity composition and tree population structure in a sub-tropical broad-leaved forest along a disturbance gradient. Vegetation, 88, 151-162. doi:10 .1007/BF0004 4832 Sandhu, S. S., & Abrol, I. B. (1981). Growth responses of Eucalyptus tereticornis and Acacia nilotica to selected cultural treatments in a highly sodic soil. I ndian Journal of Agriculture Science, 51, 437-443. Santantonio, D, & Hermann R. K. (1985). Standing crop production and turnover of fine roots on dry moderate and wet sites of mature Douglas fir in Western Oregon. Annals Forestry Science, 42, 113- 142. doi:10.1051/forest:19850201 Santan tonio, D., & Santan tonio, E. (1987 ). Effect of thinin g on produc- tion and mortality of fine roots in a Pinus radiata plantation on the fertile site in New Zea l and. Canadian Journal of Forest Research, 17, 919-928. doi:10.1139/x87-14 4 Satoo, T. (1971). Primary production relations of coniferous forests in Japan, In P. Duvigneaud (Ed.), Productivity of forest ecosystem (pp. 191-205). Paris: Unesco. Schoonmaker, P., & McKee, A. (1988). Species composition and di- versity during secondary succession of coniferous forests in the West ern Cascade Mountains of Oregon . Forest Science, 34, 960-979. Schulze, E. D., & Mooney, H. A. (1993). Biodiversity and Ecosystem Function. Berlin: Springer-Verlag. Shafi, M. I., & Yaranton, G. A. (1973). Diversity floristic richness and speci es evenness durin g a secondary (post fire) successi on. Ecology, 54, 897-902. doi :10.2307/193 5686 Shannon, C. E., & Weaver, W. (1963). The mathematical theory of communication. Urbana: University of Illinois Press. Sharma, S. D., Prasad, K. G., Rai, L., & Malik, N. (1992). Develop- ment of technology for afforestation of sodic solis. I-leguminous species. The Indian Forester, 108, 547-559. Sharma, S. K. (1988). Recent advances in afforestation of salt affected soils in India. Adva nc es in For est Re search , 2, 17-31. Shukla, A. K., & Misra, P. N. (1993). Improvement of sodic soil under tree cover. The Indian Forester, 119, 43-52. Shukla, S. K., Singh, K., Gautam, N. N., Singh, B. (2011). Biomass productivity and nutrient availability of Cynodon da ctylon (L.) Pers. growing on soils of different sodicity stress. Biomass & Bioenergy, 35, 3440-3447. doi:10.101 6/j.biombi oe.2011. 04.027 Simmons, J. (1993). Lime effects on carbon and nitrogen dynamics of a northern hardwood forest floor. Ph.D. Thesis, Ithaca, New York: Cornell University. Simpson, E. H. (1949). Measurement of diversity. Nature, 163, 68 8. doi:10.1038/163688a0 Singh, A. N., Raghubanshi, A. S., & Singh, J. S. (2004). Impact of native tree plantations on mine spoil in a dry tropical environment. Forest Ec ology an d Management , 187, 49-60. doi:10.1016/S0 378-1127(03)00309-8 Singh, A. N., Raghubanshi, A. S., & Singh, J. S. (2002). Plantation as a tool for mine spoil restoration. Current Science, 82, 1436-1441. Singh, B. (1996). Influence of forest litter on reclamation of semiarid sodic soils. Arid Soil Research Rehabilitation, 10, 201-211. doi:10.1080/15324989609381435  B. SING H ET AL. Singh, B. (1997). Deforestation consequences and rehabilitation of sodic wastelands in the gangetic plains. In S.K. Gupta and K. Kumar (Eds.), Environmental Degradation (pp. 119-134). Varanasi: Tara Book Agency. Singh, B. (1998). Biomass pot entia ls of some firewood shrub s of North India: Short communication. Biomass, 16, 199-203. doi:10.1016/0144-4565(88)90092-3 Singh, B. (1998). Biomass production and nutrient dynamics in three clones of Populus deltoids planted on Indo-Gangetic plains. Plant and Soil, 203, 15-26. doi:10.1023/A:1004388903402 Singh, B., Garg, V. K., Singh, P. K., & Tripat hi, K. P. (2004 ). Diversi t y and Productivity effect on th e Amelioration of Afforested Sodic Soils. The Indian Forester, 130, 14-26. Singh, B., Tripathi, K. P., Jain, R. K., & Behl, H. M. (2000). Fine root biomass and tree species effects on potential N mineralization in af- forested sodic soils. Plant and Soil, 21 9, 81-89. doi:10.1023/A:1004720826347 Singh, J. S., Rawat, Y. S., & Chaturvedi, O. P. (1984). Replacement of oak forest with pine in the Himalaya affects the nitrogen cycle. Na- ture, 11, 54-60. d oi:10.1038 /311054a0 Singh, K., Yadav, J. S. P., & Sharma, S. K. (1990). Performance of shisham (Dalbergia sissoo) in salt af fected s oils . The Indian Forester, 116, 154-162. Singh, K., Yadav, J. S. P., & Singh, V. (1992). Tolerance of trees to soil sodicity. Journal of Indian Society of Soil Science, 40, 173-179. Singh, K.P., & Misra, R. (1979). Structure and function of natural, modified and silvicultural ecosystem in eastern Uttar Pradesh. Final Technical Report (1975-1978). Banaras Hindu University, Varanasi: MAB Research Pro ject. Singh, K. P., & Singh, R. P. (1981). Seasonal variations in biomass and energ y of small roots in tropical dry deciduous forest, Varanasi, India. Oikos, 37 , 88-92. doi:10.2307/35440 77 Singh, L., & Singh, J. S. (1991). Species structure, dry matter dynamics and carbon flux of a dry tropical forest in India. Annals of Botany , 68, 263-273. Singh, O., Sharma, D. C., Negi, M. S., & Singh, R. (1994). Leaf litter production and decomposition in Dalbergia sissoo and Bombax cei- ba plantations in U.P. The Indian Forester, 120, 682-688. Sing h, P. (199 1) . Man ag emen t s tr at egi es f or was t elan d d evel op men t . In R. K. Singh, A. K. Saxena and I. S. Singh, (Eds.), Agroforestry— Present status and scope for future development in farming systems (pp. 133-142). Kumarganj, Faizabad: Narendra Dev University of Agriculture and Technology. Singh, S. P., & Singh, J. S. (1989). Ecology of central Himalayan fo- rests with special emphasis on sal forest ecosystem. In J. S. Singh and B. Gopal (Eds.), Perspectives in Ecology, Professor S.C. Pan- deya Commemoration Volume (pp. 193-232). New Delhi: M/S Jag- mander Book Agency. Sissay, B. (1986). Salt wasteland in Ethiopia: Potential for production of forage and fuel. Reclamat io n R eve ge t a tion R es earc h, 5, 59-64. Srivas tava, G. S. (1970). Beha viour and adoptabi lity of some orn amen- tal plants to “usar” soils. Indian Jou rnal of Orna mental Hort icultu re, 11, 1-3. Srivastava, G. S. (1987). A man-made forest on sodic soils. In T.N. Khoshoo (Ed.), Ecodevelopment of alkaline land, Banthra—A case stud y (pp. 124-128). Lucknow: NBRI, C SIR. Sum ner, M. E. (199 3). Sodi c soils: New per specti ves. Australi an Jour- nal of Soil Research, 31, 683-750. doi:10.1071/ SR9930683 Tomar, O. S., & Yadav, J. S. P. (1980). Effect of saline irrigation water of varying EC, SAR and RSC levels on germination and seedling growth of some forest species. Indian Journal of Forestry, 3, 306- 314. Totey, N. G., Kulkarni, R., Showmik, A. K., Khatri, P. K., Dahia, V. K., & Prasad, A. (1987). Afforestation of salt affected wasteland I— Screen i n g of for est t ree s p eci es of Mad h ya P rad es h for s a lt t olerance. The Indian Forester, 113, 805-815. Toth, B. (1981). Afforestation on salt affected soils in Hungary. Agro- kemia Es Talajtan Tom, 30, 205-212. Tripathi, K. P., & Singh, B. (2009). Species diversity and vegetation stru cture acros s vari ous strat a in natu ral and plant ation forest s in Ka- tarniaghat Wildlife Sanctuary, North India. Tropical Ecology, 50, 191-200. Usma n, S., Sin gh, S. P., & Rawat, Y . S. (1999 ). Fine root p roductivity and turnover in two evergreen Central Himalayan forests. Annals of Botany, 84, 87-94. doi :10.1006/ anbo.1999.0894 Vasalakshi, N. (1994). Fine root dynamics in two tropical dry evergreen forest of Southern Indian. Journal Bioscience, 19, 103-116. doi:10.1007/BF02703473 Verma, R. K., Totey, N. G., & Gupta, B. N. (1997). Analysis of forest vegetation in the permanent preservation plot of Tamna in Orrisa. The Indian Forester, 123, 1007-1016. Verma, S. C., Jain, R. K., Rao, M. V., Misra, P. N., & Murty, A. S. (1982 ). Influenc e of canop y on soil compositi on of man-made for est in alkali soil of Banthra, Lucknow. The Indian Forester, 108, 431- 437. Vitousek, P. M. (1984). Litterfall, nutrient cycling and nutrient limita- tion in tropical forests. Ecology, 65, 285-298. doi:10. 2307/1939481 Vitousek, P. M., & Sanford, R. L. (1986). Nutrient cycling in moist tropical forests. Annual Review of Ecology and Systematics, 17, 137-167. doi:10 .1146/annur ev. es .17.11 0186.001033 Vogt, K. A., Grier, C. C., & Vogt, D. J. (1986). Production, turnover and nutrient dynamics of above and belowground detritus of world forests. Advance Eco logic a l R es tor at ion, 15 , 303-377. doi:10.1016/S0 065-2504(08)60122-1 Vyas, L. N., Garg, R. K., & Vyas, L. N. (1977). Stand structure and aboveground biomass in dry deciduous forests of Aravalli Hills at Udaipur (Rajasthan), India. Biologia (Bratislava), 32, 265-270. Yadav, J. S. P. (1975). Improvement of saline alkali soil through bio- logical m ethods. The Indian Fore s ter, 101, 385-395. Yadav, J. S. P. (1980). Salt-affected soils and their afforestation. The Indian Forester, 106, 259-272. Yadav, J. S. P., & Singh, K. (1970). Tolerance of certain forest sp ecies to varying degree of salinity and alkalinity. The Indian Forester, 96, 587-599. Zobel, D. B., McKee, A., Hawk, G. M., & Dyrness, C. T. (1976). Rela- tionships of environment to the composition, structure and diversity of forest communities of the central western cascades of Oregon. Ecological Monographs, 46, 135-156. doi:10.2307/1942248
|