Open Journal of Com p osi t e M at e ri al s, 2011, 1, 10-18
doi:10.4236/ojcm.2011.11002 Published Online October 2011 (http://www.SciRP.org/journal/ojcm)
Copyright © 2011 SciRes. OJCM
Non-Linear Effect of Volume Fraction of Inclusions on the
Effective Thermal Conductivity of Composite Materials: A
Modified Maxwell Model
Sajjan Kumar1, R ajpal Sin gh Bhoopal1, Pradeep Kumar Sharma1, Radhe y Shyam Beniwal2,
Ramvir Singh1*
1Heat Transfer Laboratory, Department of Physics, University of Rajasthan, Jaipur, India
2National Institute of Science Communication and Information Resources, CSIR, New Delhi, India
E-mail: *singhrvs@rediffmail.com
Received August 6, 2011; revised September 13, 2011; accepted September 23, 2011
Abstract
In this paper, non-linear dependence of volume fraction of inclusions on the effective thermal conductivity of
composite materials is investigated. Proposed approximation formula is based on the Maxwell’s equation, in
that a non-linear term dependent on the volume fraction of the inclusions and the ratio of the thermal con-
ductivities of the polymer continuum and inclusions is introduced in place of the volume fraction of inclu-
sions. The modified Maxwell’s equation is used to calculate effective thermal conductivity of several com-
posite materials and agreed well with the earlier experimental results. A comparison of the proposed relation
with different models has also been made.
Keywords: Effective Thermal Conductivity, Empirical Correction Term, Composite Materials
1. Introduction
Theoretical prediction of effective thermal conductivity
(ETC) for multi-phase composite materials is very useful
not only for analysis and optimization of the material
performance, but also for new material designs. The cor-
rect modeling for thermal coefficients of these materials
has a great value due to their excellent thermal and me-
chanical properties and their use in industrial applica-
tions and technological fields. The challenges in model-
ing complex materials come mainly from the inherent
variety and randomness of their internal microstructures,
and the coupling between the components of different
phases. In literature, several attempts have been made to
develop expressions for effective thermal conductivity of
two-phase materials by various researchers such as,
Maxwell [1], Lewis and Nielsen [2], Cunningham and
Peddicord [3], Torquato [4], Hadley [5], Agari and Uno
[6], Misra et al. [7], Singh and Kasana [8], and Verma et
al. [9]. Lewis and Nielsen [2] reported a semi-empirical
model incorporating the effect of the shape and the ori-
entation of particles or, the type of packing for a
two-phase system. Other approach for a thermal conduc-
tivity prediction was initiated by Torquato [4] for dis-
persed spherical or cylinder particles. This approach also
takes into account the filler geometry and the statistical
perturbation around each filler particle. Agari and Uno [6]
also proposed another semi-empirical model, which is
based on the argument that the enhanced thermal con-
ductivity of highly filled composites originates from
forming conductive chains of fillers. Verma et al. [9]
developed a porosity dependence correction term for
spherical and non-spherical particles. Calmidi and Ma-
hajan [10] presented a one-dimensional heat conduction
model, considering the porous medium to be formed of
two-dimensional array of hexagonal cells. Bhattacharya
et al. [11] extended the analysis of Calmidi and Mahajan
for metal foams of a complex array of interconnected
fibers with an irregular lump of metal at the intersection
of two fibers. Pabst and Gregorova [12] developed a
simple second-order expression for the porosity depend-
ence of thermal conductivity.
In this study, a non-linear second-order correction
term is developed in place of volume fraction of inclu-
sions and used in the Maxwell’s model [1] for estimation
of ETC of metal filled composite materials. Originally,
Maxwell’s model was derived for low dispersion of filler
particles in the matrix. Here, a non-linear second-order
S. KUMAR ET AL.11
empirical expression in place of filler volume fraction
has been proposed and the unknown coefficients have
been determined using boundary conditions and experi-
mental results reported earlier. Volume fraction of inclu-
sions in the Maxwell’s model is then replaced by the
non-linear second-order correction term. The results ob-
tained using modified Maxwell’s model show a better
agreement with experimental values.
2. Mathematical Formulation
By solving Laplace’s equation and assuming absence of
any interactions between the filler particles, Maxwell [1]
calculated the effective thermal conductivity (ETC) of a
random distribution of spheres in a continuous medium
for low filler concentrations as:
22(
2(
fm fm
em
fm fm
kk kk
kk
kk kk
 
 
)
)
(1)
Where e, m and k k
f
k are effective thermal conduc-
tivity, matrix thermal conductivity and thermal conduc-
tivity of fillers, respectively, and
is the volume frac-
tion of inclusions. This model was developed for low
dispersions i.e. for lower volume fraction of filler phase.
Maxwell’s model fails to predict ETC of composite ma-
terials having higher volume fraction metallic inclusions.
In composite materials, the inclusions most frequently
used are particles of carbon, aluminum, copper, iron,
silicon, brass, graphite and magnetite, respectively.
Therefore, to predict ETC of composite materials some
correction is needed in the Maxwell’s model. This cor-
rection may be in thermal conductivity of the constituent
phases or in the fractional volume of the constituents.
Pabst and Gregorova [12] developed a model, which
shows the non-linear porosity dependent thermal con-
ductivity of two-phase materials. Verma et al. [9] have
also developed a model for ETC of two-phase materials
with spherical and non-spherical inclusions using a cor-
rection term. Some experimental results [13-18] also
show the non-linear dependence of ETC on the volume
fraction of filler phase. On reviewing all these facts, we
concluded that there should be a non-linear correction
term in place of volume fraction of inclusions in dis-
similar materials. Therefore, keeping in mind the above
facts, we assumed a non-linear second-order correction
term in place of volume fraction of inclusions as:
2
p
F

 (2)
Here α and β are empirical constant obeying the fol-
lowing boundary condition as:
(1) When 0
then 0
p
F
and
(2) When 1
then 1
p
F
From Equation (2), condition (1) is satisfied and to
satisfy condition (2) constants
and
should have
the following relation:
1
(3)
By using Equation (3)
2
(1 )
p
F

 (4)
Therefore, on replacing volume fraction of inclusions
by correction term Fp in Maxwell’s Equation (1), the
expression for ETC becomes
22(
2(
)
)
f
mpfm
em
fmpfm
kkFkk
kk
kkFkk
 
 (5)
Using this relation, we have calculated ETC of several
samples like high-density polyethylene (HDPE), polypro-
pylene (PP) filled with metal particles, epoxy resin filled
with SiO2, α-Al2O3, AlN and sandstones filled with air,
n-Hepten, and water respectively.
3. Results and Discussion
The value of empirical constant
is found to depend
upon ratio of thermal conductivity of the constituents,
size, shape and distribution of filler particles in the ma-
trix and therefore have different values for different type
of materials. To determine
, curve-fitting method was
applied for various samples using data reported earlier
[13-18] and found that the expression for α comes out to
be:
1/3
f
m
k
A
B
k




(6)
Here A and B are slope and intercept of the curves for
various samples. Optimized values of these constants have
been used in such a way that, it should have consistency
with the boundary conditions (1) and (2). The values of A
and B of various samples computed using relation (6) are
shown in Table 1.
To validate modified Maxwell’s relation (5), several
samples of HDPE and PP filled with metal particles, ep-
oxy resin filled with SiO2, α-Al2O3 and AlN and sand-
stones filled with air, n-Hepten, and water with increasing
filler concentration have been taken in the present compu-
tations. For calculations purpose, input parameters have
been used from the results published earlier [13-18]. The
values of ETC for various samples are calculated using
modified Maxwell’s relation (5) and the comparison of
predicted values and experimental results are shown in
Figures 1-15.
The results for HDPE filled with metal particle are
shown in Figures 1-4. It is seen from the Figures that
models [1, 2] predicts higher value of ETC at lower filler
concentration where as our model have better predictions,
but at higher filler concentration, our model predict little
Copyright © 2011 SciRes. OJMS
S. KUMAR ET AL.
12
Table 1. Value of A and B for different samples.
S. No. Sample A B
1. HDPE/Sn 0.03171 –0.73279
2. HDPE/Zn 0.03008 –3.03067
3. HDPE/Cu 0.01028 –3.69046
4. HDPE/Fe 0.03143 –1.89218
5. HDPE/Si 0.00417 0.71951
6. PP/Al1 0.00372 –1.12155
7. PP/Al2 0.00294 –0.21239
8. Epoxy resin/SiO2 –0.012339 2.201449
9. Epoxy resin/α-Al2O3 0.0007188 1.773956
10. Epoxy resin/AlN –0.002051 3.397643
11. HDPE/Al2O3 0.009658 1.437955
12. HDPE/Bronze 0.073825 3.910710
13. Sandstone/Air –2031.33973 7.51613
14. Sandstone/n-Hepten –179.06678 4.28328
15. Sandstone/Water –28.56255 3.27327
Figure 1. Comparisons of experimental and predicted values of ETC; HDPE filled w ith Tin.
Figure 2. Comparisons of experimental and predicted values of ETC; HDPE filled with Zinc.
lower values of ETC. Figures 2-4 show that the values
of ETC calculated by most of the existing models are
higher but our model predicts fairly well in the whole
range of filler volume fractions.
It has been observed from the Figures 5-7 that ETC
have a rapid increment when volume fraction of filler
phase is increased. Here filler phase has higher thermal
conductivity than the matrix phase. At lower volume
fractions, filler particles are randomly scattered in the
matrix phase but when volume fraction of inclusions
C
opyright © 2011 SciRes. OJCM
S. KUMAR ET AL. 13
Figure 3. Comparisons of experimental and predicted values of ETC; HDPE filled with Copper.
Figure 4. Comparisons of experimental and predicted values of ETC; HDPE filled with Iron.
Figure 5. Comparisons of experimental and predicted values of ETC; HDPE filled with Silicon.
increases, then particles begin to touch each other and
form conductive chains in the direction of heat flow, due
to this ETC increases rapidly. Probability of forming
conductive chains is higher in the case of smaller parti-
cles. Slightly oxidized aluminum particles for the prepa-
ration of PP/Al samples [14] were used and the thermal
conductivity value used for our computations of ETC is
the one given for pure heavy aluminum. In reality, the
thermal conductivity of the fillers used in this computa-
tion is probably lower than this value, and depends on
the mean size of the particles. Therefore, at higher con-
centration of filler particles, modified Maxwell’s model
predicts higher value of ETC then the experimental re-
sults and larger deviation occur. However, the model
predicts fairly well up to 50% of filler concentration.
The results for Epoxy resin and HDPE filled with ox-
C
opyright © 2011 SciRes. OJCM
S. KUMAR ET AL.
14
Figure 6. Comparisons of experimental and predicted values of ETC; Poly propylene filled with Aluminum (mean diameter of
8 µm).
Figure 7. Comparisons of experimental and predicted values of ETC; Polypropylene filled with Aluminum, (mean diameter
of 44 µm).
Figure 8. Comparisons of experimental and predicted values of ETC; Epoxy resin filled with SiO2.
ides are shown in Figures 8-12. It is observed from Fig-
ures 8-10 that Maxwell’s model [1] calculate lower
value of ETC but modified Maxwell’s Equation (5) pre-
dict better value than [16]. Figure 11 shows that the
models [1,2] predict lower value of ETC but our model
prediction have better agreement and it is also observed
from Figure 12.
The results for ETC of sandstone filled with air,
C
opyright © 2011 SciRes. OJCM
S. KUMAR ET AL. 15
Figure 9. Comparisons of experimental and predicted values of ETC; Epoxy resin filled with Al2O3.
Figure 10. Comparisons of experimental and predicted values of ETC; Epoxy resin filled with AlN.
Figure 11. Comparisons of experimental and predicted values of ETC; HDPE filled with Aluminum Oxide.
n-Hepten and water are shown in Figures 13-15. We
note from these Figures that ETC decreases as the vol-
ume fraction of filler phase increases due to the lower
value of thermal conductivity of filler phase. Models [1,2]
observe this effect but they predict higher values of ETC.
It is noticed from these Figures that modified Maxwell’s
model have better agreement with the experimental re-
sults [17].
At low filler volume content, up to 15%, a moderate
increase in thermal conductivity was observed in the
earlier results. We noticed that in this region, most of the
predictive models of thermal conductivity are applicable
C
opyright © 2011 SciRes. OJCM
S. KUMAR ET AL.
16
Figure 12. Comparisons of experimental and predicted values of ETC; HDPE filled with Bronze.
Figure 13. Comparisons of experimental and pre dicted values of ETC; Sandstones filled with Air.
Figure 14. Comparisons of experimental and predicte d values of ETC; Sandstones filled with n-Hepten.
on composite materials. For more heavily metal filled
composites, a non-linear increase in thermal conductivity
was observed and almost all the models fail to predict
ETC in this region. Because most of the theoretical mod-
els do not consider the size, shape and distribution of
filler particles in the matrix and at higher filler content,
the filler particles tend to form agglomerates due to it
conductive chains form, resulting in a rapid increase in
thermal conductivity.
4. Conclusions
In the present paper, it is concluded that there is a linear
variation in ETC when filler particles approaches up to
C
opyright © 2011 SciRes. OJCM
S. KUMAR ET AL. 17
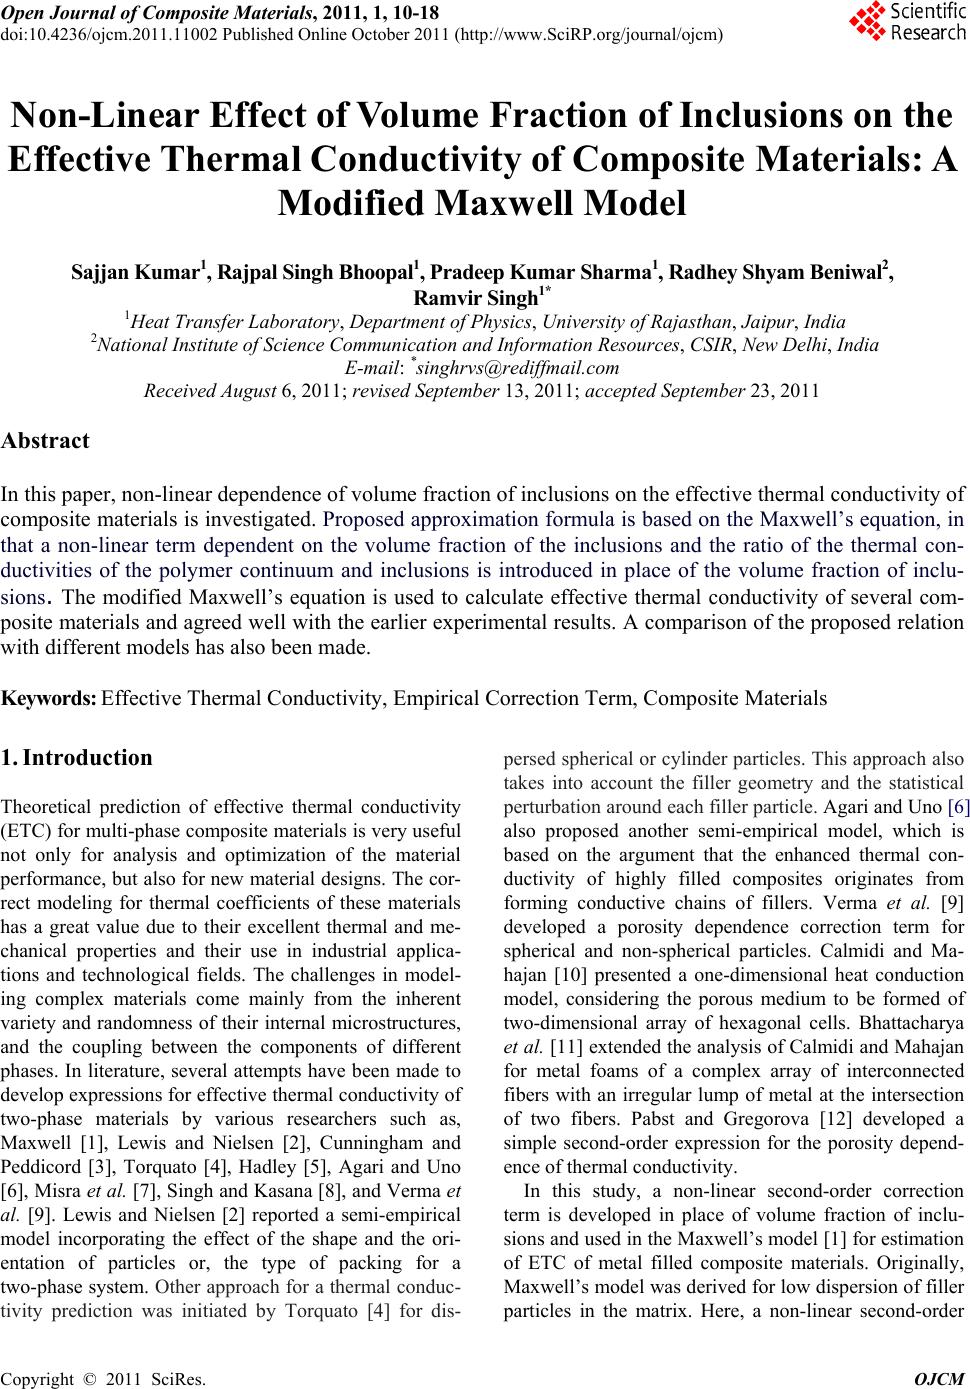
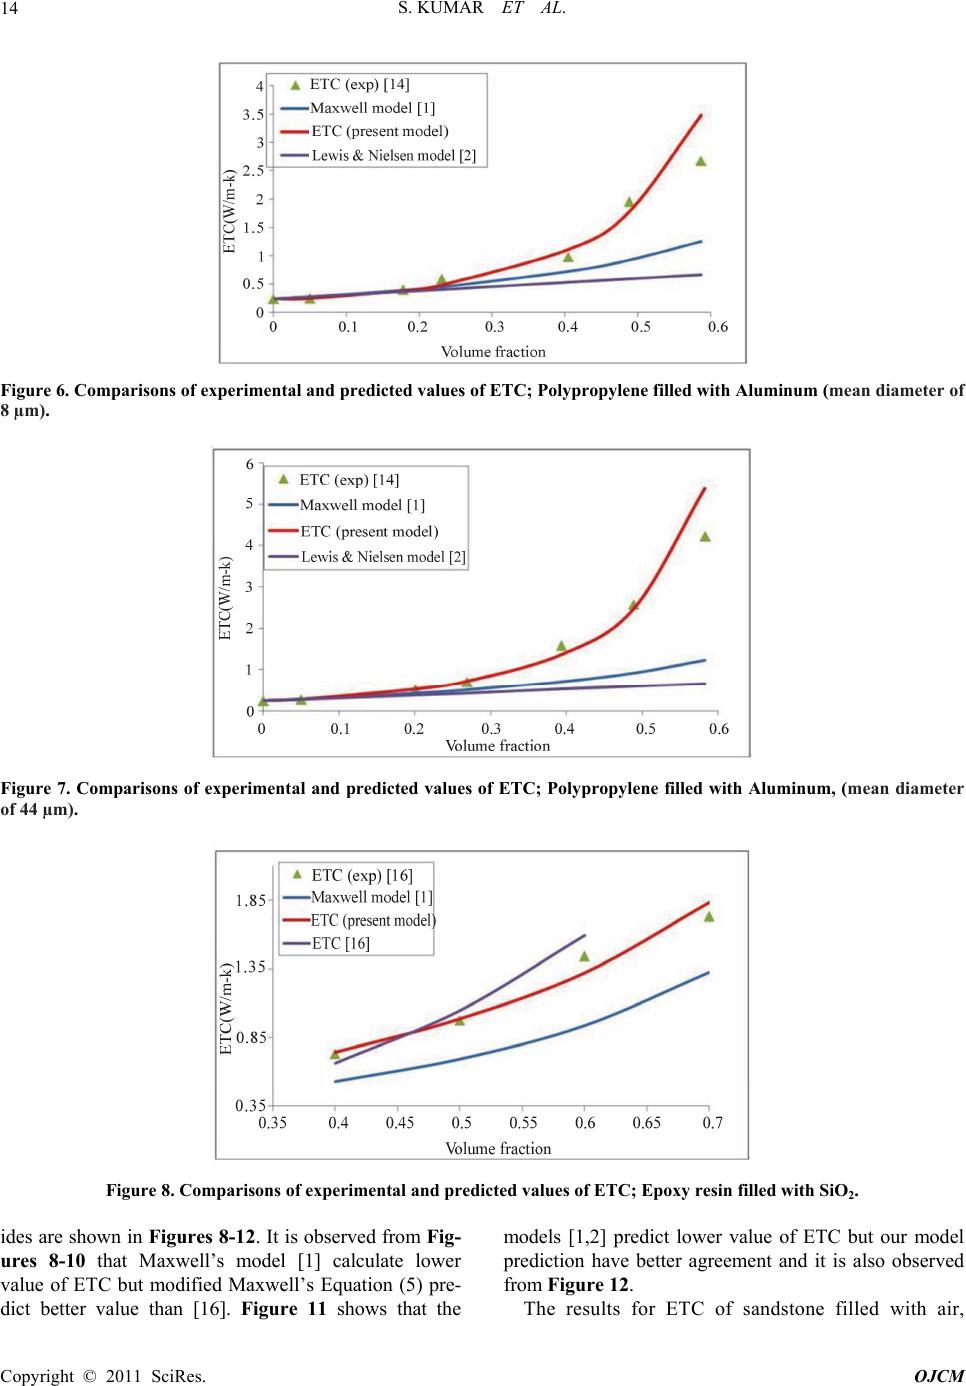
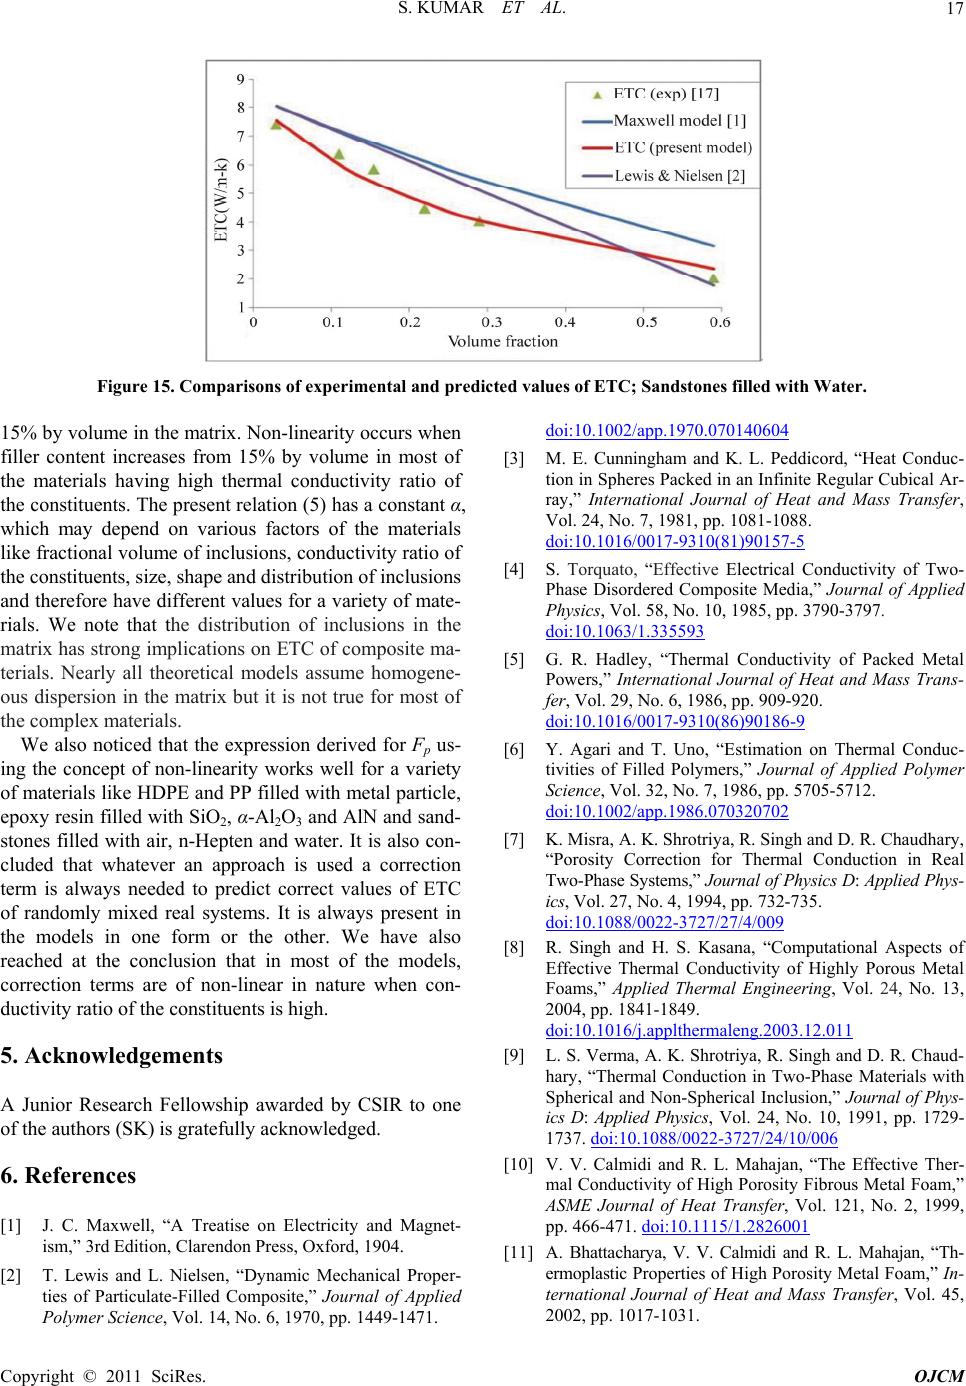
Figure 15. Comparisons of experimental and predicted values of ETC; Sandstones filled with Water.
15% by volume in the matrix. Non-linearity occurs when
filler content increases from 15% by volume in most of
the materials having high thermal conductivity ratio of
the constituents. The present relation (5) has a constant α,
which may depend on various factors of the materials
like fractional volume of inclusions, conductivity ratio of
the constituents, size, shape and distribution of inclusions
and therefore have different values for a variety of mate-
rials. We note that the distribution of inclusions in the
matrix has strong implications on ETC of composite ma-
terials. Nearly all theoretical models assume homogene-
ous dispersion in the matrix but it is not true for most of
the complex materials.
We also noticed that the expression derived for Fp us-
ing the concept of non-linearity works well for a variety
of materials like HDPE and PP filled with metal particle,
epoxy resin filled with SiO2, α-Al2O3 and AlN and sand-
stones filled with air, n-Hepten and water. It is also con-
cluded that whatever an approach is used a correction
term is always needed to predict correct values of ETC
of randomly mixed real systems. It is always present in
the models in one form or the other. We have also
reached at the conclusion that in most of the models,
correction terms are of non-linear in nature when con-
ductivity ratio of the constituents is high.
5. Acknowledgements
A Junior Research Fellowship awarded by CSIR to one
of the authors (SK) is gratefully acknowledged.
6. References
[1] J. C. Maxwell, “A Treatise on Electricity and Magnet-
ism,” 3rd Edition, Clarendon Press, Oxford, 1904.
[2] T. Lewis and L. Nielsen, “Dynamic Mechanical Proper-
ties of Particulate-Filled Composite,” Journal of Applied
Polymer Science, Vol. 14, No. 6, 1970, pp. 1449-1471.
doi:10.1002/app.1970.070140604
[3] M. E. Cunningham and K. L. Peddicord, “Heat Conduc-
tion in Spheres Packed in an Infinite Regular Cubical Ar-
ray,” International Journal of Heat and Mass Transfer,
Vol. 24, No. 7, 1981, pp. 1081-1088.
doi:10.1016/0017-9310(81)90157-5
[4] S. Torquato,Effective Electrical Conductivity of Two-
Phase Disordered Composite Media,” Journal of Applied
Physics, Vol. 58, No. 10, 1985, pp. 3790-3797.
doi:10.1063/1.335593
[5] G. R. Hadley, “Thermal Conductivity of Packed Metal
Powers,” International Journal of Heat and Mass Trans-
fer, Vol. 29, No. 6, 1986, pp. 909-920.
doi:10.1016/0017-9310(86)90186-9
[6] Y. Agari and T. Uno, “Estimation on Thermal Conduc-
tivities of Filled Polymers,” Journal of Applied Polymer
Science, Vol. 32, No. 7, 1986, pp. 5705-5712.
doi:10.1002/app.1986.070320702
[7] K. Misra, A. K. Shrotriya, R. Singh and D. R. Chaudhary,
“Porosity Correction for Thermal Conduction in Real
Two-Phase Systems,” Journal of Physics D: Applied Phys-
ics, Vol. 27, No. 4, 1994, pp. 732-735.
doi:10.1088/0022-3727/27/4/009
[8] R. Singh and H. S. Kasana, “Computational Aspects of
Effective Thermal Conductivity of Highly Porous Metal
Foams,” Applied Thermal Engineering, Vol. 24, No. 13,
2004, pp. 1841-1849.
doi:10.1016/j.applthermaleng.2003.12.011
[9] L. S. Verma, A. K. Shrotriya, R. Singh and D. R. Chaud-
hary, “Thermal Conduction in Two-Phase Materials with
Spherical and Non-Spherical Inclusion,” Journal of Phys-
ics D: Applied Physics, Vol. 24, No. 10, 1991, pp. 1729-
1737. doi:10.1088/0022-3727/24/10/006
[10] V. V. Calmidi and R. L. Mahajan, “The Effective Ther-
mal Conductivity of High Porosity Fibrous Metal Foam,”
ASME Journal of Heat Transfer, Vol. 121, No. 2, 1999,
pp. 466-471. doi:10.1115/1.2826001
[11] A. Bhattacharya, V. V. Calmidi and R. L. Mahajan, “Th-
ermoplastic Properties of High Porosity Metal Foam,” In-
ternational Journal of Heat and Mass Transfer, Vol. 45,
2002, pp. 1017-1031.
C
opyright © 2011 SciRes. OJCM
S. KUMAR ET AL.
18
doi:10.1016/S0017-9310(01)00220-4
[12] W. Pabst and E. Gregorova, “A New Percolation- Thresh-
old Relation for the Porosity Dependence of Thermal Con-
ductivity,” Ceramics International, Vol. 32, No. 1, 2006,
pp. 89-91. doi:10.1016/j.ceramint.2004.12.007
[13] N. M. Sofian, M. Rusu, R. Neagu and E. Neagu, “Metal
Powder-Filled Polyethylene Composites V. Thermal Prop-
erties,” Journal of Thermoplastic Composite Materials,
Vol. 14, 2001, pp. 20-33.
doi:10.1106/9N6K-VKH1-MHYX-FBC4
[14] A. Boudenne, L. Ibos, M. Fois, E. Gehin and J. C. Ma-
jeste, “Thermophysical Properties of Polypropylene/
Aluminum Composites,” Journal of Polymer Science Part
B: Polymer Physics, Vol. 42, No. 4, 2004, pp. 722-732.
doi:10.1002/polb.10713
[15] D. Kumlutas and I. H. Tavman, “A Numerical and Ex-
perimental Study on Thermal Conductivity of Particle
Filled Polymer Composite,” Journal of Thermoplastic Com-
posite Materials, Vol. 19, 2006, pp. 441-455.
doi:10.1177/0892705706062203
[16] S. W. Kim, B. Choi, S. H. Lee and K. H. Kang, “Meas-
urement of Thermophysical Properties of Articulate- Filled
Polymer Composites,” High Temperature—High Pres-
sures, Vol. 37, 2008, pp. 21-30.
[17] W. Woodside and J. H. Messmer, “Thermal Conductivity
of Porous Media II Consolidated Rocks,” Journal of Ap-
plied Physics, Vol. 32, No. 9, 1961, pp. 1699-1706.
doi:10.1063/1.1728420
[18] T. K. Dey and M. Tripathi, “Thermal Properties of Sili-
con Powder Filled High-Density Polyethylene Compos-
ites,” Thermochimica Acta, Vol. 502, No. 1-2, 2010, pp.
35-42. doi:10.1016/j.tca.2010.02.002
Copyright © 2011 SciRes. OJCM